SPECpower_ssj2008
Host 'WIN-SUT106' Performance Report
Copyright © 2007-2019 Standard Performance Evaluation Corporation
| New H3C Technologies Co., Ltd. H3C UniServer B5700 G3 | ssj_ops@100% = 5,677,961 ssj_ops@100% per JVM = 1,419,490 |
||||
| Test Sponsor: | New H3C Technologies Co., Ltd. | SPEC License #: | 9066 | Test Method: | Multi Node |
| Tested By: | New H3C Technologies Co., Ltd. | Test Location: | Hangzhou, Zhejiang, China | Test Date: | May 15, 2019 |
| Hardware Availability: | Jan-2019 | Software Availability: | Jan-2019 | Publication: | Jun 12, 2019 |
| System Source: | Single Supplier | System Designation: | Server | Power Provisioning: | Line-powered |
| Target Load | Actual Load | ssj_ops | |
|---|---|---|---|
| Target | Actual | ||
| Calibration 1 | 5,680,945 | ||
| Calibration 2 | 5,677,288 | ||
| Calibration 3 | 5,685,051 | ||
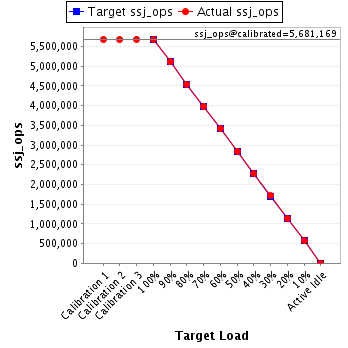
| ssj_ops@calibrated=5,681,169 | |||
| 100% | 99.9% | 5,681,169 | 5,677,961 |
| 90% | 90.0% | 5,113,052 | 5,110,588 |
| 80% | 80.0% | 4,544,935 | 4,545,816 |
| 70% | 70.0% | 3,976,819 | 3,975,532 |
| 60% | 60.0% | 3,408,702 | 3,410,264 |
| 50% | 50.0% | 2,840,585 | 2,841,547 |
| 40% | 40.0% | 2,272,468 | 2,272,275 |
| 30% | 30.0% | 1,704,351 | 1,706,517 |
| 20% | 20.0% | 1,136,234 | 1,134,139 |
| 10% | 10.0% | 568,117 | 567,171 |
| Active Idle | 0 | 0 | |
| Set Identifier: | sut |
| Set Description: | System Under Test |
| # of Identical Nodes: | 10 |
| Comment: | SUT |
| Hardware | |
|---|---|
| Hardware Vendor: | New H3C Technologies Co., Ltd. |
| Model: | H3C UniServer B5700 G3 |
| Form Factor: | Other |
| CPU Name: | Intel Xeon Platinum 8180 2.50GHz |
| CPU Characteristics: | 28-Core, 2.50 GHz, 38.5 MB L3 Cache |
| CPU Frequency (MHz): | 2500 |
| CPU(s) Enabled: | 56 cores, 2 chips, 28 cores/chip |
| Hardware Threads: | 112 (2 / core) |
| CPU(s) Orderable: | 1,2 chips |
| Primary Cache: | 32 KB I + 32 KB D on chip per core |
| Secondary Cache: | 1 MB I+D on chip per core |
| Tertiary Cache: | 39424 KB I+D on chip per chip |
| Other Cache: | None |
| Memory Amount (GB): | 192.0 |
| # and size of DIMM: | 12 x 16384 MB |
| Memory Details: | 12 x 16GB 2Rx8 PC4-2666-V ECC;slots A1, A2, A3, A4, A5, A6, B1, B2, B3, B4, B5, B6 populated |
| Power Supply Quantity and Rating (W): | None |
| Power Supply Details: | Shared |
| Disk Drive: | SATA DOM 128GB P/N DESSH-A28D09BCADCA |
| Disk Controller: | Integrated SATA controller |
| # and type of Network Interface Cards (NICs) Installed: | 1 x Intel I350 Gigabit Ethernet Controller |
| NICs Enabled in Firmware / OS / Connected: | 2/2/1 |
| Network Speed (Mbit): | 1000 |
| Keyboard: | None |
| Mouse: | None |
| Monitor: | None |
| Optical Drives: | No |
| Other Hardware: | None |
| Software | |
|---|---|
| Power Management: | Balanced Mode enabled in OS (see SUT Notes) |
| Operating System (OS): | Microsoft Windows Server 2012 R2 Datacenter |
| OS Version: | Version 6.3 (Build 9600) |
| Filesystem: | NTFS |
| JVM Vendor: | Oracle Corporation |
| JVM Version: | Java HotSpot(TM) 64-Bit Server VM (build 24.80-b11, mixed mode), version 1.7.0_80 |
| JVM Command-line Options: | -server -Xmn19g -Xms21g -Xmx21g -XX:SurvivorRatio=1 -XX:TargetSurvivorRatio=99 -XX:ParallelGCThreads=28 -XX:AllocatePrefetchDistance=256 -XX:AllocatePrefetchLines=4 -XX:LoopUnrollLimit=45 -XX:InitialTenuringThreshold=12 -XX:MaxTenuringThreshold=15 -XX:InlineSmallCode=9000 -XX:MaxInlineSize=270 -XX:FreqInlineSize=6000 -XX:+UseLargePages -XX:+UseParallelOldGC -XX:+AggressiveOpts |
| JVM Affinity: | start /NODE [0,2] /AFFINITY [0xFC0FF00FC0FF];start /NODE [1,3] /AFFINITY [0xFF03F00FF03F] |
| JVM Instances: | 4 |
| JVM Initial Heap (MB): | 21000 |
| JVM Maximum Heap (MB): | 21000 |
| JVM Address Bits: | 64 |
| Boot Firmware Version: | 2.00.25 |
| Management Firmware Version: | UIS-OM 1.00.10 |
| Workload Version: | SSJ 1.2.10 |
| Director Location: | Controller |
| Other Software: | Microsoft Windows KB3021910, clearcompressionflag.exe, KB2919355, KB2932046, KB2959977, KB2937592, KB2938439, KB2934018, KB4056898, patched to this test system in May 6, 2019 |
| JVM Instance | ssj_ops@100% |
|---|---|
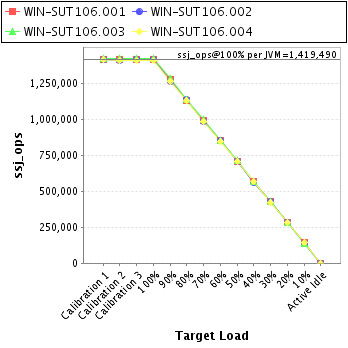
| WIN-SUT106.001 | 1,420,402 |
| WIN-SUT106.002 | 1,418,692 |
| WIN-SUT106.003 | 1,425,240 |
| WIN-SUT106.004 | 1,413,627 |
| ssj_ops@100% | 5,677,961 |
| ssj_ops@100% per JVM | 1,419,490 |
| Target Load | Actual Load | ssj_ops | |
|---|---|---|---|
| Target | Actual | ||
| Calibration 1 | 1,421,817 | ||
| Calibration 2 | 1,421,317 | ||
| Calibration 3 | 1,422,709 | ||
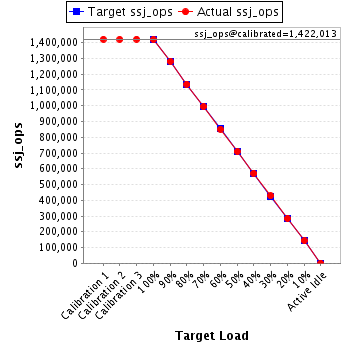
| ssj_ops@calibrated=1,422,013 | |||
| 100% | 99.9% | 1,422,013 | 1,420,402 |
| 90% | 90.1% | 1,279,812 | 1,281,801 |
| 80% | 79.9% | 1,137,610 | 1,136,676 |
| 70% | 70.0% | 995,409 | 995,262 |
| 60% | 59.9% | 853,208 | 851,962 |
| 50% | 49.9% | 711,007 | 709,612 |
| 40% | 40.1% | 568,805 | 570,282 |
| 30% | 30.1% | 426,604 | 427,527 |
| 20% | 20.0% | 284,403 | 284,106 |
| 10% | 10.1% | 142,201 | 143,720 |
| Active Idle | 0 | 0 | |
| Target Load | Actual Load | ssj_ops | |
|---|---|---|---|
| Target | Actual | ||
| Calibration 1 | 1,416,280 | ||
| Calibration 2 | 1,414,625 | ||
| Calibration 3 | 1,419,710 | ||
| ssj_ops@calibrated=1,417,167 | |||
| 100% | 100.1% | 1,417,167 | 1,418,692 |
| 90% | 89.5% | 1,275,450 | 1,269,048 |
| 80% | 80.3% | 1,133,734 | 1,137,431 |
| 70% | 69.9% | 992,017 | 990,734 |
| 60% | 60.1% | 850,300 | 852,001 |
| 50% | 50.0% | 708,584 | 709,061 |
| 40% | 39.8% | 566,867 | 564,005 |
| 30% | 30.1% | 425,150 | 427,192 |
| 20% | 20.0% | 283,433 | 283,616 |
| 10% | 9.9% | 141,717 | 140,576 |
| Active Idle | 0 | 0 | |

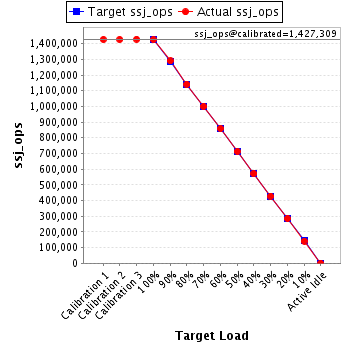
| Target Load | Actual Load | ssj_ops | |
|---|---|---|---|
| Target | Actual | ||
| Calibration 1 | 1,426,549 | ||
| Calibration 2 | 1,426,070 | ||
| Calibration 3 | 1,428,548 | ||
| ssj_ops@calibrated=1,427,309 | |||
| 100% | 99.9% | 1,427,309 | 1,425,240 |
| 90% | 90.4% | 1,284,578 | 1,290,280 |
| 80% | 80.0% | 1,141,847 | 1,141,159 |
| 70% | 70.1% | 999,116 | 1,001,141 |
| 60% | 60.1% | 856,385 | 858,488 |
| 50% | 50.0% | 713,654 | 713,354 |
| 40% | 40.0% | 570,924 | 570,362 |
| 30% | 30.0% | 428,193 | 428,402 |
| 20% | 19.9% | 285,462 | 284,390 |
| 10% | 9.9% | 142,731 | 141,049 |
| Active Idle | 0 | 0 | |
| Target Load | Actual Load | ssj_ops | |
|---|---|---|---|
| Target | Actual | ||
| Calibration 1 | 1,416,299 | ||
| Calibration 2 | 1,415,276 | ||
| Calibration 3 | 1,414,085 | ||
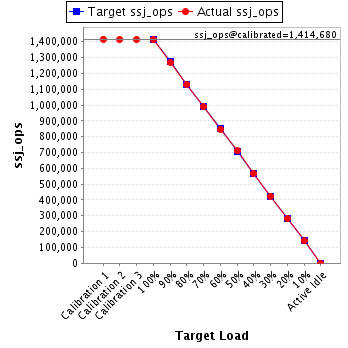
| ssj_ops@calibrated=1,414,680 | |||
| 100% | 99.9% | 1,414,680 | 1,413,627 |
| 90% | 89.7% | 1,273,212 | 1,269,459 |
| 80% | 79.9% | 1,131,744 | 1,130,550 |
| 70% | 69.9% | 990,276 | 988,396 |
| 60% | 59.9% | 848,808 | 847,812 |
| 50% | 50.2% | 707,340 | 709,521 |
| 40% | 40.1% | 565,872 | 567,625 |
| 30% | 29.9% | 424,404 | 423,396 |
| 20% | 19.9% | 282,936 | 282,028 |
| 10% | 10.0% | 141,468 | 141,826 |
| Active Idle | 0 | 0 | |