
SPECpower_ssj2008
Host 'WIN-SUT107' Performance Report
Copyright © 2007-2019 Standard Performance Evaluation Corporation
| New H3C Technologies Co., Ltd. H3C UniServer B5700 G3 | ssj_ops@100% = 5,699,021 ssj_ops@100% per JVM = 1,424,755 |
||||
| Test Sponsor: | New H3C Technologies Co., Ltd. | SPEC License #: | 9066 | Test Method: | Multi Node |
| Tested By: | New H3C Technologies Co., Ltd. | Test Location: | Hangzhou, Zhejiang, China | Test Date: | May 15, 2019 |
| Hardware Availability: | Jan-2019 | Software Availability: | Jan-2019 | Publication: | Jun 12, 2019 |
| System Source: | Single Supplier | System Designation: | Server | Power Provisioning: | Line-powered |
| Target Load | Actual Load | ssj_ops | |
|---|---|---|---|
| Target | Actual | ||
| Calibration 1 | 5,709,784 | ||
| Calibration 2 | 5,700,543 | ||
| Calibration 3 | 5,709,567 | ||
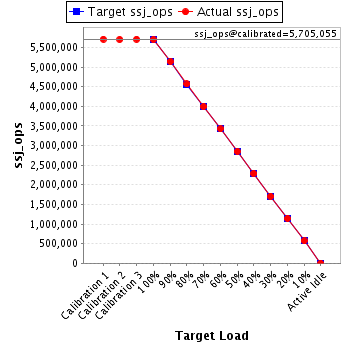
| ssj_ops@calibrated=5,705,055 | |||
| 100% | 99.9% | 5,705,055 | 5,699,021 |
| 90% | 90.1% | 5,134,550 | 5,139,643 |
| 80% | 80.1% | 4,564,044 | 4,568,050 |
| 70% | 70.0% | 3,993,539 | 3,993,788 |
| 60% | 60.0% | 3,423,033 | 3,422,274 |
| 50% | 50.0% | 2,852,528 | 2,849,912 |
| 40% | 40.0% | 2,282,022 | 2,282,965 |
| 30% | 29.9% | 1,711,517 | 1,708,051 |
| 20% | 20.0% | 1,141,011 | 1,140,931 |
| 10% | 10.0% | 570,506 | 570,223 |
| Active Idle | 0 | 0 | |
| Set Identifier: | sut |
| Set Description: | System Under Test |
| # of Identical Nodes: | 10 |
| Comment: | SUT |
| Hardware | |
|---|---|
| Hardware Vendor: | New H3C Technologies Co., Ltd. |
| Model: | H3C UniServer B5700 G3 |
| Form Factor: | Other |
| CPU Name: | Intel Xeon Platinum 8180 2.50GHz |
| CPU Characteristics: | 28-Core, 2.50 GHz, 38.5 MB L3 Cache |
| CPU Frequency (MHz): | 2500 |
| CPU(s) Enabled: | 56 cores, 2 chips, 28 cores/chip |
| Hardware Threads: | 112 (2 / core) |
| CPU(s) Orderable: | 1,2 chips |
| Primary Cache: | 32 KB I + 32 KB D on chip per core |
| Secondary Cache: | 1 MB I+D on chip per core |
| Tertiary Cache: | 39424 KB I+D on chip per chip |
| Other Cache: | None |
| Memory Amount (GB): | 192.0 |
| # and size of DIMM: | 12 x 16384 MB |
| Memory Details: | 12 x 16GB 2Rx8 PC4-2666-V ECC;slots A1, A2, A3, A4, A5, A6, B1, B2, B3, B4, B5, B6 populated |
| Power Supply Quantity and Rating (W): | None |
| Power Supply Details: | Shared |
| Disk Drive: | SATA DOM 128GB P/N DESSH-A28D09BCADCA |
| Disk Controller: | Integrated SATA controller |
| # and type of Network Interface Cards (NICs) Installed: | 1 x Intel I350 Gigabit Ethernet Controller |
| NICs Enabled in Firmware / OS / Connected: | 2/2/1 |
| Network Speed (Mbit): | 1000 |
| Keyboard: | None |
| Mouse: | None |
| Monitor: | None |
| Optical Drives: | No |
| Other Hardware: | None |
| Software | |
|---|---|
| Power Management: | Balanced Mode enabled in OS (see SUT Notes) |
| Operating System (OS): | Microsoft Windows Server 2012 R2 Datacenter |
| OS Version: | Version 6.3 (Build 9600) |
| Filesystem: | NTFS |
| JVM Vendor: | Oracle Corporation |
| JVM Version: | Java HotSpot(TM) 64-Bit Server VM (build 24.80-b11, mixed mode), version 1.7.0_80 |
| JVM Command-line Options: | -server -Xmn19g -Xms21g -Xmx21g -XX:SurvivorRatio=1 -XX:TargetSurvivorRatio=99 -XX:ParallelGCThreads=28 -XX:AllocatePrefetchDistance=256 -XX:AllocatePrefetchLines=4 -XX:LoopUnrollLimit=45 -XX:InitialTenuringThreshold=12 -XX:MaxTenuringThreshold=15 -XX:InlineSmallCode=9000 -XX:MaxInlineSize=270 -XX:FreqInlineSize=6000 -XX:+UseLargePages -XX:+UseParallelOldGC -XX:+AggressiveOpts |
| JVM Affinity: | start /NODE [0,2] /AFFINITY [0xFC0FF00FC0FF];start /NODE [1,3] /AFFINITY [0xFF03F00FF03F] |
| JVM Instances: | 4 |
| JVM Initial Heap (MB): | 21000 |
| JVM Maximum Heap (MB): | 21000 |
| JVM Address Bits: | 64 |
| Boot Firmware Version: | 2.00.25 |
| Management Firmware Version: | UIS-OM 1.00.10 |
| Workload Version: | SSJ 1.2.10 |
| Director Location: | Controller |
| Other Software: | Microsoft Windows KB3021910, clearcompressionflag.exe, KB2919355, KB2932046, KB2959977, KB2937592, KB2938439, KB2934018, KB4056898, patched to this test system in May 6, 2019 |
| JVM Instance | ssj_ops@100% |
|---|---|
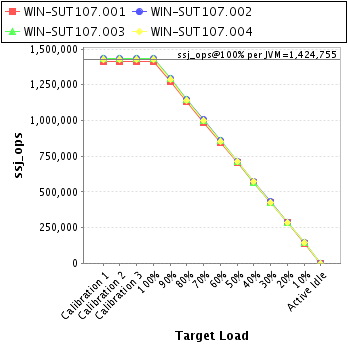
| WIN-SUT107.001 | 1,409,568 |
| WIN-SUT107.002 | 1,431,672 |
| WIN-SUT107.003 | 1,431,411 |
| WIN-SUT107.004 | 1,426,368 |
| ssj_ops@100% | 5,699,021 |
| ssj_ops@100% per JVM | 1,424,755 |
| Target Load | Actual Load | ssj_ops | |
|---|---|---|---|
| Target | Actual | ||
| Calibration 1 | 1,415,902 | ||
| Calibration 2 | 1,411,390 | ||
| Calibration 3 | 1,413,843 | ||
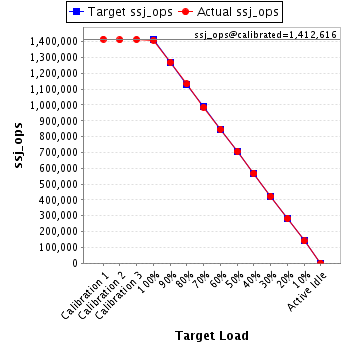
| ssj_ops@calibrated=1,412,616 | |||
| 100% | 99.8% | 1,412,616 | 1,409,568 |
| 90% | 89.9% | 1,271,355 | 1,270,027 |
| 80% | 80.2% | 1,130,093 | 1,132,789 |
| 70% | 69.9% | 988,831 | 986,755 |
| 60% | 59.9% | 847,570 | 846,181 |
| 50% | 50.0% | 706,308 | 706,490 |
| 40% | 40.2% | 565,046 | 567,178 |
| 30% | 30.0% | 423,785 | 423,094 |
| 20% | 20.0% | 282,523 | 282,869 |
| 10% | 10.0% | 141,262 | 140,695 |
| Active Idle | 0 | 0 | |
| Target Load | Actual Load | ssj_ops | |
|---|---|---|---|
| Target | Actual | ||
| Calibration 1 | 1,433,657 | ||
| Calibration 2 | 1,431,325 | ||
| Calibration 3 | 1,434,496 | ||
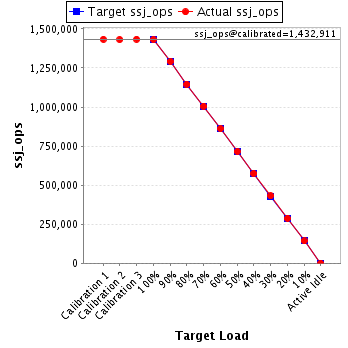
| ssj_ops@calibrated=1,432,911 | |||
| 100% | 99.9% | 1,432,911 | 1,431,672 |
| 90% | 90.2% | 1,289,620 | 1,292,067 |
| 80% | 80.0% | 1,146,329 | 1,146,140 |
| 70% | 70.2% | 1,003,037 | 1,006,363 |
| 60% | 60.1% | 859,746 | 861,046 |
| 50% | 49.9% | 716,455 | 715,482 |
| 40% | 40.0% | 573,164 | 573,636 |
| 30% | 30.1% | 429,873 | 430,611 |
| 20% | 20.1% | 286,582 | 287,851 |
| 10% | 10.0% | 143,291 | 142,757 |
| Active Idle | 0 | 0 | |
| Target Load | Actual Load | ssj_ops | |
|---|---|---|---|
| Target | Actual | ||
| Calibration 1 | 1,436,045 | ||
| Calibration 2 | 1,431,423 | ||
| Calibration 3 | 1,433,372 | ||
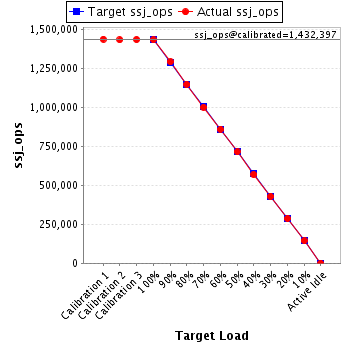
| ssj_ops@calibrated=1,432,397 | |||
| 100% | 99.9% | 1,432,397 | 1,431,411 |
| 90% | 90.1% | 1,289,158 | 1,291,039 |
| 80% | 80.0% | 1,145,918 | 1,146,326 |
| 70% | 69.8% | 1,002,678 | 1,000,246 |
| 60% | 60.0% | 859,438 | 859,786 |
| 50% | 49.8% | 716,199 | 713,626 |
| 40% | 39.7% | 572,959 | 568,920 |
| 30% | 29.9% | 429,719 | 428,462 |
| 20% | 20.0% | 286,479 | 285,965 |
| 10% | 10.1% | 143,240 | 144,488 |
| Active Idle | 0 | 0 | |
| Target Load | Actual Load | ssj_ops | |
|---|---|---|---|
| Target | Actual | ||
| Calibration 1 | 1,424,181 | ||
| Calibration 2 | 1,426,405 | ||
| Calibration 3 | 1,427,857 | ||
| ssj_ops@calibrated=1,427,131 | |||
| 100% | 99.9% | 1,427,131 | 1,426,368 |
| 90% | 90.1% | 1,284,418 | 1,286,510 |
| 80% | 80.1% | 1,141,705 | 1,142,795 |
| 70% | 70.1% | 998,992 | 1,000,423 |
| 60% | 59.9% | 856,279 | 855,261 |
| 50% | 50.1% | 713,565 | 714,315 |
| 40% | 40.2% | 570,852 | 573,230 |
| 30% | 29.8% | 428,139 | 425,884 |
| 20% | 19.9% | 285,426 | 284,247 |
| 10% | 10.0% | 142,713 | 142,282 |
| Active Idle | 0 | 0 | |
