
SPECpower_ssj2008
Host 'WIN-SUT108' Performance Report
Copyright © 2007-2019 Standard Performance Evaluation Corporation
| New H3C Technologies Co., Ltd. H3C UniServer B5700 G3 | ssj_ops@100% = 5,703,371 ssj_ops@100% per JVM = 1,425,843 |
||||
| Test Sponsor: | New H3C Technologies Co., Ltd. | SPEC License #: | 9066 | Test Method: | Multi Node |
| Tested By: | New H3C Technologies Co., Ltd. | Test Location: | Hangzhou, Zhejiang, China | Test Date: | May 15, 2019 |
| Hardware Availability: | Jan-2019 | Software Availability: | Jan-2019 | Publication: | Jun 12, 2019 |
| System Source: | Single Supplier | System Designation: | Server | Power Provisioning: | Line-powered |
| Target Load | Actual Load | ssj_ops | |
|---|---|---|---|
| Target | Actual | ||
| Calibration 1 | 5,710,979 | ||
| Calibration 2 | 5,695,045 | ||
| Calibration 3 | 5,713,886 | ||
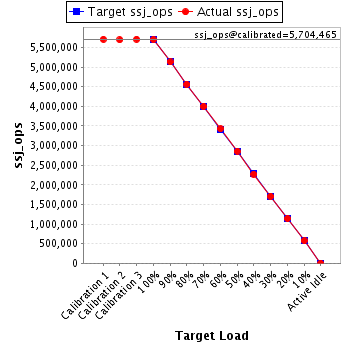
| ssj_ops@calibrated=5,704,465 | |||
| 100% | 100.0% | 5,704,465 | 5,703,371 |
| 90% | 90.0% | 5,134,019 | 5,132,826 |
| 80% | 80.0% | 4,563,572 | 4,564,063 |
| 70% | 70.2% | 3,993,126 | 4,002,388 |
| 60% | 60.1% | 3,422,679 | 3,426,786 |
| 50% | 50.1% | 2,852,233 | 2,858,215 |
| 40% | 39.9% | 2,281,786 | 2,273,681 |
| 30% | 30.0% | 1,711,340 | 1,708,501 |
| 20% | 20.0% | 1,140,893 | 1,139,153 |
| 10% | 10.0% | 570,447 | 572,440 |
| Active Idle | 0 | 0 | |
| Set Identifier: | sut |
| Set Description: | System Under Test |
| # of Identical Nodes: | 10 |
| Comment: | SUT |
| Hardware | |
|---|---|
| Hardware Vendor: | New H3C Technologies Co., Ltd. |
| Model: | H3C UniServer B5700 G3 |
| Form Factor: | Other |
| CPU Name: | Intel Xeon Platinum 8180 2.50GHz |
| CPU Characteristics: | 28-Core, 2.50 GHz, 38.5 MB L3 Cache |
| CPU Frequency (MHz): | 2500 |
| CPU(s) Enabled: | 56 cores, 2 chips, 28 cores/chip |
| Hardware Threads: | 112 (2 / core) |
| CPU(s) Orderable: | 1,2 chips |
| Primary Cache: | 32 KB I + 32 KB D on chip per core |
| Secondary Cache: | 1 MB I+D on chip per core |
| Tertiary Cache: | 39424 KB I+D on chip per chip |
| Other Cache: | None |
| Memory Amount (GB): | 192.0 |
| # and size of DIMM: | 12 x 16384 MB |
| Memory Details: | 12 x 16GB 2Rx8 PC4-2666-V ECC;slots A1, A2, A3, A4, A5, A6, B1, B2, B3, B4, B5, B6 populated |
| Power Supply Quantity and Rating (W): | None |
| Power Supply Details: | Shared |
| Disk Drive: | SATA DOM 128GB P/N DESSH-A28D09BCADCA |
| Disk Controller: | Integrated SATA controller |
| # and type of Network Interface Cards (NICs) Installed: | 1 x Intel I350 Gigabit Ethernet Controller |
| NICs Enabled in Firmware / OS / Connected: | 2/2/1 |
| Network Speed (Mbit): | 1000 |
| Keyboard: | None |
| Mouse: | None |
| Monitor: | None |
| Optical Drives: | No |
| Other Hardware: | None |
| Software | |
|---|---|
| Power Management: | Balanced Mode enabled in OS (see SUT Notes) |
| Operating System (OS): | Microsoft Windows Server 2012 R2 Datacenter |
| OS Version: | Version 6.3 (Build 9600) |
| Filesystem: | NTFS |
| JVM Vendor: | Oracle Corporation |
| JVM Version: | Java HotSpot(TM) 64-Bit Server VM (build 24.80-b11, mixed mode), version 1.7.0_80 |
| JVM Command-line Options: | -server -Xmn19g -Xms21g -Xmx21g -XX:SurvivorRatio=1 -XX:TargetSurvivorRatio=99 -XX:ParallelGCThreads=28 -XX:AllocatePrefetchDistance=256 -XX:AllocatePrefetchLines=4 -XX:LoopUnrollLimit=45 -XX:InitialTenuringThreshold=12 -XX:MaxTenuringThreshold=15 -XX:InlineSmallCode=9000 -XX:MaxInlineSize=270 -XX:FreqInlineSize=6000 -XX:+UseLargePages -XX:+UseParallelOldGC -XX:+AggressiveOpts |
| JVM Affinity: | start /NODE [0,2] /AFFINITY [0xFC0FF00FC0FF];start /NODE [1,3] /AFFINITY [0xFF03F00FF03F] |
| JVM Instances: | 4 |
| JVM Initial Heap (MB): | 21000 |
| JVM Maximum Heap (MB): | 21000 |
| JVM Address Bits: | 64 |
| Boot Firmware Version: | 2.00.25 |
| Management Firmware Version: | UIS-OM 1.00.10 |
| Workload Version: | SSJ 1.2.10 |
| Director Location: | Controller |
| Other Software: | Microsoft Windows KB3021910, clearcompressionflag.exe, KB2919355, KB2932046, KB2959977, KB2937592, KB2938439, KB2934018, KB4056898, patched to this test system in May 6, 2019 |
| JVM Instance | ssj_ops@100% |
|---|---|
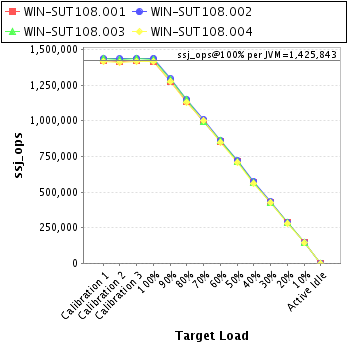
| WIN-SUT108.001 | 1,417,913 |
| WIN-SUT108.002 | 1,438,907 |
| WIN-SUT108.003 | 1,432,892 |
| WIN-SUT108.004 | 1,413,659 |
| ssj_ops@100% | 5,703,371 |
| ssj_ops@100% per JVM | 1,425,843 |
| Target Load | Actual Load | ssj_ops | |
|---|---|---|---|
| Target | Actual | ||
| Calibration 1 | 1,422,961 | ||
| Calibration 2 | 1,419,336 | ||
| Calibration 3 | 1,420,843 | ||
| ssj_ops@calibrated=1,420,089 | |||
| 100% | 99.8% | 1,420,089 | 1,417,913 |
| 90% | 89.9% | 1,278,080 | 1,277,089 |
| 80% | 79.8% | 1,136,071 | 1,132,991 |
| 70% | 69.9% | 994,063 | 992,964 |
| 60% | 60.1% | 852,054 | 853,451 |
| 50% | 50.2% | 710,045 | 712,237 |
| 40% | 40.0% | 568,036 | 568,081 |
| 30% | 30.0% | 426,027 | 426,084 |
| 20% | 20.0% | 284,018 | 283,833 |
| 10% | 10.1% | 142,009 | 142,788 |
| Active Idle | 0 | 0 | |

| Target Load | Actual Load | ssj_ops | |
|---|---|---|---|
| Target | Actual | ||
| Calibration 1 | 1,436,405 | ||
| Calibration 2 | 1,434,376 | ||
| Calibration 3 | 1,439,556 | ||
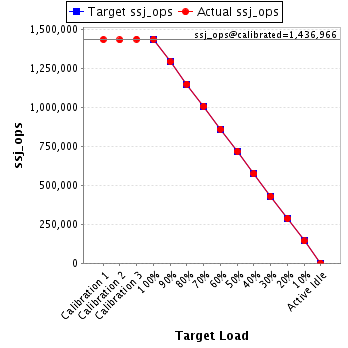
| ssj_ops@calibrated=1,436,966 | |||
| 100% | 100.1% | 1,436,966 | 1,438,907 |
| 90% | 90.1% | 1,293,270 | 1,294,570 |
| 80% | 80.1% | 1,149,573 | 1,150,465 |
| 70% | 70.2% | 1,005,876 | 1,009,252 |
| 60% | 60.0% | 862,180 | 861,981 |
| 50% | 50.0% | 718,483 | 718,738 |
| 40% | 39.9% | 574,787 | 574,031 |
| 30% | 30.0% | 431,090 | 430,491 |
| 20% | 20.0% | 287,393 | 287,599 |
| 10% | 10.0% | 143,697 | 143,086 |
| Active Idle | 0 | 0 | |
| Target Load | Actual Load | ssj_ops | |
|---|---|---|---|
| Target | Actual | ||
| Calibration 1 | 1,434,448 | ||
| Calibration 2 | 1,428,803 | ||
| Calibration 3 | 1,434,730 | ||
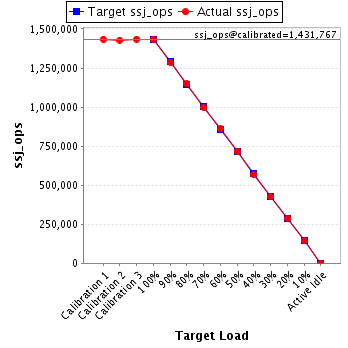
| ssj_ops@calibrated=1,431,767 | |||
| 100% | 100.1% | 1,431,767 | 1,432,892 |
| 90% | 89.9% | 1,288,590 | 1,287,197 |
| 80% | 80.3% | 1,145,413 | 1,149,041 |
| 70% | 69.7% | 1,002,237 | 998,511 |
| 60% | 60.1% | 859,060 | 860,237 |
| 50% | 50.1% | 715,883 | 716,965 |
| 40% | 39.8% | 572,707 | 569,858 |
| 30% | 29.9% | 429,530 | 427,760 |
| 20% | 20.0% | 286,353 | 286,009 |
| 10% | 10.1% | 143,177 | 143,982 |
| Active Idle | 0 | 0 | |
| Target Load | Actual Load | ssj_ops | |
|---|---|---|---|
| Target | Actual | ||
| Calibration 1 | 1,417,165 | ||
| Calibration 2 | 1,412,530 | ||
| Calibration 3 | 1,418,756 | ||
| ssj_ops@calibrated=1,415,643 | |||
| 100% | 99.9% | 1,415,643 | 1,413,659 |
| 90% | 90.0% | 1,274,079 | 1,273,971 |
| 80% | 79.9% | 1,132,514 | 1,131,566 |
| 70% | 70.8% | 990,950 | 1,001,660 |
| 60% | 60.1% | 849,386 | 851,116 |
| 50% | 50.2% | 707,821 | 710,274 |
| 40% | 39.7% | 566,257 | 561,711 |
| 30% | 30.0% | 424,693 | 424,166 |
| 20% | 19.9% | 283,129 | 281,712 |
| 10% | 10.1% | 141,564 | 142,583 |
| Active Idle | 0 | 0 | |
