SPECpower_ssj2008
Host 'WIN-SUT110' Performance Report
Copyright © 2007-2019 Standard Performance Evaluation Corporation
| New H3C Technologies Co., Ltd. H3C UniServer B5700 G3 | ssj_ops@100% = 5,703,694 ssj_ops@100% per JVM = 1,425,924 |
||||
| Test Sponsor: | New H3C Technologies Co., Ltd. | SPEC License #: | 9066 | Test Method: | Multi Node |
| Tested By: | New H3C Technologies Co., Ltd. | Test Location: | Hangzhou, Zhejiang, China | Test Date: | May 15, 2019 |
| Hardware Availability: | Jan-2019 | Software Availability: | Jan-2019 | Publication: | Jun 12, 2019 |
| System Source: | Single Supplier | System Designation: | Server | Power Provisioning: | Line-powered |
| Target Load | Actual Load | ssj_ops | |
|---|---|---|---|
| Target | Actual | ||
| Calibration 1 | 5,691,936 | ||
| Calibration 2 | 5,706,419 | ||
| Calibration 3 | 5,721,958 | ||
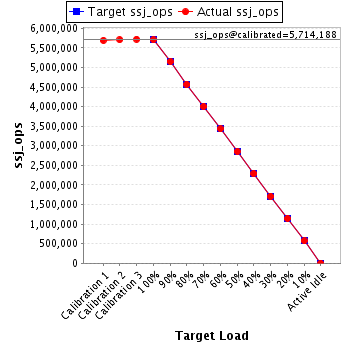
| ssj_ops@calibrated=5,714,188 | |||
| 100% | 99.8% | 5,714,188 | 5,703,694 |
| 90% | 90.1% | 5,142,770 | 5,147,081 |
| 80% | 79.9% | 4,571,351 | 4,566,804 |
| 70% | 70.1% | 3,999,932 | 4,006,622 |
| 60% | 60.0% | 3,428,513 | 3,428,412 |
| 50% | 49.9% | 2,857,094 | 2,853,229 |
| 40% | 40.0% | 2,285,675 | 2,284,985 |
| 30% | 30.0% | 1,714,257 | 1,712,543 |
| 20% | 20.0% | 1,142,838 | 1,143,395 |
| 10% | 10.0% | 571,419 | 571,851 |
| Active Idle | 0 | 0 | |
| Set Identifier: | sut |
| Set Description: | System Under Test |
| # of Identical Nodes: | 10 |
| Comment: | SUT |
| Hardware | |
|---|---|
| Hardware Vendor: | New H3C Technologies Co., Ltd. |
| Model: | H3C UniServer B5700 G3 |
| Form Factor: | Other |
| CPU Name: | Intel Xeon Platinum 8180 2.50GHz |
| CPU Characteristics: | 28-Core, 2.50 GHz, 38.5 MB L3 Cache |
| CPU Frequency (MHz): | 2500 |
| CPU(s) Enabled: | 56 cores, 2 chips, 28 cores/chip |
| Hardware Threads: | 112 (2 / core) |
| CPU(s) Orderable: | 1,2 chips |
| Primary Cache: | 32 KB I + 32 KB D on chip per core |
| Secondary Cache: | 1 MB I+D on chip per core |
| Tertiary Cache: | 39424 KB I+D on chip per chip |
| Other Cache: | None |
| Memory Amount (GB): | 192.0 |
| # and size of DIMM: | 12 x 16384 MB |
| Memory Details: | 12 x 16GB 2Rx8 PC4-2666-V ECC;slots A1, A2, A3, A4, A5, A6, B1, B2, B3, B4, B5, B6 populated |
| Power Supply Quantity and Rating (W): | None |
| Power Supply Details: | Shared |
| Disk Drive: | SATA DOM 128GB P/N DESSH-A28D09BCADCA |
| Disk Controller: | Integrated SATA controller |
| # and type of Network Interface Cards (NICs) Installed: | 1 x Intel I350 Gigabit Ethernet Controller |
| NICs Enabled in Firmware / OS / Connected: | 2/2/1 |
| Network Speed (Mbit): | 1000 |
| Keyboard: | None |
| Mouse: | None |
| Monitor: | None |
| Optical Drives: | No |
| Other Hardware: | None |
| Software | |
|---|---|
| Power Management: | Balanced Mode enabled in OS (see SUT Notes) |
| Operating System (OS): | Microsoft Windows Server 2012 R2 Datacenter |
| OS Version: | Version 6.3 (Build 9600) |
| Filesystem: | NTFS |
| JVM Vendor: | Oracle Corporation |
| JVM Version: | Java HotSpot(TM) 64-Bit Server VM (build 24.80-b11, mixed mode), version 1.7.0_80 |
| JVM Command-line Options: | -server -Xmn19g -Xms21g -Xmx21g -XX:SurvivorRatio=1 -XX:TargetSurvivorRatio=99 -XX:ParallelGCThreads=28 -XX:AllocatePrefetchDistance=256 -XX:AllocatePrefetchLines=4 -XX:LoopUnrollLimit=45 -XX:InitialTenuringThreshold=12 -XX:MaxTenuringThreshold=15 -XX:InlineSmallCode=9000 -XX:MaxInlineSize=270 -XX:FreqInlineSize=6000 -XX:+UseLargePages -XX:+UseParallelOldGC -XX:+AggressiveOpts |
| JVM Affinity: | start /NODE [0,2] /AFFINITY [0xFC0FF00FC0FF];start /NODE [1,3] /AFFINITY [0xFF03F00FF03F] |
| JVM Instances: | 4 |
| JVM Initial Heap (MB): | 21000 |
| JVM Maximum Heap (MB): | 21000 |
| JVM Address Bits: | 64 |
| Boot Firmware Version: | 2.00.25 |
| Management Firmware Version: | UIS-OM 1.00.10 |
| Workload Version: | SSJ 1.2.10 |
| Director Location: | Controller |
| Other Software: | Microsoft Windows KB3021910, clearcompressionflag.exe, KB2919355, KB2932046, KB2959977, KB2937592, KB2938439, KB2934018, KB4056898, patched to this test system in May 6, 2019 |
| JVM Instance | ssj_ops@100% |
|---|---|
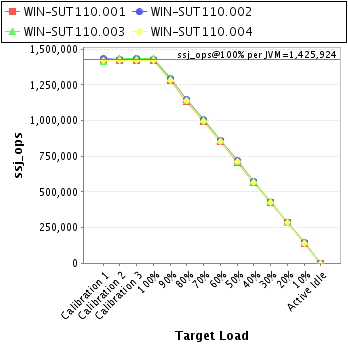
| WIN-SUT110.001 | 1,420,049 |
| WIN-SUT110.002 | 1,429,890 |
| WIN-SUT110.003 | 1,434,940 |
| WIN-SUT110.004 | 1,418,815 |
| ssj_ops@100% | 5,703,694 |
| ssj_ops@100% per JVM | 1,425,924 |
| Target Load | Actual Load | ssj_ops | |
|---|---|---|---|
| Target | Actual | ||
| Calibration 1 | 1,419,827 | ||
| Calibration 2 | 1,419,441 | ||
| Calibration 3 | 1,424,257 | ||
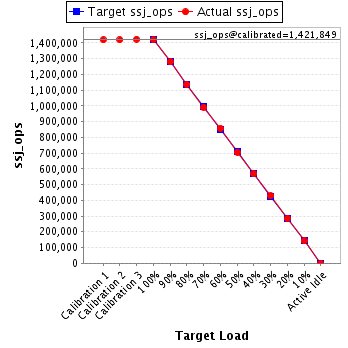
| ssj_ops@calibrated=1,421,849 | |||
| 100% | 99.9% | 1,421,849 | 1,420,049 |
| 90% | 90.0% | 1,279,664 | 1,279,797 |
| 80% | 80.0% | 1,137,479 | 1,136,780 |
| 70% | 69.8% | 995,294 | 992,717 |
| 60% | 60.3% | 853,109 | 857,222 |
| 50% | 49.7% | 710,925 | 706,713 |
| 40% | 39.9% | 568,740 | 567,759 |
| 30% | 30.1% | 426,555 | 427,530 |
| 20% | 20.0% | 284,370 | 284,098 |
| 10% | 10.0% | 142,185 | 141,947 |
| Active Idle | 0 | 0 | |
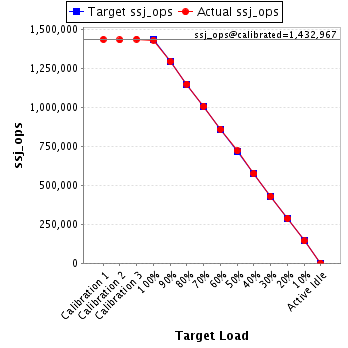
| Target Load | Actual Load | ssj_ops | |
|---|---|---|---|
| Target | Actual | ||
| Calibration 1 | 1,433,123 | ||
| Calibration 2 | 1,430,444 | ||
| Calibration 3 | 1,435,491 | ||
| ssj_ops@calibrated=1,432,967 | |||
| 100% | 99.8% | 1,432,967 | 1,429,890 |
| 90% | 90.2% | 1,289,671 | 1,292,710 |
| 80% | 80.1% | 1,146,374 | 1,147,715 |
| 70% | 70.2% | 1,003,077 | 1,005,754 |
| 60% | 59.9% | 859,780 | 858,505 |
| 50% | 50.2% | 716,484 | 719,520 |
| 40% | 40.0% | 573,187 | 573,760 |
| 30% | 29.9% | 429,890 | 428,998 |
| 20% | 20.0% | 286,593 | 287,278 |
| 10% | 10.0% | 143,297 | 143,173 |
| Active Idle | 0 | 0 | |
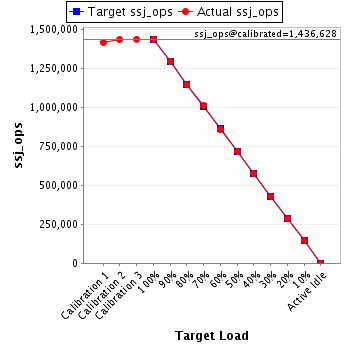
| Target Load | Actual Load | ssj_ops | |
|---|---|---|---|
| Target | Actual | ||
| Calibration 1 | 1,416,168 | ||
| Calibration 2 | 1,435,242 | ||
| Calibration 3 | 1,438,013 | ||
| ssj_ops@calibrated=1,436,628 | |||
| 100% | 99.9% | 1,436,628 | 1,434,940 |
| 90% | 90.0% | 1,292,965 | 1,293,672 |
| 80% | 79.6% | 1,149,302 | 1,144,178 |
| 70% | 70.4% | 1,005,639 | 1,011,002 |
| 60% | 59.9% | 861,977 | 860,047 |
| 50% | 49.9% | 718,314 | 716,814 |
| 40% | 40.0% | 574,651 | 575,190 |
| 30% | 30.0% | 430,988 | 430,432 |
| 20% | 20.0% | 287,326 | 287,849 |
| 10% | 10.1% | 143,663 | 145,033 |
| Active Idle | 0 | 0 | |
| Target Load | Actual Load | ssj_ops | |
|---|---|---|---|
| Target | Actual | ||
| Calibration 1 | 1,422,818 | ||
| Calibration 2 | 1,421,292 | ||
| Calibration 3 | 1,424,197 | ||
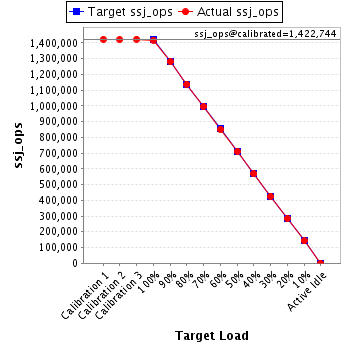
| ssj_ops@calibrated=1,422,744 | |||
| 100% | 99.7% | 1,422,744 | 1,418,815 |
| 90% | 90.0% | 1,280,470 | 1,280,902 |
| 80% | 80.0% | 1,138,196 | 1,138,131 |
| 70% | 70.1% | 995,921 | 997,150 |
| 60% | 59.9% | 853,647 | 852,639 |
| 50% | 49.9% | 711,372 | 710,182 |
| 40% | 39.9% | 569,098 | 568,276 |
| 30% | 29.9% | 426,823 | 425,583 |
| 20% | 20.0% | 284,549 | 284,169 |
| 10% | 10.0% | 142,274 | 141,698 |
| Active Idle | 0 | 0 | |