SPECpower_ssj2008
Host 'WIN-SUT110' Performance Report
Copyright © 2007-2019 Standard Performance Evaluation Corporation
| New H3C Technologies Co., Ltd. H3C UniServer B5700 G3 | ssj_ops@100% = 5,694,644 ssj_ops@100% per JVM = 1,423,661 |
||||
| Test Sponsor: | New H3C Technologies Co., Ltd. | SPEC License #: | 9066 | Test Method: | Multi Node |
| Tested By: | New H3C Technologies Co., Ltd. | Test Location: | Hangzhou, Zhejiang, China | Test Date: | May 23, 2019 |
| Hardware Availability: | Jan-2019 | Software Availability: | Jan-2019 | Publication: | Jun 26, 2019 |
| System Source: | Single Supplier | System Designation: | Server | Power Provisioning: | Line-powered |
| Target Load | Actual Load | ssj_ops | |
|---|---|---|---|
| Target | Actual | ||
| Calibration 1 | 5,715,346 | ||
| Calibration 2 | 5,702,098 | ||
| Calibration 3 | 5,708,613 | ||
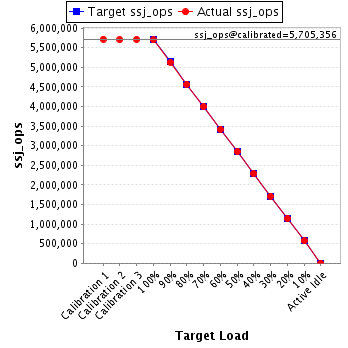
| ssj_ops@calibrated=5,705,356 | |||
| 100% | 99.8% | 5,705,356 | 5,694,644 |
| 90% | 89.8% | 5,134,820 | 5,125,911 |
| 80% | 80.0% | 4,564,284 | 4,561,446 |
| 70% | 70.0% | 3,993,749 | 3,994,074 |
| 60% | 59.9% | 3,423,213 | 3,418,076 |
| 50% | 50.0% | 2,852,678 | 2,851,899 |
| 40% | 40.0% | 2,282,142 | 2,280,732 |
| 30% | 30.0% | 1,711,607 | 1,710,915 |
| 20% | 20.1% | 1,141,071 | 1,145,982 |
| 10% | 10.0% | 570,536 | 572,053 |
| Active Idle | 0 | 0 | |
| Set Identifier: | sut |
| Set Description: | System Under Test |
| # of Identical Nodes: | 15 |
| Comment: | SUT |
| Hardware | |
|---|---|
| Hardware Vendor: | New H3C Technologies Co., Ltd. |
| Model: | H3C UniServer B5700 G3 |
| Form Factor: | other |
| CPU Name: | Intel Xeon Platinum 8180 2.50GHz |
| CPU Characteristics: | 28-Core, 2.50 GHz, 38.5 MB L3 Cache |
| CPU Frequency (MHz): | 2500 |
| CPU(s) Enabled: | 56 cores, 2 chips, 28 cores/chip |
| Hardware Threads: | 112 (2 / core) |
| CPU(s) Orderable: | 1,2 chips |
| Primary Cache: | 32 KB I + 32 KB D on chip per core |
| Secondary Cache: | 1 MB I+D on chip per core |
| Tertiary Cache: | 39424 KB I+D on chip per chip |
| Other Cache: | None |
| Memory Amount (GB): | 192.0 |
| # and size of DIMM: | 12 x 16384 MB |
| Memory Details: | 12 x 16GB 2Rx8 PC4-2666-V ECC;slots A1, A2, A3, A4, A5, A6, B1, B2, B3, B4, B5, B6 populated |
| Power Supply Quantity and Rating (W): | None |
| Power Supply Details: | Shared |
| Disk Drive: | SATA DOM 128GB P/N DESSH-A28D09BCADCA |
| Disk Controller: | Integrated SATA controller |
| # and type of Network Interface Cards (NICs) Installed: | 1 x Intel I350 Gigabit Ethernet Controller |
| NICs Enabled in Firmware / OS / Connected: | 2/2/1 |
| Network Speed (Mbit): | 1000 |
| Keyboard: | None |
| Mouse: | None |
| Monitor: | None |
| Optical Drives: | No |
| Other Hardware: | None |
| Software | |
|---|---|
| Power Management: | Balanced Mode enabled in OS (see SUT Notes) |
| Operating System (OS): | Microsoft Windows Server 2012 R2 Datacenter |
| OS Version: | Version 6.3 (Build 9600) |
| Filesystem: | NTFS |
| JVM Vendor: | Oracle Corporation |
| JVM Version: | Java HotSpot(TM) 64-Bit Server VM (build 24.80-b11, mixed mode), version 1.7.0_80 |
| JVM Command-line Options: | -server -Xmn19g -Xms21g -Xmx21g -XX:SurvivorRatio=1 -XX:TargetSurvivorRatio=99 -XX:ParallelGCThreads=28 -XX:AllocatePrefetchDistance=256 -XX:AllocatePrefetchLines=4 -XX:LoopUnrollLimit=45 -XX:InitialTenuringThreshold=12 -XX:MaxTenuringThreshold=15 -XX:InlineSmallCode=9000 -XX:MaxInlineSize=270 -XX:FreqInlineSize=6000 -XX:+UseLargePages -XX:+UseParallelOldGC -XX:+AggressiveOpts |
| JVM Affinity: | start /NODE [0,2] /AFFINITY [0xFC0FF00FC0FF];start /NODE [1,3] /AFFINITY [0xFF03F00FF03F] |
| JVM Instances: | 4 |
| JVM Initial Heap (MB): | 21000 |
| JVM Maximum Heap (MB): | 21000 |
| JVM Address Bits: | 64 |
| Boot Firmware Version: | 2.00.25 |
| Management Firmware Version: | UIS-OM 1.00.10 |
| Workload Version: | SSJ 1.2.10 |
| Director Location: | Controller |
| Other Software: | Microsoft Windows KB3021910, clearcompressionflag.exe, KB2919355, KB2932046, KB2959977, KB2937592, KB2938439, KB2934018, KB4056898, patched to this test system in May 16, 2019 |
| JVM Instance | ssj_ops@100% |
|---|---|
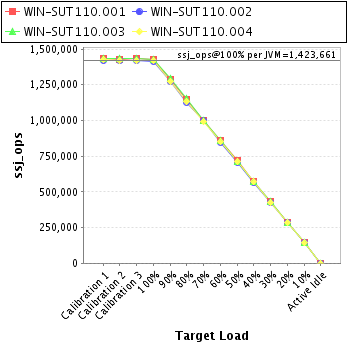
| WIN-SUT110.001 | 1,429,722 |
| WIN-SUT110.002 | 1,415,849 |
| WIN-SUT110.003 | 1,430,354 |
| WIN-SUT110.004 | 1,418,718 |
| ssj_ops@100% | 5,694,644 |
| ssj_ops@100% per JVM | 1,423,661 |
| Target Load | Actual Load | ssj_ops | |
|---|---|---|---|
| Target | Actual | ||
| Calibration 1 | 1,432,470 | ||
| Calibration 2 | 1,428,294 | ||
| Calibration 3 | 1,433,622 | ||
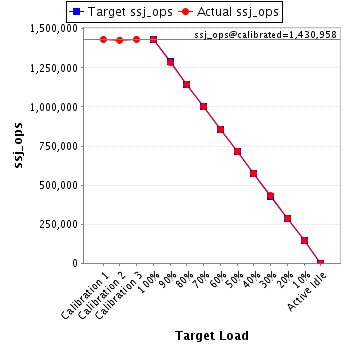
| ssj_ops@calibrated=1,430,958 | |||
| 100% | 99.9% | 1,430,958 | 1,429,722 |
| 90% | 89.8% | 1,287,862 | 1,285,222 |
| 80% | 80.1% | 1,144,767 | 1,146,559 |
| 70% | 70.0% | 1,001,671 | 1,001,307 |
| 60% | 59.9% | 858,575 | 857,694 |
| 50% | 50.1% | 715,479 | 716,518 |
| 40% | 39.9% | 572,383 | 571,587 |
| 30% | 30.1% | 429,287 | 430,593 |
| 20% | 20.1% | 286,192 | 288,252 |
| 10% | 10.0% | 143,096 | 143,783 |
| Active Idle | 0 | 0 | |
| Target Load | Actual Load | ssj_ops | |
|---|---|---|---|
| Target | Actual | ||
| Calibration 1 | 1,421,499 | ||
| Calibration 2 | 1,417,454 | ||
| Calibration 3 | 1,418,427 | ||
| ssj_ops@calibrated=1,417,940 | |||
| 100% | 99.9% | 1,417,940 | 1,415,849 |
| 90% | 89.7% | 1,276,146 | 1,271,905 |
| 80% | 79.6% | 1,134,352 | 1,128,952 |
| 70% | 70.3% | 992,558 | 996,961 |
| 60% | 59.9% | 850,764 | 849,195 |
| 50% | 49.9% | 708,970 | 707,335 |
| 40% | 39.9% | 567,176 | 565,897 |
| 30% | 30.0% | 425,382 | 425,228 |
| 20% | 20.0% | 283,588 | 284,140 |
| 10% | 10.0% | 141,794 | 142,441 |
| Active Idle | 0 | 0 | |

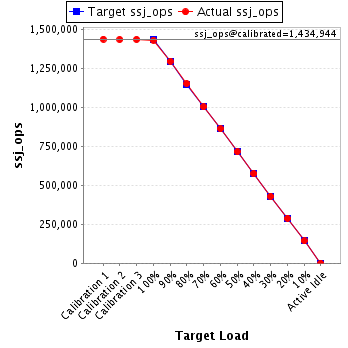
| Target Load | Actual Load | ssj_ops | |
|---|---|---|---|
| Target | Actual | ||
| Calibration 1 | 1,436,506 | ||
| Calibration 2 | 1,434,432 | ||
| Calibration 3 | 1,435,456 | ||
| ssj_ops@calibrated=1,434,944 | |||
| 100% | 99.7% | 1,434,944 | 1,430,354 |
| 90% | 90.2% | 1,291,449 | 1,294,800 |
| 80% | 80.3% | 1,147,955 | 1,152,467 |
| 70% | 69.9% | 1,004,461 | 1,002,744 |
| 60% | 60.1% | 860,966 | 861,778 |
| 50% | 49.8% | 717,472 | 714,917 |
| 40% | 40.0% | 573,978 | 573,789 |
| 30% | 29.9% | 430,483 | 429,321 |
| 20% | 20.1% | 286,989 | 288,172 |
| 10% | 10.0% | 143,494 | 143,269 |
| Active Idle | 0 | 0 | |
| Target Load | Actual Load | ssj_ops | |
|---|---|---|---|
| Target | Actual | ||
| Calibration 1 | 1,424,871 | ||
| Calibration 2 | 1,421,917 | ||
| Calibration 3 | 1,421,109 | ||
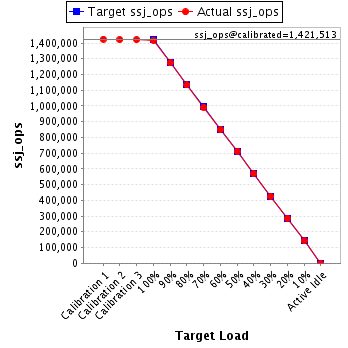
| ssj_ops@calibrated=1,421,513 | |||
| 100% | 99.8% | 1,421,513 | 1,418,718 |
| 90% | 89.6% | 1,279,362 | 1,273,984 |
| 80% | 79.7% | 1,137,210 | 1,133,468 |
| 70% | 69.9% | 995,059 | 993,063 |
| 60% | 59.8% | 852,908 | 849,409 |
| 50% | 50.2% | 710,757 | 713,129 |
| 40% | 40.1% | 568,605 | 569,459 |
| 30% | 30.0% | 426,454 | 425,772 |
| 20% | 20.1% | 284,303 | 285,418 |
| 10% | 10.0% | 142,151 | 142,560 |
| Active Idle | 0 | 0 | |