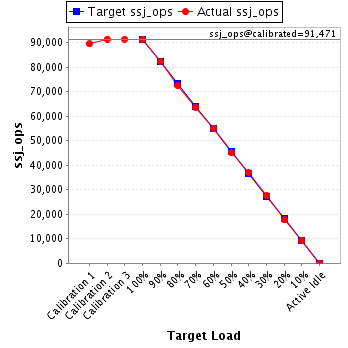
| Target Load |
Actual Load |
ssj_ops |
| Target |
Actual |
| Calibration 1 |
|
|
5,681,337 |
| Calibration 2 |
|
|
5,685,011 |
| Calibration 3 |
|
|
5,690,904 |
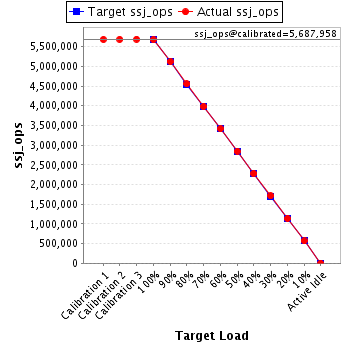
| ssj_ops@calibrated=5,687,958 |
| 100% |
99.8% |
5,687,958 |
5,676,534 |
| 90% |
90.0% |
5,119,162 |
5,119,824 |
| 80% |
80.1% |
4,550,366 |
4,554,430 |
| 70% |
70.1% |
3,981,570 |
3,985,711 |
| 60% |
60.0% |
3,412,775 |
3,411,318 |
| 50% |
50.0% |
2,843,979 |
2,846,520 |
| 40% |
40.0% |
2,275,183 |
2,276,939 |
| 30% |
30.0% |
1,706,387 |
1,708,951 |
| 20% |
20.0% |
1,137,592 |
1,135,409 |
| 10% |
10.0% |
568,796 |
566,487 |
| Active Idle |
|
0 |
0 |
| JVM Instance |
ssj_ops@100% |
| user-PowerEdge-R7515.001 |
89,942 |
| user-PowerEdge-R7515.002 |
89,596 |
| user-PowerEdge-R7515.003 |
90,041 |
| user-PowerEdge-R7515.004 |
87,763 |
| user-PowerEdge-R7515.005 |
89,399 |
| user-PowerEdge-R7515.006 |
90,670 |
| user-PowerEdge-R7515.007 |
89,849 |
| user-PowerEdge-R7515.008 |
89,054 |
| user-PowerEdge-R7515.009 |
89,862 |
| user-PowerEdge-R7515.010 |
88,081 |
| user-PowerEdge-R7515.011 |
88,511 |
| user-PowerEdge-R7515.012 |
88,033 |
| user-PowerEdge-R7515.013 |
90,076 |
| user-PowerEdge-R7515.014 |
87,535 |
| user-PowerEdge-R7515.015 |
89,027 |
| user-PowerEdge-R7515.016 |
89,154 |
| user-PowerEdge-R7515.017 |
89,045 |
| user-PowerEdge-R7515.018 |
88,941 |
| user-PowerEdge-R7515.019 |
91,269 |
| user-PowerEdge-R7515.020 |
88,647 |
| user-PowerEdge-R7515.021 |
89,147 |
| user-PowerEdge-R7515.022 |
88,766 |
| user-PowerEdge-R7515.023 |
89,086 |
| user-PowerEdge-R7515.024 |
86,213 |
| user-PowerEdge-R7515.025 |
87,902 |
| user-PowerEdge-R7515.026 |
87,853 |
| user-PowerEdge-R7515.027 |
89,131 |
| user-PowerEdge-R7515.028 |
91,996 |
| user-PowerEdge-R7515.029 |
90,735 |
| user-PowerEdge-R7515.030 |
89,018 |
| user-PowerEdge-R7515.031 |
87,235 |
| user-PowerEdge-R7515.032 |
87,915 |
| user-PowerEdge-R7515.033 |
87,928 |
| user-PowerEdge-R7515.034 |
86,318 |
| user-PowerEdge-R7515.035 |
90,691 |
| user-PowerEdge-R7515.036 |
86,194 |
| user-PowerEdge-R7515.037 |
89,839 |
| user-PowerEdge-R7515.038 |
89,628 |
| user-PowerEdge-R7515.039 |
88,835 |
| user-PowerEdge-R7515.040 |
90,683 |
| user-PowerEdge-R7515.041 |
87,210 |
| user-PowerEdge-R7515.042 |
88,600 |
| user-PowerEdge-R7515.043 |
86,118 |
| user-PowerEdge-R7515.044 |
88,909 |
| user-PowerEdge-R7515.045 |
83,950 |
| user-PowerEdge-R7515.046 |
88,259 |
| user-PowerEdge-R7515.047 |
88,233 |
| user-PowerEdge-R7515.048 |
87,258 |
| user-PowerEdge-R7515.049 |
87,237 |
| user-PowerEdge-R7515.050 |
89,871 |
| user-PowerEdge-R7515.051 |
91,322 |
| user-PowerEdge-R7515.052 |
90,045 |
| user-PowerEdge-R7515.053 |
88,541 |
| user-PowerEdge-R7515.054 |
87,411 |
| user-PowerEdge-R7515.055 |
89,397 |
| user-PowerEdge-R7515.056 |
87,817 |
| user-PowerEdge-R7515.057 |
86,631 |
| user-PowerEdge-R7515.058 |
90,291 |
| user-PowerEdge-R7515.059 |
88,418 |
| user-PowerEdge-R7515.060 |
86,980 |
| user-PowerEdge-R7515.061 |
87,632 |
| user-PowerEdge-R7515.062 |
89,974 |
| user-PowerEdge-R7515.063 |
87,150 |
| user-PowerEdge-R7515.064 |
89,673 |
| ssj_ops@100% |
5,676,534 |
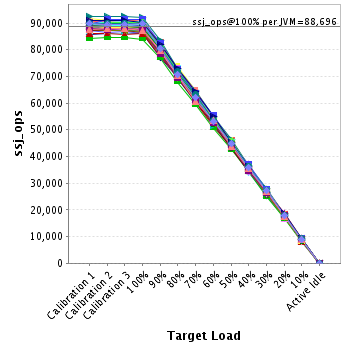
| ssj_ops@100% per JVM |
88,696 |
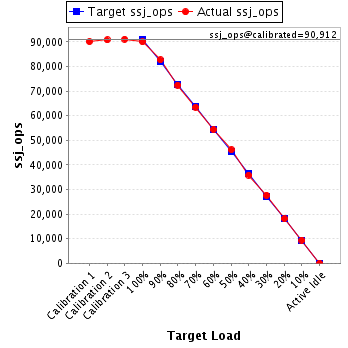
JVM 'user-PowerEdge-R7515.001' Scores:
| Target Load |
Actual Load |
ssj_ops |
| Target |
Actual |
| Calibration 1 |
|
|
90,070 |
| Calibration 2 |
|
|
90,746 |
| Calibration 3 |
|
|
91,077 |
| ssj_ops@calibrated=90,912 |
| 100% |
98.9% |
90,912 |
89,942 |
| 90% |
90.9% |
81,821 |
82,680 |
| 80% |
79.7% |
72,729 |
72,424 |
| 70% |
69.9% |
63,638 |
63,508 |
| 60% |
59.8% |
54,547 |
54,355 |
| 50% |
50.7% |
45,456 |
46,115 |
| 40% |
39.4% |
36,365 |
35,852 |
| 30% |
30.4% |
27,274 |
27,633 |
| 20% |
19.9% |
18,182 |
18,098 |
| 10% |
10.3% |
9,091 |
9,394 |
| Active Idle |
|
0 |
0 |
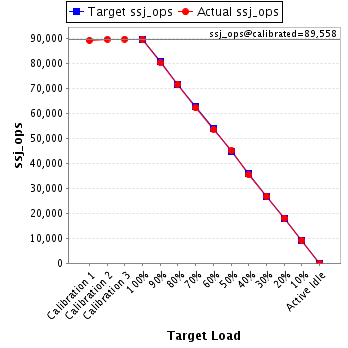
JVM 'user-PowerEdge-R7515.002' Scores:
| Target Load |
Actual Load |
ssj_ops |
| Target |
Actual |
| Calibration 1 |
|
|
89,097 |
| Calibration 2 |
|
|
89,525 |
| Calibration 3 |
|
|
89,590 |
| ssj_ops@calibrated=89,558 |
| 100% |
100.0% |
89,558 |
89,596 |
| 90% |
89.5% |
80,602 |
80,169 |
| 80% |
80.0% |
71,646 |
71,607 |
| 70% |
69.4% |
62,690 |
62,147 |
| 60% |
59.8% |
53,735 |
53,534 |
| 50% |
50.2% |
44,779 |
44,999 |
| 40% |
39.5% |
35,823 |
35,347 |
| 30% |
30.0% |
26,867 |
26,874 |
| 20% |
20.1% |
17,912 |
18,042 |
| 10% |
10.1% |
8,956 |
9,037 |
| Active Idle |
|
0 |
0 |
JVM 'user-PowerEdge-R7515.003' Scores:
| Target Load |
Actual Load |
ssj_ops |
| Target |
Actual |
| Calibration 1 |
|
|
90,108 |
| Calibration 2 |
|
|
90,322 |
| Calibration 3 |
|
|
90,217 |
| ssj_ops@calibrated=90,270 |
| 100% |
99.7% |
90,270 |
90,041 |
| 90% |
89.8% |
81,243 |
81,105 |
| 80% |
79.0% |
72,216 |
71,356 |
| 70% |
69.6% |
63,189 |
62,845 |
| 60% |
60.2% |
54,162 |
54,367 |
| 50% |
50.2% |
45,135 |
45,289 |
| 40% |
39.5% |
36,108 |
35,637 |
| 30% |
30.5% |
27,081 |
27,562 |
| 20% |
19.6% |
18,054 |
17,683 |
| 10% |
9.9% |
9,027 |
8,962 |
| Active Idle |
|
0 |
0 |
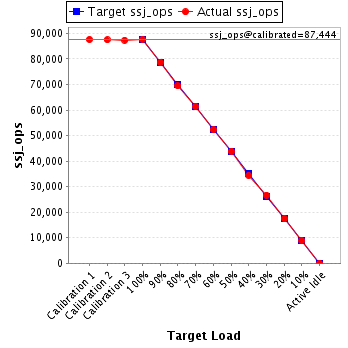
JVM 'user-PowerEdge-R7515.004' Scores:
| Target Load |
Actual Load |
ssj_ops |
| Target |
Actual |
| Calibration 1 |
|
|
87,621 |
| Calibration 2 |
|
|
87,501 |
| Calibration 3 |
|
|
87,388 |
| ssj_ops@calibrated=87,444 |
| 100% |
100.4% |
87,444 |
87,763 |
| 90% |
90.1% |
78,700 |
78,790 |
| 80% |
79.5% |
69,955 |
69,490 |
| 70% |
70.3% |
61,211 |
61,445 |
| 60% |
59.8% |
52,467 |
52,281 |
| 50% |
50.2% |
43,722 |
43,924 |
| 40% |
39.4% |
34,978 |
34,414 |
| 30% |
30.6% |
26,233 |
26,720 |
| 20% |
19.9% |
17,489 |
17,436 |
| 10% |
10.1% |
8,744 |
8,850 |
| Active Idle |
|
0 |
0 |
JVM 'user-PowerEdge-R7515.005' Scores:
| Target Load |
Actual Load |
ssj_ops |
| Target |
Actual |
| Calibration 1 |
|
|
90,376 |
| Calibration 2 |
|
|
90,039 |
| Calibration 3 |
|
|
90,360 |
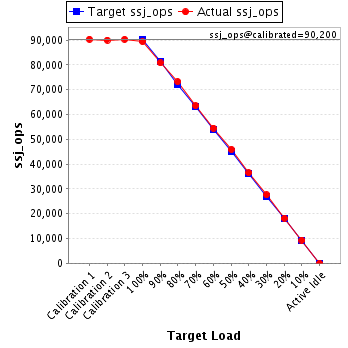
| ssj_ops@calibrated=90,200 |
| 100% |
99.1% |
90,200 |
89,399 |
| 90% |
89.6% |
81,180 |
80,838 |
| 80% |
81.1% |
72,160 |
73,181 |
| 70% |
70.4% |
63,140 |
63,528 |
| 60% |
60.5% |
54,120 |
54,536 |
| 50% |
50.9% |
45,100 |
45,945 |
| 40% |
40.4% |
36,080 |
36,429 |
| 30% |
30.6% |
27,060 |
27,587 |
| 20% |
20.2% |
18,040 |
18,180 |
| 10% |
10.4% |
9,020 |
9,354 |
| Active Idle |
|
0 |
0 |
JVM 'user-PowerEdge-R7515.006' Scores:
| Target Load |
Actual Load |
ssj_ops |
| Target |
Actual |
| Calibration 1 |
|
|
90,281 |
| Calibration 2 |
|
|
90,424 |
| Calibration 3 |
|
|
90,795 |
| ssj_ops@calibrated=90,610 |
| 100% |
100.1% |
90,610 |
90,670 |
| 90% |
89.6% |
81,549 |
81,205 |
| 80% |
80.5% |
72,488 |
72,898 |
| 70% |
68.9% |
63,427 |
62,475 |
| 60% |
59.7% |
54,366 |
54,081 |
| 50% |
49.4% |
45,305 |
44,749 |
| 40% |
40.3% |
36,244 |
36,506 |
| 30% |
29.6% |
27,183 |
26,825 |
| 20% |
19.7% |
18,122 |
17,831 |
| 10% |
10.1% |
9,061 |
9,166 |
| Active Idle |
|
0 |
0 |
JVM 'user-PowerEdge-R7515.007' Scores:
| Target Load |
Actual Load |
ssj_ops |
| Target |
Actual |
| Calibration 1 |
|
|
89,449 |
| Calibration 2 |
|
|
89,559 |
| Calibration 3 |
|
|
89,859 |
| ssj_ops@calibrated=89,709 |
| 100% |
100.2% |
89,709 |
89,849 |
| 90% |
89.2% |
80,738 |
79,984 |
| 80% |
80.4% |
71,767 |
72,143 |
| 70% |
69.5% |
62,796 |
62,344 |
| 60% |
58.6% |
53,825 |
52,549 |
| 50% |
49.6% |
44,855 |
44,455 |
| 40% |
39.9% |
35,884 |
35,837 |
| 30% |
30.0% |
26,913 |
26,892 |
| 20% |
19.5% |
17,942 |
17,503 |
| 10% |
10.1% |
8,971 |
9,071 |
| Active Idle |
|
0 |
0 |
JVM 'user-PowerEdge-R7515.008' Scores:
| Target Load |
Actual Load |
ssj_ops |
| Target |
Actual |
| Calibration 1 |
|
|
89,274 |
| Calibration 2 |
|
|
89,148 |
| Calibration 3 |
|
|
89,114 |
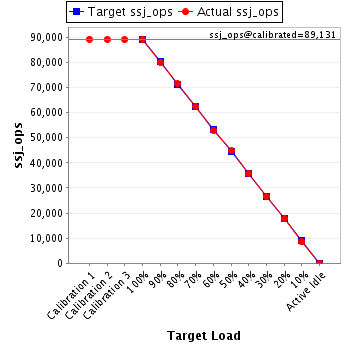
| ssj_ops@calibrated=89,131 |
| 100% |
99.9% |
89,131 |
89,054 |
| 90% |
89.9% |
80,218 |
80,103 |
| 80% |
80.3% |
71,305 |
71,532 |
| 70% |
70.0% |
62,392 |
62,380 |
| 60% |
59.5% |
53,479 |
53,001 |
| 50% |
50.2% |
44,566 |
44,780 |
| 40% |
40.2% |
35,652 |
35,812 |
| 30% |
29.7% |
26,739 |
26,496 |
| 20% |
19.8% |
17,826 |
17,637 |
| 10% |
9.5% |
8,913 |
8,479 |
| Active Idle |
|
0 |
0 |
JVM 'user-PowerEdge-R7515.009' Scores:
| Target Load |
Actual Load |
ssj_ops |
| Target |
Actual |
| Calibration 1 |
|
|
89,371 |
| Calibration 2 |
|
|
89,469 |
| Calibration 3 |
|
|
89,388 |
| ssj_ops@calibrated=89,429 |
| 100% |
100.5% |
89,429 |
89,862 |
| 90% |
90.7% |
80,486 |
81,117 |
| 80% |
80.9% |
71,543 |
72,366 |
| 70% |
70.3% |
62,600 |
62,886 |
| 60% |
60.0% |
53,657 |
53,694 |
| 50% |
51.2% |
44,714 |
45,798 |
| 40% |
39.5% |
35,771 |
35,325 |
| 30% |
29.8% |
26,829 |
26,667 |
| 20% |
20.4% |
17,886 |
18,275 |
| 10% |
10.2% |
8,943 |
9,087 |
| Active Idle |
|
0 |
0 |
JVM 'user-PowerEdge-R7515.010' Scores:
| Target Load |
Actual Load |
ssj_ops |
| Target |
Actual |
| Calibration 1 |
|
|
89,787 |
| Calibration 2 |
|
|
88,920 |
| Calibration 3 |
|
|
88,827 |
| ssj_ops@calibrated=88,873 |
| 100% |
99.1% |
88,873 |
88,081 |
| 90% |
89.9% |
79,986 |
79,935 |
| 80% |
81.1% |
71,099 |
72,092 |
| 70% |
70.3% |
62,211 |
62,516 |
| 60% |
60.1% |
53,324 |
53,449 |
| 50% |
50.6% |
44,437 |
44,945 |
| 40% |
40.5% |
35,549 |
36,036 |
| 30% |
29.8% |
26,662 |
26,477 |
| 20% |
19.6% |
17,775 |
17,397 |
| 10% |
9.8% |
8,887 |
8,750 |
| Active Idle |
|
0 |
0 |
JVM 'user-PowerEdge-R7515.011' Scores:
| Target Load |
Actual Load |
ssj_ops |
| Target |
Actual |
| Calibration 1 |
|
|
89,194 |
| Calibration 2 |
|
|
89,410 |
| Calibration 3 |
|
|
89,493 |
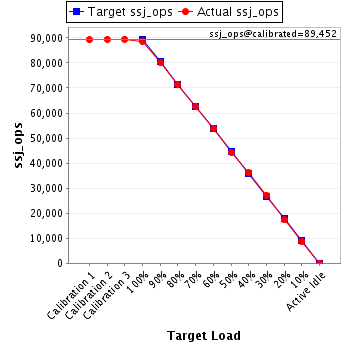
| ssj_ops@calibrated=89,452 |
| 100% |
98.9% |
89,452 |
88,511 |
| 90% |
89.6% |
80,506 |
80,128 |
| 80% |
79.7% |
71,561 |
71,301 |
| 70% |
69.8% |
62,616 |
62,439 |
| 60% |
60.1% |
53,671 |
53,786 |
| 50% |
49.5% |
44,726 |
44,308 |
| 40% |
40.3% |
35,781 |
36,083 |
| 30% |
30.4% |
26,835 |
27,160 |
| 20% |
19.3% |
17,890 |
17,300 |
| 10% |
9.9% |
8,945 |
8,833 |
| Active Idle |
|
0 |
0 |
JVM 'user-PowerEdge-R7515.012' Scores:
| Target Load |
Actual Load |
ssj_ops |
| Target |
Actual |
| Calibration 1 |
|
|
88,358 |
| Calibration 2 |
|
|
87,860 |
| Calibration 3 |
|
|
87,739 |
| ssj_ops@calibrated=87,800 |
| 100% |
100.3% |
87,800 |
88,033 |
| 90% |
91.4% |
79,020 |
80,243 |
| 80% |
80.1% |
70,240 |
70,371 |
| 70% |
69.1% |
61,460 |
60,703 |
| 60% |
59.6% |
52,680 |
52,327 |
| 50% |
49.8% |
43,900 |
43,753 |
| 40% |
39.3% |
35,120 |
34,515 |
| 30% |
29.4% |
26,340 |
25,775 |
| 20% |
20.5% |
17,560 |
18,028 |
| 10% |
9.9% |
8,780 |
8,679 |
| Active Idle |
|
0 |
0 |
JVM 'user-PowerEdge-R7515.013' Scores:
| Target Load |
Actual Load |
ssj_ops |
| Target |
Actual |
| Calibration 1 |
|
|
90,276 |
| Calibration 2 |
|
|
89,929 |
| Calibration 3 |
|
|
89,976 |
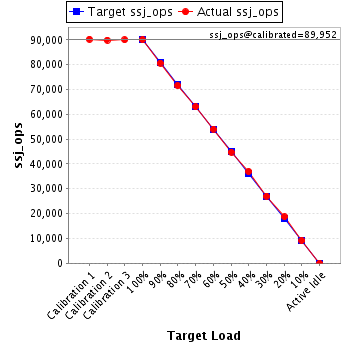
| ssj_ops@calibrated=89,952 |
| 100% |
100.1% |
89,952 |
90,076 |
| 90% |
89.7% |
80,957 |
80,661 |
| 80% |
79.6% |
71,962 |
71,607 |
| 70% |
70.1% |
62,967 |
63,062 |
| 60% |
60.1% |
53,971 |
54,071 |
| 50% |
49.8% |
44,976 |
44,787 |
| 40% |
41.1% |
35,981 |
36,991 |
| 30% |
30.1% |
26,986 |
27,091 |
| 20% |
20.8% |
17,990 |
18,733 |
| 10% |
10.2% |
8,995 |
9,179 |
| Active Idle |
|
0 |
0 |
JVM 'user-PowerEdge-R7515.014' Scores:
| Target Load |
Actual Load |
ssj_ops |
| Target |
Actual |
| Calibration 1 |
|
|
88,259 |
| Calibration 2 |
|
|
87,661 |
| Calibration 3 |
|
|
87,694 |
| ssj_ops@calibrated=87,678 |
| 100% |
99.8% |
87,678 |
87,535 |
| 90% |
91.3% |
78,910 |
80,052 |
| 80% |
79.9% |
70,142 |
70,067 |
| 70% |
70.9% |
61,374 |
62,180 |
| 60% |
60.6% |
52,607 |
53,146 |
| 50% |
49.5% |
43,839 |
43,403 |
| 40% |
40.1% |
35,071 |
35,178 |
| 30% |
29.5% |
26,303 |
25,885 |
| 20% |
20.2% |
17,536 |
17,753 |
| 10% |
9.9% |
8,768 |
8,696 |
| Active Idle |
|
0 |
0 |
JVM 'user-PowerEdge-R7515.015' Scores:
| Target Load |
Actual Load |
ssj_ops |
| Target |
Actual |
| Calibration 1 |
|
|
88,879 |
| Calibration 2 |
|
|
88,824 |
| Calibration 3 |
|
|
88,948 |
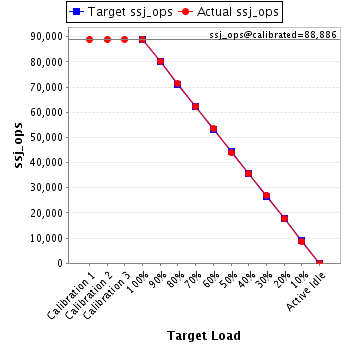
| ssj_ops@calibrated=88,886 |
| 100% |
100.2% |
88,886 |
89,027 |
| 90% |
90.3% |
79,997 |
80,290 |
| 80% |
80.3% |
71,109 |
71,383 |
| 70% |
70.1% |
62,220 |
62,351 |
| 60% |
60.1% |
53,332 |
53,408 |
| 50% |
49.3% |
44,443 |
43,843 |
| 40% |
40.0% |
35,554 |
35,583 |
| 30% |
30.5% |
26,666 |
27,096 |
| 20% |
19.8% |
17,777 |
17,642 |
| 10% |
9.8% |
8,889 |
8,679 |
| Active Idle |
|
0 |
0 |
JVM 'user-PowerEdge-R7515.016' Scores:
| Target Load |
Actual Load |
ssj_ops |
| Target |
Actual |
| Calibration 1 |
|
|
89,244 |
| Calibration 2 |
|
|
89,406 |
| Calibration 3 |
|
|
89,441 |
| ssj_ops@calibrated=89,423 |
| 100% |
99.7% |
89,423 |
89,154 |
| 90% |
90.6% |
80,481 |
81,009 |
| 80% |
80.0% |
71,539 |
71,495 |
| 70% |
69.9% |
62,596 |
62,515 |
| 60% |
60.0% |
53,654 |
53,633 |
| 50% |
49.8% |
44,712 |
44,512 |
| 40% |
39.9% |
35,769 |
35,649 |
| 30% |
30.3% |
26,827 |
27,071 |
| 20% |
19.5% |
17,885 |
17,466 |
| 10% |
9.8% |
8,942 |
8,794 |
| Active Idle |
|
0 |
0 |
JVM 'user-PowerEdge-R7515.017' Scores:
| Target Load |
Actual Load |
ssj_ops |
| Target |
Actual |
| Calibration 1 |
|
|
88,961 |
| Calibration 2 |
|
|
89,034 |
| Calibration 3 |
|
|
89,301 |
| ssj_ops@calibrated=89,167 |
| 100% |
99.9% |
89,167 |
89,045 |
| 90% |
90.3% |
80,251 |
80,489 |
| 80% |
80.1% |
71,334 |
71,397 |
| 70% |
69.6% |
62,417 |
62,037 |
| 60% |
60.4% |
53,500 |
53,852 |
| 50% |
49.7% |
44,584 |
44,354 |
| 40% |
39.9% |
35,667 |
35,596 |
| 30% |
30.5% |
26,750 |
27,167 |
| 20% |
19.7% |
17,833 |
17,542 |
| 10% |
9.7% |
8,917 |
8,675 |
| Active Idle |
|
0 |
0 |
JVM 'user-PowerEdge-R7515.018' Scores:
| Target Load |
Actual Load |
ssj_ops |
| Target |
Actual |
| Calibration 1 |
|
|
86,713 |
| Calibration 2 |
|
|
88,612 |
| Calibration 3 |
|
|
88,742 |
| ssj_ops@calibrated=88,677 |
| 100% |
100.3% |
88,677 |
88,941 |
| 90% |
90.2% |
79,809 |
79,983 |
| 80% |
80.0% |
70,942 |
70,982 |
| 70% |
68.8% |
62,074 |
60,967 |
| 60% |
59.5% |
53,206 |
52,761 |
| 50% |
50.3% |
44,339 |
44,642 |
| 40% |
40.1% |
35,471 |
35,558 |
| 30% |
30.5% |
26,603 |
27,030 |
| 20% |
20.2% |
17,735 |
17,879 |
| 10% |
9.7% |
8,868 |
8,629 |
| Active Idle |
|
0 |
0 |
JVM 'user-PowerEdge-R7515.019' Scores:
| Target Load |
Actual Load |
ssj_ops |
| Target |
Actual |
| Calibration 1 |
|
|
91,841 |
| Calibration 2 |
|
|
91,055 |
| Calibration 3 |
|
|
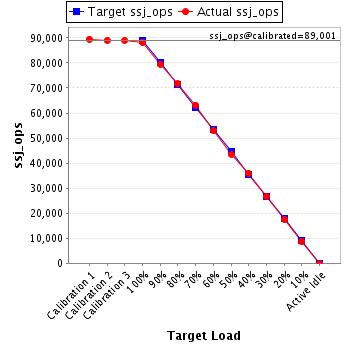
91,444 |
| ssj_ops@calibrated=91,249 |
| 100% |
100.0% |
91,249 |
91,269 |
| 90% |
88.9% |
82,124 |
81,162 |
| 80% |
81.0% |
72,999 |
73,881 |
| 70% |
70.8% |
63,874 |
64,565 |
| 60% |
59.6% |
54,750 |
54,389 |
| 50% |
50.5% |
45,625 |
46,071 |
| 40% |
40.1% |
36,500 |
36,629 |
| 30% |
30.2% |
27,375 |
27,596 |
| 20% |
20.1% |
18,250 |
18,320 |
| 10% |
10.1% |
9,125 |
9,179 |
| Active Idle |
|
0 |
0 |
JVM 'user-PowerEdge-R7515.020' Scores:
| Target Load |
Actual Load |
ssj_ops |
| Target |
Actual |
| Calibration 1 |
|
|
89,093 |
| Calibration 2 |
|
|
88,846 |
| Calibration 3 |
|
|
88,722 |
| ssj_ops@calibrated=88,784 |
| 100% |
99.8% |
88,784 |
88,647 |
| 90% |
90.4% |
79,905 |
80,243 |
| 80% |
79.3% |
71,027 |
70,438 |
| 70% |
70.6% |
62,149 |
62,677 |
| 60% |
59.8% |
53,270 |
53,105 |
| 50% |
49.7% |
44,392 |
44,143 |
| 40% |
39.7% |
35,514 |
35,264 |
| 30% |
29.8% |
26,635 |
26,459 |
| 20% |
20.1% |
17,757 |
17,842 |
| 10% |
9.8% |
8,878 |
8,721 |
| Active Idle |
|
0 |
0 |
JVM 'user-PowerEdge-R7515.021' Scores:
| Target Load |
Actual Load |
ssj_ops |
| Target |
Actual |
| Calibration 1 |
|
|
89,961 |
| Calibration 2 |
|
|
89,624 |
| Calibration 3 |
|
|
89,703 |
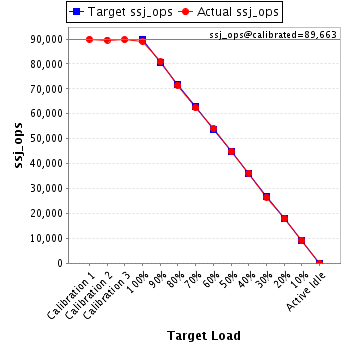
| ssj_ops@calibrated=89,663 |
| 100% |
99.4% |
89,663 |
89,147 |
| 90% |
90.2% |
80,697 |
80,849 |
| 80% |
79.7% |
71,731 |
71,498 |
| 70% |
69.6% |
62,764 |
62,425 |
| 60% |
60.4% |
53,798 |
54,113 |
| 50% |
50.1% |
44,832 |
44,922 |
| 40% |
40.4% |
35,865 |
36,230 |
| 30% |
29.7% |
26,899 |
26,596 |
| 20% |
19.9% |
17,933 |
17,800 |
| 10% |
10.2% |
8,966 |
9,171 |
| Active Idle |
|
0 |
0 |
JVM 'user-PowerEdge-R7515.022' Scores:
| Target Load |
Actual Load |
ssj_ops |
| Target |
Actual |
| Calibration 1 |
|
|
87,841 |
| Calibration 2 |
|
|
88,018 |
| Calibration 3 |
|
|
88,705 |
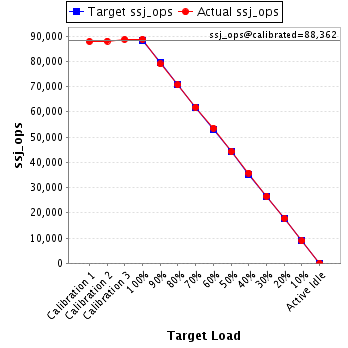
| ssj_ops@calibrated=88,362 |
| 100% |
100.5% |
88,362 |
88,766 |
| 90% |
89.3% |
79,525 |
78,943 |
| 80% |
79.9% |
70,689 |
70,641 |
| 70% |
70.0% |
61,853 |
61,824 |
| 60% |
60.6% |
53,017 |
53,521 |
| 50% |
50.0% |
44,181 |
44,217 |
| 40% |
40.5% |
35,345 |
35,746 |
| 30% |
30.1% |
26,508 |
26,583 |
| 20% |
20.2% |
17,672 |
17,825 |
| 10% |
10.1% |
8,836 |
8,889 |
| Active Idle |
|
0 |
0 |
JVM 'user-PowerEdge-R7515.023' Scores:
| Target Load |
Actual Load |
ssj_ops |
| Target |
Actual |
| Calibration 1 |
|
|
88,961 |
| Calibration 2 |
|
|
89,045 |
| Calibration 3 |
|
|
88,963 |
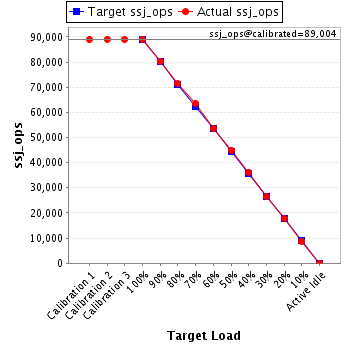
| ssj_ops@calibrated=89,004 |
| 100% |
100.1% |
89,004 |
89,086 |
| 90% |
90.3% |
80,104 |
80,374 |
| 80% |
80.1% |
71,203 |
71,314 |
| 70% |
71.5% |
62,303 |
63,600 |
| 60% |
60.1% |
53,403 |
53,514 |
| 50% |
50.5% |
44,502 |
44,937 |
| 40% |
40.7% |
35,602 |
36,182 |
| 30% |
29.8% |
26,701 |
26,521 |
| 20% |
20.0% |
17,801 |
17,837 |
| 10% |
9.7% |
8,900 |
8,653 |
| Active Idle |
|
0 |
0 |
JVM 'user-PowerEdge-R7515.024' Scores:
| Target Load |
Actual Load |
ssj_ops |
| Target |
Actual |
| Calibration 1 |
|
|
85,852 |
| Calibration 2 |
|
|
86,210 |
| Calibration 3 |
|
|
85,976 |
| ssj_ops@calibrated=86,093 |
| 100% |
100.1% |
86,093 |
86,213 |
| 90% |
89.6% |
77,484 |
77,155 |
| 80% |
80.9% |
68,875 |
69,627 |
| 70% |
70.0% |
60,265 |
60,279 |
| 60% |
60.4% |
51,656 |
51,962 |
| 50% |
50.5% |
43,047 |
43,445 |
| 40% |
39.9% |
34,437 |
34,327 |
| 30% |
29.8% |
25,828 |
25,677 |
| 20% |
19.9% |
17,219 |
17,166 |
| 10% |
9.9% |
8,609 |
8,532 |
| Active Idle |
|
0 |
0 |
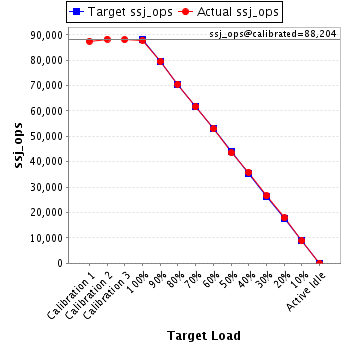
JVM 'user-PowerEdge-R7515.025' Scores:
| Target Load |
Actual Load |
ssj_ops |
| Target |
Actual |
| Calibration 1 |
|
|
87,519 |
| Calibration 2 |
|
|
88,293 |
| Calibration 3 |
|
|
88,116 |
| ssj_ops@calibrated=88,204 |
| 100% |
99.7% |
88,204 |
87,902 |
| 90% |
90.1% |
79,384 |
79,511 |
| 80% |
80.0% |
70,563 |
70,521 |
| 70% |
70.0% |
61,743 |
61,732 |
| 60% |
60.0% |
52,923 |
52,961 |
| 50% |
49.3% |
44,102 |
43,514 |
| 40% |
40.6% |
35,282 |
35,804 |
| 30% |
30.1% |
26,461 |
26,529 |
| 20% |
20.2% |
17,641 |
17,858 |
| 10% |
10.0% |
8,820 |
8,816 |
| Active Idle |
|
0 |
0 |
JVM 'user-PowerEdge-R7515.026' Scores:
| Target Load |
Actual Load |
ssj_ops |
| Target |
Actual |
| Calibration 1 |
|
|
87,859 |
| Calibration 2 |
|
|
87,711 |
| Calibration 3 |
|
|
87,733 |
| ssj_ops@calibrated=87,722 |
| 100% |
100.1% |
87,722 |
87,853 |
| 90% |
89.6% |
78,950 |
78,617 |
| 80% |
80.2% |
70,178 |
70,313 |
| 70% |
70.2% |
61,405 |
61,539 |
| 60% |
59.8% |
52,633 |
52,458 |
| 50% |
50.4% |
43,861 |
44,203 |
| 40% |
39.8% |
35,089 |
34,951 |
| 30% |
30.3% |
26,317 |
26,559 |
| 20% |
20.0% |
17,544 |
17,505 |
| 10% |
10.2% |
8,772 |
8,929 |
| Active Idle |
|
0 |
0 |
JVM 'user-PowerEdge-R7515.027' Scores:
| Target Load |
Actual Load |
ssj_ops |
| Target |
Actual |
| Calibration 1 |
|
|
89,673 |
| Calibration 2 |
|
|
89,475 |
| Calibration 3 |
|
|
89,854 |
| ssj_ops@calibrated=89,664 |
| 100% |
99.4% |
89,664 |
89,131 |
| 90% |
88.6% |
80,698 |
79,420 |
| 80% |
79.9% |
71,731 |
71,615 |
| 70% |
70.9% |
62,765 |
63,570 |
| 60% |
60.2% |
53,799 |
53,983 |
| 50% |
50.2% |
44,832 |
45,035 |
| 40% |
40.6% |
35,866 |
36,372 |
| 30% |
29.2% |
26,899 |
26,204 |
| 20% |
19.6% |
17,933 |
17,562 |
| 10% |
9.9% |
8,966 |
8,917 |
| Active Idle |
|
0 |
0 |
JVM 'user-PowerEdge-R7515.028' Scores:
| Target Load |
Actual Load |
ssj_ops |
| Target |
Actual |
| Calibration 1 |
|
|
92,404 |
| Calibration 2 |
|
|
92,365 |
| Calibration 3 |
|
|
92,514 |
| ssj_ops@calibrated=92,439 |
| 100% |
99.5% |
92,439 |
91,996 |
| 90% |
90.5% |
83,195 |
83,632 |
| 80% |
79.1% |
73,952 |
73,158 |
| 70% |
70.1% |
64,708 |
64,769 |
| 60% |
59.3% |
55,464 |
54,813 |
| 50% |
50.2% |
46,220 |
46,358 |
| 40% |
39.5% |
36,976 |
36,531 |
| 30% |
30.1% |
27,732 |
27,859 |
| 20% |
19.9% |
18,488 |
18,388 |
| 10% |
9.6% |
9,244 |
8,850 |
| Active Idle |
|
0 |
0 |
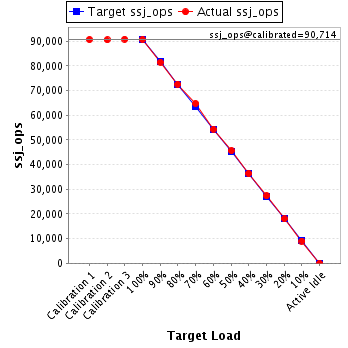
JVM 'user-PowerEdge-R7515.029' Scores:
| Target Load |
Actual Load |
ssj_ops |
| Target |
Actual |
| Calibration 1 |
|
|
90,679 |
| Calibration 2 |
|
|
90,577 |
| Calibration 3 |
|
|
90,851 |
| ssj_ops@calibrated=90,714 |
| 100% |
100.0% |
90,714 |
90,735 |
| 90% |
89.9% |
81,642 |
81,512 |
| 80% |
80.0% |
72,571 |
72,563 |
| 70% |
71.4% |
63,500 |
64,783 |
| 60% |
60.0% |
54,428 |
54,384 |
| 50% |
50.3% |
45,357 |
45,673 |
| 40% |
40.1% |
36,286 |
36,401 |
| 30% |
30.1% |
27,214 |
27,303 |
| 20% |
19.8% |
18,143 |
17,990 |
| 10% |
9.9% |
9,071 |
9,025 |
| Active Idle |
|
0 |
0 |
JVM 'user-PowerEdge-R7515.030' Scores:
| Target Load |
Actual Load |
ssj_ops |
| Target |
Actual |
| Calibration 1 |
|
|
89,014 |
| Calibration 2 |
|
|
88,979 |
| Calibration 3 |
|
|
89,146 |
| ssj_ops@calibrated=89,062 |
| 100% |
99.9% |
89,062 |
89,018 |
| 90% |
90.2% |
80,156 |
80,332 |
| 80% |
80.9% |
71,250 |
72,055 |
| 70% |
71.1% |
62,344 |
63,334 |
| 60% |
60.1% |
53,437 |
53,551 |
| 50% |
50.5% |
44,531 |
44,938 |
| 40% |
40.9% |
35,625 |
36,426 |
| 30% |
30.8% |
26,719 |
27,400 |
| 20% |
19.9% |
17,812 |
17,767 |
| 10% |
9.8% |
8,906 |
8,737 |
| Active Idle |
|
0 |
0 |
JVM 'user-PowerEdge-R7515.031' Scores:
| Target Load |
Actual Load |
ssj_ops |
| Target |
Actual |
| Calibration 1 |
|
|
87,109 |
| Calibration 2 |
|
|
87,778 |
| Calibration 3 |
|
|
88,341 |
| ssj_ops@calibrated=88,059 |
| 100% |
99.1% |
88,059 |
87,235 |
| 90% |
90.1% |
79,253 |
79,378 |
| 80% |
79.9% |
70,447 |
70,348 |
| 70% |
71.3% |
61,642 |
62,760 |
| 60% |
59.9% |
52,836 |
52,750 |
| 50% |
48.9% |
44,030 |
43,095 |
| 40% |
40.5% |
35,224 |
35,646 |
| 30% |
29.7% |
26,418 |
26,167 |
| 20% |
20.0% |
17,612 |
17,646 |
| 10% |
10.5% |
8,806 |
9,287 |
| Active Idle |
|
0 |
0 |
JVM 'user-PowerEdge-R7515.032' Scores:
| Target Load |
Actual Load |
ssj_ops |
| Target |
Actual |
| Calibration 1 |
|
|
87,779 |
| Calibration 2 |
|
|
88,021 |
| Calibration 3 |
|
|
88,481 |
| ssj_ops@calibrated=88,251 |
| 100% |
99.6% |
88,251 |
87,915 |
| 90% |
89.6% |
79,426 |
79,068 |
| 80% |
79.1% |
70,601 |
69,849 |
| 70% |
70.0% |
61,776 |
61,765 |
| 60% |
60.3% |
52,950 |
53,249 |
| 50% |
50.8% |
44,125 |
44,831 |
| 40% |
39.7% |
35,300 |
35,075 |
| 30% |
29.6% |
26,475 |
26,150 |
| 20% |
19.9% |
17,650 |
17,558 |
| 10% |
9.7% |
8,825 |
8,597 |
| Active Idle |
|
0 |
0 |
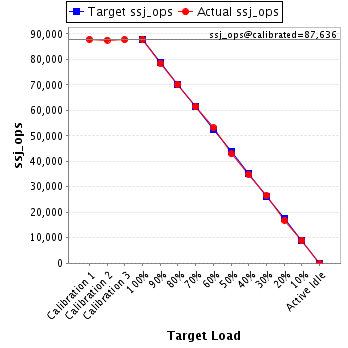
JVM 'user-PowerEdge-R7515.033' Scores:
| Target Load |
Actual Load |
ssj_ops |
| Target |
Actual |
| Calibration 1 |
|
|
87,883 |
| Calibration 2 |
|
|
87,589 |
| Calibration 3 |
|
|
87,683 |
| ssj_ops@calibrated=87,636 |
| 100% |
100.3% |
87,636 |
87,928 |
| 90% |
89.6% |
78,872 |
78,519 |
| 80% |
80.0% |
70,109 |
70,098 |
| 70% |
70.0% |
61,345 |
61,375 |
| 60% |
60.6% |
52,582 |
53,139 |
| 50% |
49.0% |
43,818 |
42,916 |
| 40% |
39.9% |
35,054 |
34,996 |
| 30% |
30.2% |
26,291 |
26,492 |
| 20% |
19.3% |
17,527 |
16,912 |
| 10% |
10.1% |
8,764 |
8,871 |
| Active Idle |
|
0 |
0 |
JVM 'user-PowerEdge-R7515.034' Scores:
| Target Load |
Actual Load |
ssj_ops |
| Target |
Actual |
| Calibration 1 |
|
|
86,034 |
| Calibration 2 |
|
|
86,111 |
| Calibration 3 |
|
|
86,135 |
| ssj_ops@calibrated=86,123 |
| 100% |
100.2% |
86,123 |
86,318 |
| 90% |
90.8% |
77,510 |
78,215 |
| 80% |
80.3% |
68,898 |
69,175 |
| 70% |
69.3% |
60,286 |
59,715 |
| 60% |
59.5% |
51,674 |
51,259 |
| 50% |
50.4% |
43,061 |
43,375 |
| 40% |
39.5% |
34,449 |
34,035 |
| 30% |
29.5% |
25,837 |
25,387 |
| 20% |
20.1% |
17,225 |
17,305 |
| 10% |
10.1% |
8,612 |
8,725 |
| Active Idle |
|
0 |
0 |
JVM 'user-PowerEdge-R7515.035' Scores:
| Target Load |
Actual Load |
ssj_ops |
| Target |
Actual |
| Calibration 1 |
|
|
90,372 |
| Calibration 2 |
|
|
91,204 |
| Calibration 3 |
|
|
91,222 |
| ssj_ops@calibrated=91,213 |
| 100% |
99.4% |
91,213 |
90,691 |
| 90% |
89.8% |
82,092 |
81,867 |
| 80% |
79.5% |
72,970 |
72,491 |
| 70% |
69.2% |
63,849 |
63,104 |
| 60% |
60.2% |
54,728 |
54,917 |
| 50% |
49.8% |
45,607 |
45,385 |
| 40% |
39.5% |
36,485 |
36,044 |
| 30% |
29.6% |
27,364 |
26,984 |
| 20% |
20.4% |
18,243 |
18,625 |
| 10% |
10.1% |
9,121 |
9,212 |
| Active Idle |
|
0 |
0 |
JVM 'user-PowerEdge-R7515.036' Scores:
| Target Load |
Actual Load |
ssj_ops |
| Target |
Actual |
| Calibration 1 |
|
|
87,196 |
| Calibration 2 |
|
|
86,644 |
| Calibration 3 |
|
|
86,734 |
| ssj_ops@calibrated=86,689 |
| 100% |
99.4% |
86,689 |
86,194 |
| 90% |
90.2% |
78,020 |
78,178 |
| 80% |
80.4% |
69,351 |
69,714 |
| 70% |
70.2% |
60,682 |
60,895 |
| 60% |
59.8% |
52,013 |
51,847 |
| 50% |
50.1% |
43,345 |
43,457 |
| 40% |
39.8% |
34,676 |
34,540 |
| 30% |
29.4% |
26,007 |
25,448 |
| 20% |
19.9% |
17,338 |
17,229 |
| 10% |
10.0% |
8,669 |
8,708 |
| Active Idle |
|
0 |
0 |
JVM 'user-PowerEdge-R7515.037' Scores:
| Target Load |
Actual Load |
ssj_ops |
| Target |
Actual |
| Calibration 1 |
|
|
89,427 |
| Calibration 2 |
|
|
89,713 |
| Calibration 3 |
|
|
89,992 |
| ssj_ops@calibrated=89,852 |
| 100% |
100.0% |
89,852 |
89,839 |
| 90% |
90.3% |
80,867 |
81,101 |
| 80% |
79.2% |
71,882 |
71,146 |
| 70% |
69.9% |
62,897 |
62,826 |
| 60% |
60.5% |
53,911 |
54,320 |
| 50% |
50.3% |
44,926 |
45,178 |
| 40% |
40.3% |
35,941 |
36,218 |
| 30% |
29.5% |
26,956 |
26,550 |
| 20% |
19.5% |
17,970 |
17,551 |
| 10% |
10.0% |
8,985 |
8,991 |
| Active Idle |
|
0 |
0 |
JVM 'user-PowerEdge-R7515.038' Scores:
| Target Load |
Actual Load |
ssj_ops |
| Target |
Actual |
| Calibration 1 |
|
|
90,049 |
| Calibration 2 |
|
|
89,693 |
| Calibration 3 |
|
|
89,844 |
| ssj_ops@calibrated=89,768 |
| 100% |
99.8% |
89,768 |
89,628 |
| 90% |
89.4% |
80,792 |
80,215 |
| 80% |
80.5% |
71,815 |
72,246 |
| 70% |
69.8% |
62,838 |
62,637 |
| 60% |
60.6% |
53,861 |
54,400 |
| 50% |
50.1% |
44,884 |
44,982 |
| 40% |
39.5% |
35,907 |
35,475 |
| 30% |
30.1% |
26,931 |
26,984 |
| 20% |
20.0% |
17,954 |
17,958 |
| 10% |
10.1% |
8,977 |
9,050 |
| Active Idle |
|
0 |
0 |
JVM 'user-PowerEdge-R7515.039' Scores:
| Target Load |
Actual Load |
ssj_ops |
| Target |
Actual |
| Calibration 1 |
|
|
89,446 |
| Calibration 2 |
|
|
89,549 |
| Calibration 3 |
|
|
89,897 |
| ssj_ops@calibrated=89,723 |
| 100% |
99.0% |
89,723 |
88,835 |
| 90% |
89.8% |
80,750 |
80,557 |
| 80% |
81.2% |
71,778 |
72,822 |
| 70% |
69.5% |
62,806 |
62,381 |
| 60% |
60.0% |
53,834 |
53,807 |
| 50% |
50.4% |
44,861 |
45,228 |
| 40% |
39.4% |
35,889 |
35,312 |
| 30% |
30.6% |
26,917 |
27,479 |
| 20% |
20.0% |
17,945 |
17,983 |
| 10% |
10.0% |
8,972 |
8,962 |
| Active Idle |
|
0 |
0 |
JVM 'user-PowerEdge-R7515.040' Scores:
| Target Load |
Actual Load |
ssj_ops |
| Target |
Actual |
| Calibration 1 |
|
|
90,175 |
| Calibration 2 |
|
|
90,384 |
| Calibration 3 |
|
|
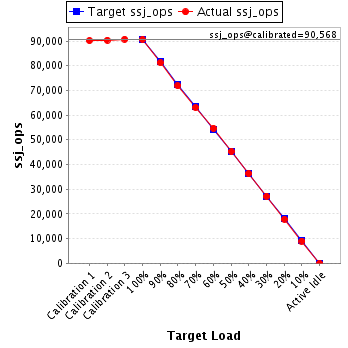
90,752 |
| ssj_ops@calibrated=90,568 |
| 100% |
100.1% |
90,568 |
90,683 |
| 90% |
89.7% |
81,511 |
81,207 |
| 80% |
79.4% |
72,455 |
71,898 |
| 70% |
69.7% |
63,398 |
63,097 |
| 60% |
60.3% |
54,341 |
54,653 |
| 50% |
50.0% |
45,284 |
45,269 |
| 40% |
40.1% |
36,227 |
36,315 |
| 30% |
30.0% |
27,170 |
27,179 |
| 20% |
19.7% |
18,114 |
17,861 |
| 10% |
9.9% |
9,057 |
8,992 |
| Active Idle |
|
0 |
0 |
JVM 'user-PowerEdge-R7515.041' Scores:
| Target Load |
Actual Load |
ssj_ops |
| Target |
Actual |
| Calibration 1 |
|
|
87,680 |
| Calibration 2 |
|
|
87,241 |
| Calibration 3 |
|
|
87,464 |
| ssj_ops@calibrated=87,353 |
| 100% |
99.8% |
87,353 |
87,210 |
| 90% |
91.0% |
78,617 |
79,484 |
| 80% |
80.4% |
69,882 |
70,202 |
| 70% |
68.9% |
61,147 |
60,187 |
| 60% |
59.4% |
52,412 |
51,873 |
| 50% |
49.7% |
43,676 |
43,449 |
| 40% |
39.9% |
34,941 |
34,825 |
| 30% |
30.3% |
26,206 |
26,459 |
| 20% |
20.1% |
17,471 |
17,531 |
| 10% |
10.0% |
8,735 |
8,764 |
| Active Idle |
|
0 |
0 |
JVM 'user-PowerEdge-R7515.042' Scores:
| Target Load |
Actual Load |
ssj_ops |
| Target |
Actual |
| Calibration 1 |
|
|
88,618 |
| Calibration 2 |
|
|
88,893 |
| Calibration 3 |
|
|
88,618 |
| ssj_ops@calibrated=88,756 |
| 100% |
99.8% |
88,756 |
88,600 |
| 90% |
89.8% |
79,880 |
79,696 |
| 80% |
79.7% |
71,004 |
70,764 |
| 70% |
69.5% |
62,129 |
61,694 |
| 60% |
60.3% |
53,253 |
53,536 |
| 50% |
49.5% |
44,378 |
43,947 |
| 40% |
40.6% |
35,502 |
36,012 |
| 30% |
30.3% |
26,627 |
26,924 |
| 20% |
20.0% |
17,751 |
17,716 |
| 10% |
9.8% |
8,876 |
8,722 |
| Active Idle |
|
0 |
0 |
JVM 'user-PowerEdge-R7515.043' Scores:
| Target Load |
Actual Load |
ssj_ops |
| Target |
Actual |
| Calibration 1 |
|
|
85,987 |
| Calibration 2 |
|
|
86,083 |
| Calibration 3 |
|
|
85,887 |
| ssj_ops@calibrated=85,985 |
| 100% |
100.2% |
85,985 |
86,118 |
| 90% |
90.1% |
77,386 |
77,445 |
| 80% |
81.2% |
68,788 |
69,842 |
| 70% |
69.9% |
60,189 |
60,123 |
| 60% |
59.8% |
51,591 |
51,414 |
| 50% |
50.3% |
42,992 |
43,284 |
| 40% |
40.2% |
34,394 |
34,604 |
| 30% |
29.9% |
25,795 |
25,712 |
| 20% |
20.2% |
17,197 |
17,350 |
| 10% |
9.7% |
8,598 |
8,325 |
| Active Idle |
|
0 |
0 |
JVM 'user-PowerEdge-R7515.044' Scores:
| Target Load |
Actual Load |
ssj_ops |
| Target |
Actual |
| Calibration 1 |
|
|
87,876 |
| Calibration 2 |
|
|
88,847 |
| Calibration 3 |
|
|
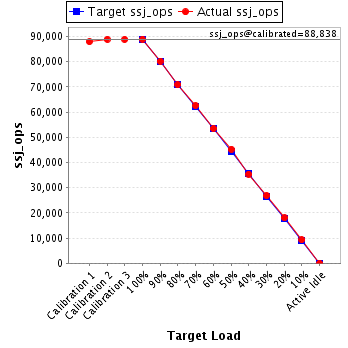
88,829 |
| ssj_ops@calibrated=88,838 |
| 100% |
100.1% |
88,838 |
88,909 |
| 90% |
90.3% |
79,954 |
80,199 |
| 80% |
79.7% |
71,070 |
70,818 |
| 70% |
70.4% |
62,186 |
62,555 |
| 60% |
60.2% |
53,303 |
53,458 |
| 50% |
50.9% |
44,419 |
45,240 |
| 40% |
39.9% |
35,535 |
35,411 |
| 30% |
30.2% |
26,651 |
26,842 |
| 20% |
20.3% |
17,768 |
17,992 |
| 10% |
10.5% |
8,884 |
9,325 |
| Active Idle |
|
0 |
0 |
JVM 'user-PowerEdge-R7515.045' Scores:
| Target Load |
Actual Load |
ssj_ops |
| Target |
Actual |
| Calibration 1 |
|
|
84,159 |
| Calibration 2 |
|
|
84,559 |
| Calibration 3 |
|
|
84,492 |
| ssj_ops@calibrated=84,525 |
| 100% |
99.3% |
84,525 |
83,950 |
| 90% |
90.8% |
76,073 |
76,732 |
| 80% |
80.3% |
67,620 |
67,888 |
| 70% |
70.2% |
59,168 |
59,351 |
| 60% |
59.9% |
50,715 |
50,653 |
| 50% |
50.4% |
42,263 |
42,562 |
| 40% |
40.5% |
33,810 |
34,212 |
| 30% |
29.4% |
25,358 |
24,871 |
| 20% |
19.8% |
16,905 |
16,754 |
| 10% |
9.8% |
8,453 |
8,325 |
| Active Idle |
|
0 |
0 |
JVM 'user-PowerEdge-R7515.046' Scores:
| Target Load |
Actual Load |
ssj_ops |
| Target |
Actual |
| Calibration 1 |
|
|
88,281 |
| Calibration 2 |
|
|
89,057 |
| Calibration 3 |
|
|
89,148 |
| ssj_ops@calibrated=89,102 |
| 100% |
99.1% |
89,102 |
88,259 |
| 90% |
89.4% |
80,192 |
79,625 |
| 80% |
80.1% |
71,282 |
71,361 |
| 70% |
70.5% |
62,372 |
62,789 |
| 60% |
60.0% |
53,461 |
53,495 |
| 50% |
49.8% |
44,551 |
44,411 |
| 40% |
39.5% |
35,641 |
35,215 |
| 30% |
30.0% |
26,731 |
26,707 |
| 20% |
19.6% |
17,820 |
17,500 |
| 10% |
9.7% |
8,910 |
8,615 |
| Active Idle |
|
0 |
0 |
JVM 'user-PowerEdge-R7515.047' Scores:
| Target Load |
Actual Load |
ssj_ops |
| Target |
Actual |
| Calibration 1 |
|
|
89,501 |
| Calibration 2 |
|
|
88,976 |
| Calibration 3 |
|
|
89,026 |
| ssj_ops@calibrated=89,001 |
| 100% |
99.1% |
89,001 |
88,233 |
| 90% |
89.3% |
80,101 |
79,512 |
| 80% |
80.6% |
71,201 |
71,746 |
| 70% |
71.0% |
62,300 |
63,149 |
| 60% |
59.5% |
53,400 |
52,987 |
| 50% |
49.0% |
44,500 |
43,599 |
| 40% |
40.4% |
35,600 |
35,925 |
| 30% |
30.1% |
26,700 |
26,758 |
| 20% |
19.7% |
17,800 |
17,538 |
| 10% |
9.6% |
8,900 |
8,567 |
| Active Idle |
|
0 |
0 |
JVM 'user-PowerEdge-R7515.048' Scores:
| Target Load |
Actual Load |
ssj_ops |
| Target |
Actual |
| Calibration 1 |
|
|
87,530 |
| Calibration 2 |
|
|
87,602 |
| Calibration 3 |
|
|
87,394 |
| ssj_ops@calibrated=87,498 |
| 100% |
99.7% |
87,498 |
87,258 |
| 90% |
90.9% |
78,749 |
79,523 |
| 80% |
80.9% |
69,999 |
70,750 |
| 70% |
70.8% |
61,249 |
61,926 |
| 60% |
59.0% |
52,499 |
51,647 |
| 50% |
49.9% |
43,749 |
43,703 |
| 40% |
39.9% |
34,999 |
34,923 |
| 30% |
30.5% |
26,250 |
26,679 |
| 20% |
20.4% |
17,500 |
17,882 |
| 10% |
10.0% |
8,750 |
8,729 |
| Active Idle |
|
0 |
0 |
JVM 'user-PowerEdge-R7515.049' Scores:
| Target Load |
Actual Load |
ssj_ops |
| Target |
Actual |
| Calibration 1 |
|
|
87,872 |
| Calibration 2 |
|
|
88,081 |
| Calibration 3 |
|
|
88,066 |
| ssj_ops@calibrated=88,074 |
| 100% |
99.0% |
88,074 |
87,237 |
| 90% |
89.7% |
79,266 |
79,013 |
| 80% |
80.8% |
70,459 |
71,171 |
| 70% |
70.1% |
61,652 |
61,773 |
| 60% |
61.1% |
52,844 |
53,849 |
| 50% |
49.3% |
44,037 |
43,437 |
| 40% |
40.1% |
35,229 |
35,337 |
| 30% |
29.2% |
26,422 |
25,721 |
| 20% |
20.5% |
17,615 |
18,029 |
| 10% |
9.9% |
8,807 |
8,758 |
| Active Idle |
|
0 |
0 |
JVM 'user-PowerEdge-R7515.050' Scores:
| Target Load |
Actual Load |
ssj_ops |
| Target |
Actual |
| Calibration 1 |
|
|
90,192 |
| Calibration 2 |
|
|
89,632 |
| Calibration 3 |
|
|
89,788 |
| ssj_ops@calibrated=89,710 |
| 100% |
100.2% |
89,710 |
89,871 |
| 90% |
90.4% |
80,739 |
81,096 |
| 80% |
79.6% |
71,768 |
71,422 |
| 70% |
70.2% |
62,797 |
62,955 |
| 60% |
60.3% |
53,826 |
54,064 |
| 50% |
49.7% |
44,855 |
44,626 |
| 40% |
39.8% |
35,884 |
35,706 |
| 30% |
30.1% |
26,913 |
27,042 |
| 20% |
20.2% |
17,942 |
18,136 |
| 10% |
10.3% |
8,971 |
9,254 |
| Active Idle |
|
0 |
0 |
JVM 'user-PowerEdge-R7515.051' Scores:
| Target Load |
Actual Load |
ssj_ops |
| Target |
Actual |
| Calibration 1 |
|
|
89,521 |
| Calibration 2 |
|
|
91,471 |
| Calibration 3 |
|
|
91,472 |
| ssj_ops@calibrated=91,471 |
| 100% |
99.8% |
91,471 |
91,322 |
| 90% |
90.1% |
82,324 |
82,374 |
| 80% |
79.4% |
73,177 |
72,598 |
| 70% |
69.7% |
64,030 |
63,777 |
| 60% |
60.4% |
54,883 |
55,204 |
| 50% |
49.2% |
45,736 |
45,045 |
| 40% |
40.5% |
36,589 |
37,076 |
| 30% |
30.1% |
27,441 |
27,554 |
| 20% |
19.3% |
18,294 |
17,671 |
| 10% |
10.0% |
9,147 |
9,175 |
| Active Idle |
|
0 |
0 |
JVM 'user-PowerEdge-R7515.052' Scores:
| Target Load |
Actual Load |
ssj_ops |
| Target |
Actual |
| Calibration 1 |
|
|
89,411 |
| Calibration 2 |
|
|
90,082 |
| Calibration 3 |
|
|
90,139 |
| ssj_ops@calibrated=90,110 |
| 100% |
99.9% |
90,110 |
90,045 |
| 90% |
90.0% |
81,099 |
81,098 |
| 80% |
80.3% |
72,088 |
72,394 |
| 70% |
69.9% |
63,077 |
63,027 |
| 60% |
59.7% |
54,066 |
53,831 |
| 50% |
50.5% |
45,055 |
45,507 |
| 40% |
40.4% |
36,044 |
36,380 |
| 30% |
30.1% |
27,033 |
27,164 |
| 20% |
19.9% |
18,022 |
17,967 |
| 10% |
9.9% |
9,011 |
8,927 |
| Active Idle |
|
0 |
0 |
JVM 'user-PowerEdge-R7515.053' Scores:
| Target Load |
Actual Load |
ssj_ops |
| Target |
Actual |
| Calibration 1 |
|
|
88,758 |
| Calibration 2 |
|
|
88,402 |
| Calibration 3 |
|
|
88,186 |
| ssj_ops@calibrated=88,294 |
| 100% |
100.3% |
88,294 |
88,541 |
| 90% |
89.6% |
79,465 |
79,139 |
| 80% |
80.1% |
70,635 |
70,709 |
| 70% |
70.9% |
61,806 |
62,598 |
| 60% |
59.5% |
52,976 |
52,557 |
| 50% |
51.0% |
44,147 |
44,998 |
| 40% |
40.4% |
35,318 |
35,656 |
| 30% |
30.5% |
26,488 |
26,929 |
| 20% |
20.1% |
17,659 |
17,779 |
| 10% |
9.6% |
8,829 |
8,481 |
| Active Idle |
|
0 |
0 |
JVM 'user-PowerEdge-R7515.054' Scores:
| Target Load |
Actual Load |
ssj_ops |
| Target |
Actual |
| Calibration 1 |
|
|
88,015 |
| Calibration 2 |
|
|
87,425 |
| Calibration 3 |
|
|
87,663 |
| ssj_ops@calibrated=87,544 |
| 100% |
99.8% |
87,544 |
87,411 |
| 90% |
90.2% |
78,789 |
78,985 |
| 80% |
80.6% |
70,035 |
70,571 |
| 70% |
70.9% |
61,281 |
62,111 |
| 60% |
60.2% |
52,526 |
52,667 |
| 50% |
50.6% |
43,772 |
44,276 |
| 40% |
39.3% |
35,018 |
34,408 |
| 30% |
30.6% |
26,263 |
26,799 |
| 20% |
20.0% |
17,509 |
17,471 |
| 10% |
10.1% |
8,754 |
8,836 |
| Active Idle |
|
0 |
0 |
JVM 'user-PowerEdge-R7515.055' Scores:
| Target Load |
Actual Load |
ssj_ops |
| Target |
Actual |
| Calibration 1 |
|
|
89,436 |
| Calibration 2 |
|
|
89,202 |
| Calibration 3 |
|
|
89,199 |
| ssj_ops@calibrated=89,201 |
| 100% |
100.2% |
89,201 |
89,397 |
| 90% |
89.8% |
80,281 |
80,071 |
| 80% |
80.7% |
71,361 |
71,947 |
| 70% |
70.3% |
62,440 |
62,689 |
| 60% |
59.6% |
53,520 |
53,203 |
| 50% |
49.4% |
44,600 |
44,107 |
| 40% |
40.0% |
35,680 |
35,720 |
| 30% |
30.1% |
26,760 |
26,874 |
| 20% |
19.7% |
17,840 |
17,612 |
| 10% |
9.7% |
8,920 |
8,691 |
| Active Idle |
|
0 |
0 |
JVM 'user-PowerEdge-R7515.056' Scores:
| Target Load |
Actual Load |
ssj_ops |
| Target |
Actual |
| Calibration 1 |
|
|
87,439 |
| Calibration 2 |
|
|
87,819 |
| Calibration 3 |
|
|
87,446 |
| ssj_ops@calibrated=87,632 |
| 100% |
100.2% |
87,632 |
87,817 |
| 90% |
90.0% |
78,869 |
78,829 |
| 80% |
79.5% |
70,106 |
69,672 |
| 70% |
70.0% |
61,343 |
61,345 |
| 60% |
60.1% |
52,579 |
52,690 |
| 50% |
50.5% |
43,816 |
44,237 |
| 40% |
40.1% |
35,053 |
35,112 |
| 30% |
29.9% |
26,290 |
26,217 |
| 20% |
20.4% |
17,526 |
17,850 |
| 10% |
9.4% |
8,763 |
8,279 |
| Active Idle |
|
0 |
0 |
JVM 'user-PowerEdge-R7515.057' Scores:
| Target Load |
Actual Load |
ssj_ops |
| Target |
Actual |
| Calibration 1 |
|
|
87,319 |
| Calibration 2 |
|
|
87,042 |
| Calibration 3 |
|
|
87,166 |
| ssj_ops@calibrated=87,104 |
| 100% |
99.5% |
87,104 |
86,631 |
| 90% |
90.4% |
78,394 |
78,766 |
| 80% |
79.3% |
69,683 |
69,095 |
| 70% |
69.7% |
60,973 |
60,708 |
| 60% |
59.8% |
52,262 |
52,061 |
| 50% |
49.5% |
43,552 |
43,139 |
| 40% |
39.4% |
34,842 |
34,299 |
| 30% |
30.7% |
26,131 |
26,767 |
| 20% |
20.0% |
17,421 |
17,417 |
| 10% |
9.7% |
8,710 |
8,427 |
| Active Idle |
|
0 |
0 |
JVM 'user-PowerEdge-R7515.058' Scores:
| Target Load |
Actual Load |
ssj_ops |
| Target |
Actual |
| Calibration 1 |
|
|
90,780 |
| Calibration 2 |
|
|
90,962 |
| Calibration 3 |
|
|
91,133 |
| ssj_ops@calibrated=91,047 |
| 100% |
99.2% |
91,047 |
90,291 |
| 90% |
89.9% |
81,942 |
81,820 |
| 80% |
80.1% |
72,838 |
72,896 |
| 70% |
70.6% |
63,733 |
64,310 |
| 60% |
60.2% |
54,628 |
54,814 |
| 50% |
49.5% |
45,524 |
45,074 |
| 40% |
39.8% |
36,419 |
36,282 |
| 30% |
29.2% |
27,314 |
26,582 |
| 20% |
20.3% |
18,209 |
18,512 |
| 10% |
10.2% |
9,105 |
9,254 |
| Active Idle |
|
0 |
0 |
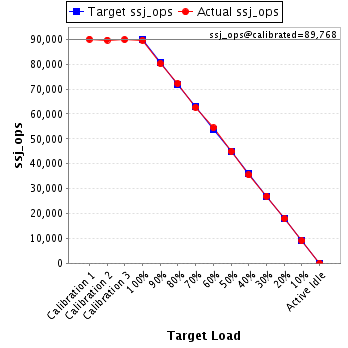
JVM 'user-PowerEdge-R7515.059' Scores:
| Target Load |
Actual Load |
ssj_ops |
| Target |
Actual |
| Calibration 1 |
|
|
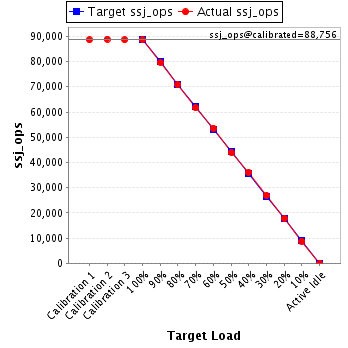
89,116 |
| Calibration 2 |
|
|
88,591 |
| Calibration 3 |
|
|
88,696 |
| ssj_ops@calibrated=88,643 |
| 100% |
99.7% |
88,643 |
88,418 |
| 90% |
90.2% |
79,779 |
80,000 |
| 80% |
80.2% |
70,915 |
71,106 |
| 70% |
70.3% |
62,050 |
62,312 |
| 60% |
59.1% |
53,186 |
52,395 |
| 50% |
50.3% |
44,322 |
44,615 |
| 40% |
40.3% |
35,457 |
35,704 |
| 30% |
30.1% |
26,593 |
26,697 |
| 20% |
19.6% |
17,729 |
17,371 |
| 10% |
9.7% |
8,864 |
8,587 |
| Active Idle |
|
0 |
0 |
JVM 'user-PowerEdge-R7515.060' Scores:
| Target Load |
Actual Load |
ssj_ops |
| Target |
Actual |
| Calibration 1 |
|
|
87,413 |
| Calibration 2 |
|
|
87,168 |
| Calibration 3 |
|
|
87,309 |
| ssj_ops@calibrated=87,239 |
| 100% |
99.7% |
87,239 |
86,980 |
| 90% |
89.7% |
78,515 |
78,229 |
| 80% |
80.4% |
69,791 |
70,141 |
| 70% |
70.4% |
61,067 |
61,381 |
| 60% |
59.8% |
52,343 |
52,190 |
| 50% |
51.0% |
43,619 |
44,480 |
| 40% |
39.7% |
34,895 |
34,652 |
| 30% |
29.8% |
26,172 |
25,975 |
| 20% |
19.8% |
17,448 |
17,266 |
| 10% |
10.0% |
8,724 |
8,723 |
| Active Idle |
|
0 |
0 |
JVM 'user-PowerEdge-R7515.061' Scores:
| Target Load |
Actual Load |
ssj_ops |
| Target |
Actual |
| Calibration 1 |
|
|
88,047 |
| Calibration 2 |
|
|
87,472 |
| Calibration 3 |
|
|
87,831 |
| ssj_ops@calibrated=87,652 |
| 100% |
100.0% |
87,652 |
87,632 |
| 90% |
89.6% |
78,887 |
78,506 |
| 80% |
79.5% |
70,121 |
69,708 |
| 70% |
69.6% |
61,356 |
60,964 |
| 60% |
60.0% |
52,591 |
52,620 |
| 50% |
49.8% |
43,826 |
43,626 |
| 40% |
39.8% |
35,061 |
34,847 |
| 30% |
30.3% |
26,296 |
26,569 |
| 20% |
20.5% |
17,530 |
17,925 |
| 10% |
10.0% |
8,765 |
8,742 |
| Active Idle |
|
0 |
0 |
JVM 'user-PowerEdge-R7515.062' Scores:
| Target Load |
Actual Load |
ssj_ops |
| Target |
Actual |
| Calibration 1 |
|
|
89,651 |
| Calibration 2 |
|
|
89,836 |
| Calibration 3 |
|
|
89,920 |
| ssj_ops@calibrated=89,878 |
| 100% |
100.1% |
89,878 |
89,974 |
| 90% |
89.7% |
80,890 |
80,624 |
| 80% |
79.8% |
71,903 |
71,699 |
| 70% |
70.2% |
62,915 |
63,110 |
| 60% |
59.5% |
53,927 |
53,460 |
| 50% |
49.9% |
44,939 |
44,824 |
| 40% |
40.2% |
35,951 |
36,151 |
| 30% |
30.1% |
26,963 |
27,085 |
| 20% |
19.9% |
17,976 |
17,925 |
| 10% |
10.1% |
8,988 |
9,111 |
| Active Idle |
|
0 |
0 |
JVM 'user-PowerEdge-R7515.063' Scores:
| Target Load |
Actual Load |
ssj_ops |
| Target |
Actual |
| Calibration 1 |
|
|
87,473 |
| Calibration 2 |
|
|
88,003 |
| Calibration 3 |
|
|
87,970 |
| ssj_ops@calibrated=87,986 |
| 100% |
99.0% |
87,986 |
87,150 |
| 90% |
90.4% |
79,188 |
79,582 |
| 80% |
79.8% |
70,389 |
70,181 |
| 70% |
69.1% |
61,590 |
60,784 |
| 60% |
61.0% |
52,792 |
53,668 |
| 50% |
49.8% |
43,993 |
43,803 |
| 40% |
40.4% |
35,195 |
35,582 |
| 30% |
30.5% |
26,396 |
26,807 |
| 20% |
19.9% |
17,597 |
17,479 |
| 10% |
10.2% |
8,799 |
8,954 |
| Active Idle |
|
0 |
0 |
JVM 'user-PowerEdge-R7515.064' Scores:
| Target Load |
Actual Load |
ssj_ops |
| Target |
Actual |
| Calibration 1 |
|
|
89,778 |
| Calibration 2 |
|
|
89,292 |
| Calibration 3 |
|
|
89,307 |
| ssj_ops@calibrated=89,300 |
| 100% |
100.4% |
89,300 |
89,673 |
| 90% |
90.3% |
80,370 |
80,639 |
| 80% |
79.1% |
71,440 |
70,644 |
| 70% |
69.6% |
62,510 |
62,111 |
| 60% |
59.4% |
53,580 |
53,057 |
| 50% |
50.1% |
44,650 |
44,758 |
| 40% |
40.4% |
35,720 |
36,033 |
| 30% |
30.4% |
26,790 |
27,104 |
| 20% |
20.0% |
17,860 |
17,820 |
| 10% |
9.8% |
8,930 |
8,787 |
| Active Idle |
|
0 |
0 |