SPECpower_ssj2008
Aggregate Performance Report
Copyright © 2007-2020 Standard Performance Evaluation Corporation
| Hewlett Packard Enterprise Apollo XL225n Gen10 Plus | ssj_ops@100% = 31,966,408 ssj_ops@100% per Host = 10,655,469 ssj_ops@100% per JVM = 332,983 |
||||
| Test Sponsor: | Hewlett Packard Enterprise | SPEC License #: | 3 | Test Method: | Multi Node |
| Tested By: | Hewlett Packard Enterprise | Test Location: | Houston, TX, USA | Test Date: | Feb 14, 2019 |
| Hardware Availability: | Jun-2020 | Software Availability: | Feb-2020 | Publication: | Apr 22, 2020 |
| System Source: | Single Supplier | System Designation: | Server | Power Provisioning: | Line-powered |
| Target Load | Actual Load | ssj_ops | |
|---|---|---|---|
| Target | Actual | ||
| Calibration 1 | 32,066,370 | ||
| Calibration 2 | 32,101,746 | ||
| Calibration 3 | 32,120,411 | ||
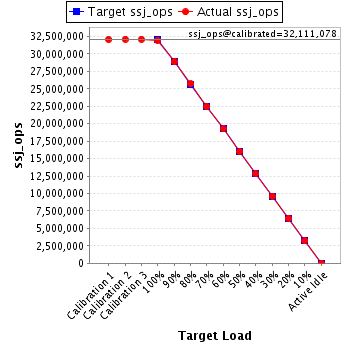
| ssj_ops@calibrated=32,111,078 | |||
| 100% | 99.5% | 32,111,078 | 31,966,408 |
| 90% | 90.0% | 28,899,970 | 28,901,958 |
| 80% | 80.0% | 25,688,863 | 25,701,865 |
| 70% | 70.0% | 22,477,755 | 22,470,028 |
| 60% | 60.0% | 19,266,647 | 19,257,057 |
| 50% | 50.0% | 16,055,539 | 16,053,088 |
| 40% | 40.0% | 12,844,431 | 12,846,533 |
| 30% | 30.0% | 9,633,323 | 9,636,889 |
| 20% | 20.0% | 6,422,216 | 6,428,968 |
| 10% | 10.0% | 3,211,108 | 3,208,245 |
| Active Idle | 0 | 0 | |
| # of Nodes | # of Chips | # of Cores | # of Threads | Total RAM (GB) | # of OS Images | # of JVM Instances |
|---|---|---|---|---|---|---|
| 3 | 6 | 384 | 768 | 768 | 3 | 96 |
| Set Identifier: | SUT |
| Set Description: | System Under Test |
| # of Identical Nodes: | 3 |
| Comment: | SUT |
| Software per Node | |
|---|---|
| Power Management: | Enabled (see SUT Notes) |
| Operating System (OS): | SUSE Linux Enterprise Server 15 SP1 |
| OS Version: | 4.12.14-195-default |
| Filesystem: | xfs |
| JVM Vendor: | Oracle Corporation |
| JVM Version: | Oracle Java HotSpot(TM) 64-Bit Server VM (build 13.0.1+9, mixed mode, sharing); version 13.0.1 |
| JVM Command-line Options: | -server -Xmn2400m -Xms2800m -Xmx2800m -XX:MaxTenuringThreshold=1 -XX:ParallelGCThreads=4 -XX:InlineSmallCode=4000 -XX:MaxInlineSize=300 -XX:FreqInlineSize=3000 -XX:+UseParallelOldGC -XX:+UseHugeTLBFS |
| JVM Affinity: | numactl --cpunodebind=[0-31] --localalloc |
| JVM Instances: | 32 |
| JVM Initial Heap (MB): | 2800 |
| JVM Maximum Heap (MB): | 2800 |
| JVM Address Bits: | 64 |
| Boot Firmware Version: | A46 v1.20 (02/28/2020) |
| Management Firmware Version: | 2.14 Feb 11 2020 |
| Workload Version: | SSJ 1.2.10 |
| Director Location: | Controller |
| Other Software: | None |
| Host | ssj_ops@100% |
|---|---|
| node-02 | 10,640,079 |
| node-03 | 10,655,425 |
| node-04 | 10,670,904 |
| ssj_ops@100% | 31,966,408 |
| ssj_ops@100% per Host | 10,655,469 |
| ssj_ops@100% per JVM | 332,983 |

| Target Load | Actual Load | ssj_ops | |
|---|---|---|---|
| Target | Actual | ||
| Calibration 1 | 10,679,243 | ||
| Calibration 2 | 10,687,244 | ||
| Calibration 3 | 10,690,965 | ||
| ssj_ops@calibrated=10,689,105 | |||
| 100% | 99.5% | 10,689,105 | 10,640,079 |
| 90% | 90.0% | 9,620,194 | 9,624,233 |
| 80% | 80.0% | 8,551,284 | 8,551,798 |
| 70% | 70.0% | 7,482,373 | 7,482,847 |
| 60% | 59.9% | 6,413,463 | 6,405,557 |
| 50% | 50.0% | 5,344,552 | 5,341,982 |
| 40% | 40.0% | 4,275,642 | 4,271,786 |
| 30% | 30.0% | 3,206,731 | 3,207,388 |
| 20% | 20.0% | 2,137,821 | 2,137,343 |
| 10% | 10.0% | 1,068,910 | 1,067,223 |
| Active Idle | 0 | 0 | |

| Target Load | Actual Load | ssj_ops | |
|---|---|---|---|
| Target | Actual | ||
| Calibration 1 | 10,691,858 | ||
| Calibration 2 | 10,699,332 | ||
| Calibration 3 | 10,706,211 | ||
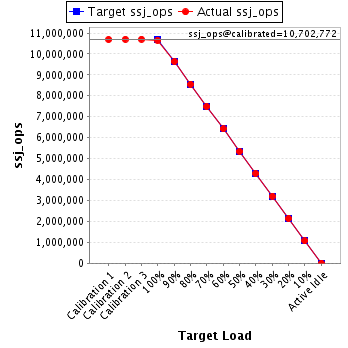
| ssj_ops@calibrated=10,702,772 | |||
| 100% | 99.6% | 10,702,772 | 10,655,425 |
| 90% | 90.0% | 9,632,494 | 9,637,745 |
| 80% | 80.0% | 8,562,217 | 8,557,472 |
| 70% | 70.0% | 7,491,940 | 7,487,383 |
| 60% | 60.0% | 6,421,663 | 6,418,818 |
| 50% | 50.0% | 5,351,386 | 5,349,572 |
| 40% | 40.0% | 4,281,109 | 4,285,560 |
| 30% | 30.0% | 3,210,831 | 3,207,328 |
| 20% | 20.0% | 2,140,554 | 2,144,602 |
| 10% | 10.0% | 1,070,277 | 1,070,139 |
| Active Idle | 0 | 0 | |
| Target Load | Actual Load | ssj_ops | |
|---|---|---|---|
| Target | Actual | ||
| Calibration 1 | 10,695,269 | ||
| Calibration 2 | 10,715,169 | ||
| Calibration 3 | 10,723,234 | ||
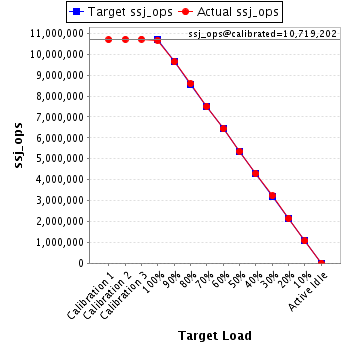
| ssj_ops@calibrated=10,719,202 | |||
| 100% | 99.5% | 10,719,202 | 10,670,904 |
| 90% | 89.9% | 9,647,282 | 9,639,981 |
| 80% | 80.2% | 8,575,361 | 8,592,594 |
| 70% | 70.0% | 7,503,441 | 7,499,798 |
| 60% | 60.0% | 6,431,521 | 6,432,682 |
| 50% | 50.0% | 5,359,601 | 5,361,534 |
| 40% | 40.0% | 4,287,681 | 4,289,187 |
| 30% | 30.1% | 3,215,761 | 3,222,173 |
| 20% | 20.0% | 2,143,840 | 2,147,024 |
| 10% | 10.0% | 1,071,920 | 1,070,884 |
| Active Idle | 0 | 0 | |