SPECpower_ssj2008
Host 'node3' Performance Report
Copyright © 2007-2020 Standard Performance Evaluation Corporation
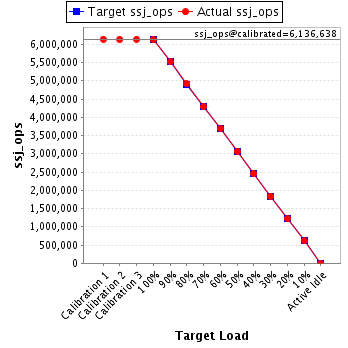
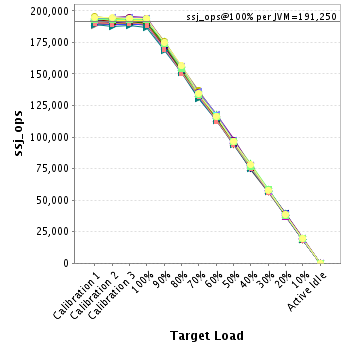
| ASUSTeK Computer Inc. RS620SA-E10-RS12 | ssj_ops@100% = 6,120,015 ssj_ops@100% per JVM = 191,250 |
||||
| Test Sponsor: | ASUSTeK Computer Inc. | SPEC License #: | 9016 | Test Method: | Multi Node |
| Tested By: | ASUSTeK Computer Inc. | Test Location: | Taipei, Taiwan. | Test Date: | Sep 18, 2020 |
| Hardware Availability: | Sep-2020 | Software Availability: | Jul-2020 | Publication: | Oct 7, 2020 |
| System Source: | Single Supplier | System Designation: | Server | Power Provisioning: | Line-powered |
| Target Load | Actual Load | ssj_ops | |
|---|---|---|---|
| Target | Actual | ||
| Calibration 1 | 6,140,952 | ||
| Calibration 2 | 6,132,721 | ||
| Calibration 3 | 6,140,556 | ||
| ssj_ops@calibrated=6,136,638 | |||
| 100% | 99.7% | 6,136,638 | 6,120,015 |
| 90% | 90.0% | 5,522,974 | 5,521,619 |
| 80% | 80.1% | 4,909,310 | 4,916,131 |
| 70% | 69.9% | 4,295,647 | 4,286,712 |
| 60% | 60.1% | 3,681,983 | 3,685,231 |
| 50% | 50.0% | 3,068,319 | 3,066,868 |
| 40% | 40.0% | 2,454,655 | 2,454,309 |
| 30% | 29.9% | 1,840,991 | 1,836,961 |
| 20% | 20.0% | 1,227,328 | 1,227,298 |
| 10% | 10.0% | 613,664 | 614,460 |
| Active Idle | 0 | 0 | |
| Set Identifier: | RS620SA-E10-RS12 |
| Set Description: | System Under Test |
| # of Identical Nodes: | 6 |
| Comment: | 'SUT' |
| Hardware | |
|---|---|
| Hardware Vendor: | ASUSTeK Computer Inc. |
| Model: | RS620SA-E10-RS12 |
| Form Factor: | 1U |
| CPU Name: | AMD EPYC 7742 2.25Ghz |
| CPU Characteristics: | 64-Core, 2.25GHz, 256MB L3 Cache |
| CPU Frequency (MHz): | 2250 |
| CPU(s) Enabled: | 64 cores, 1 chip, 64 cores/chip |
| Hardware Threads: | 128 (2 / core) |
| CPU(s) Orderable: | 1 chip |
| Primary Cache: | 32 KB I + 32 KB D on chip per core |
| Secondary Cache: | 512 KB I+D on chip per core |
| Tertiary Cache: | 256 MB I+D on chip per chip, 16 MB shared / 4 cores |
| Other Cache: | None |
| Memory Amount (GB): | 128 |
| # and size of DIMM: | 8 x 16 GB |
| Memory Details: | 8 x 16GB 2Rx8 PC4-3200AA-R ECC RDIMM; all slots populated |
| Power Supply Quantity and Rating (W): | None |
| Power Supply Details: | Shared |
| Disk Drive: | 1 x 240GB Seagate Nytro 510DCT M.2 PCIE SSD P/N: 03B03-00130200 |
| Disk Controller: | Integrated PCIE controller |
| # and type of Network Interface Cards (NICs) Installed: | 1 x Intel I210 Gigabit Ethernet controller |
| NICs Enabled in Firmware / OS / Connected: | 1/1/1 |
| Network Speed (Mbit): | 1000 |
| Keyboard: | None |
| Mouse: | None |
| Monitor: | None |
| Optical Drives: | No |
| Other Hardware: | None |
| Software | |
|---|---|
| Power Management: | Enabled(See SUT Notes) |
| Operating System (OS): | Suse Linux Enterprise Server 15 SP1 |
| OS Version: | 4.12.14-195-default |
| Filesystem: | xfs |
| JVM Vendor: | Oracle |
| JVM Version: | Java HotSpot(TM) 64-Bit Server VM (build 14.0.2+12-46, mixed mode, sharing), version 14.0.2 |
| JVM Command-line Options: | -server -Xmn1200m -Xms1400m -Xmx1400m -XX:MaxTenuringThreshold=1 -XX:ParallelGCThreads=2 -XX:InlineSmallCode=4000 -XX:MaxInlineSize=300 -XX:FreqInlineSize=3000 -XX:+UseParallelGC -XX:+UseLargePages -XX:+UseHugeTLBFS -XX:+UseTransparentHugePages |
| JVM Affinity: | for each two physicalCores { numactl -C physicalCoreId, physicalCoreId + 1, physicalCoreId + 64, physicalCoreId + 65 -l } |
| JVM Instances: | 32 |
| JVM Initial Heap (MB): | 1400 |
| JVM Maximum Heap (MB): | 1400 |
| JVM Address Bits: | 64 |
| Boot Firmware Version: | 0305 |
| Management Firmware Version: | 2.1.09 |
| Workload Version: | SSJ 1.2.10 |
| Director Location: | Controller |
| Other Software: | None |
| JVM Instance | ssj_ops@100% |
|---|---|
| node3.001 | 191,554 |
| node3.002 | 192,114 |
| node3.003 | 192,700 |
| node3.004 | 190,213 |
| node3.005 | 192,104 |
| node3.006 | 191,255 |
| node3.007 | 189,295 |
| node3.008 | 188,560 |
| node3.009 | 192,090 |
| node3.010 | 193,095 |
| node3.011 | 190,968 |
| node3.012 | 193,293 |
| node3.013 | 189,087 |
| node3.014 | 191,013 |
| node3.015 | 189,214 |
| node3.016 | 189,329 |
| node3.017 | 189,431 |
| node3.018 | 191,769 |
| node3.019 | 192,087 |
| node3.020 | 190,539 |
| node3.021 | 193,391 |
| node3.022 | 193,589 |
| node3.023 | 190,867 |
| node3.024 | 189,552 |
| node3.025 | 190,240 |
| node3.026 | 189,880 |
| node3.027 | 195,065 |
| node3.028 | 186,981 |
| node3.029 | 189,465 |
| node3.030 | 194,263 |
| node3.031 | 192,959 |
| node3.032 | 194,050 |
| ssj_ops@100% | 6,120,015 |
| ssj_ops@100% per JVM | 191,250 |
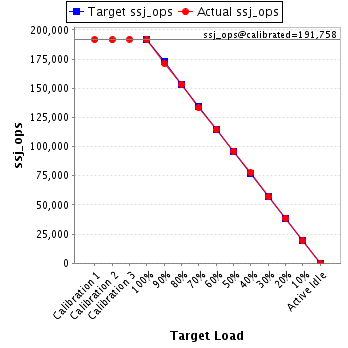
| Target Load | Actual Load | ssj_ops | |
|---|---|---|---|
| Target | Actual | ||
| Calibration 1 | 191,709 | ||
| Calibration 2 | 191,468 | ||
| Calibration 3 | 192,048 | ||
| ssj_ops@calibrated=191,758 | |||
| 100% | 99.9% | 191,758 | 191,554 |
| 90% | 89.4% | 172,582 | 171,382 |
| 80% | 80.0% | 153,406 | 153,311 |
| 70% | 69.5% | 134,231 | 133,304 |
| 60% | 59.8% | 115,055 | 114,736 |
| 50% | 50.1% | 95,879 | 96,070 |
| 40% | 40.5% | 76,703 | 77,596 |
| 30% | 29.7% | 57,527 | 56,951 |
| 20% | 20.0% | 38,352 | 38,433 |
| 10% | 10.1% | 19,176 | 19,363 |
| Active Idle | 0 | 0 | |
| Target Load | Actual Load | ssj_ops | |
|---|---|---|---|
| Target | Actual | ||
| Calibration 1 | 194,112 | ||
| Calibration 2 | 192,263 | ||
| Calibration 3 | 192,631 | ||
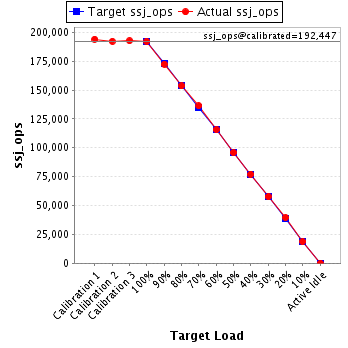
| ssj_ops@calibrated=192,447 | |||
| 100% | 99.8% | 192,447 | 192,114 |
| 90% | 89.6% | 173,202 | 172,442 |
| 80% | 79.8% | 153,958 | 153,560 |
| 70% | 70.8% | 134,713 | 136,308 |
| 60% | 60.2% | 115,468 | 115,768 |
| 50% | 49.8% | 96,224 | 95,848 |
| 40% | 40.1% | 76,979 | 77,159 |
| 30% | 30.0% | 57,734 | 57,690 |
| 20% | 20.5% | 38,489 | 39,487 |
| 10% | 9.7% | 19,245 | 18,753 |
| Active Idle | 0 | 0 | |
| Target Load | Actual Load | ssj_ops | |
|---|---|---|---|
| Target | Actual | ||
| Calibration 1 | 193,631 | ||
| Calibration 2 | 194,045 | ||
| Calibration 3 | 194,316 | ||
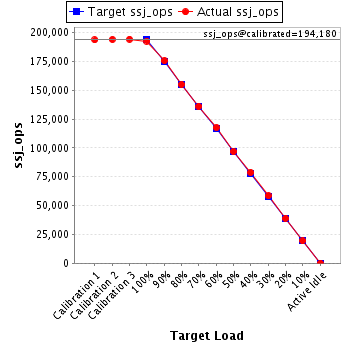
| ssj_ops@calibrated=194,180 | |||
| 100% | 99.2% | 194,180 | 192,700 |
| 90% | 90.4% | 174,762 | 175,628 |
| 80% | 79.8% | 155,344 | 154,970 |
| 70% | 70.1% | 135,926 | 136,088 |
| 60% | 60.6% | 116,508 | 117,606 |
| 50% | 49.9% | 97,090 | 96,957 |
| 40% | 40.6% | 77,672 | 78,779 |
| 30% | 30.1% | 58,254 | 58,408 |
| 20% | 20.1% | 38,836 | 39,078 |
| 10% | 10.0% | 19,418 | 19,359 |
| Active Idle | 0 | 0 | |
| Target Load | Actual Load | ssj_ops | |
|---|---|---|---|
| Target | Actual | ||
| Calibration 1 | 190,068 | ||
| Calibration 2 | 189,987 | ||
| Calibration 3 | 190,294 | ||
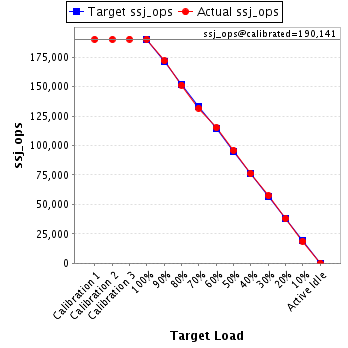
| ssj_ops@calibrated=190,141 | |||
| 100% | 100.0% | 190,141 | 190,213 |
| 90% | 90.4% | 171,127 | 171,862 |
| 80% | 79.6% | 152,112 | 151,374 |
| 70% | 69.2% | 133,098 | 131,652 |
| 60% | 60.6% | 114,084 | 115,208 |
| 50% | 50.4% | 95,070 | 95,870 |
| 40% | 40.0% | 76,056 | 76,141 |
| 30% | 30.2% | 57,042 | 57,340 |
| 20% | 20.0% | 38,028 | 38,036 |
| 10% | 9.8% | 19,014 | 18,713 |
| Active Idle | 0 | 0 | |
| Target Load | Actual Load | ssj_ops | |
|---|---|---|---|
| Target | Actual | ||
| Calibration 1 | 192,083 | ||
| Calibration 2 | 191,617 | ||
| Calibration 3 | 192,091 | ||
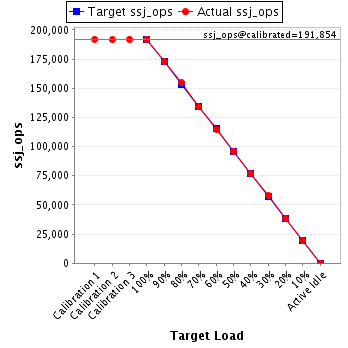
| ssj_ops@calibrated=191,854 | |||
| 100% | 100.1% | 191,854 | 192,104 |
| 90% | 90.0% | 172,669 | 172,733 |
| 80% | 80.6% | 153,483 | 154,646 |
| 70% | 69.8% | 134,298 | 134,008 |
| 60% | 60.0% | 115,112 | 115,019 |
| 50% | 50.1% | 95,927 | 96,062 |
| 40% | 40.0% | 76,742 | 76,686 |
| 30% | 30.2% | 57,556 | 57,948 |
| 20% | 20.0% | 38,371 | 38,442 |
| 10% | 10.1% | 19,185 | 19,467 |
| Active Idle | 0 | 0 | |
| Target Load | Actual Load | ssj_ops | |
|---|---|---|---|
| Target | Actual | ||
| Calibration 1 | 190,975 | ||
| Calibration 2 | 191,073 | ||
| Calibration 3 | 191,166 | ||
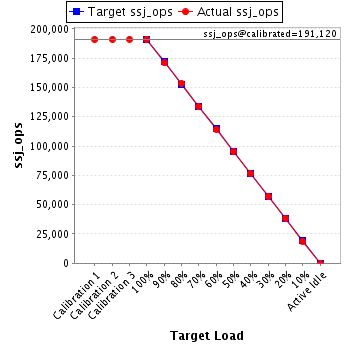
| ssj_ops@calibrated=191,120 | |||
| 100% | 100.1% | 191,120 | 191,255 |
| 90% | 89.5% | 172,008 | 170,998 |
| 80% | 80.2% | 152,896 | 153,367 |
| 70% | 70.1% | 133,784 | 133,883 |
| 60% | 59.8% | 114,672 | 114,239 |
| 50% | 49.7% | 95,560 | 94,976 |
| 40% | 40.0% | 76,448 | 76,517 |
| 30% | 29.9% | 57,336 | 57,137 |
| 20% | 20.0% | 38,224 | 38,204 |
| 10% | 9.9% | 19,112 | 18,990 |
| Active Idle | 0 | 0 | |
| Target Load | Actual Load | ssj_ops | |
|---|---|---|---|
| Target | Actual | ||
| Calibration 1 | 189,813 | ||
| Calibration 2 | 189,970 | ||
| Calibration 3 | 190,188 | ||
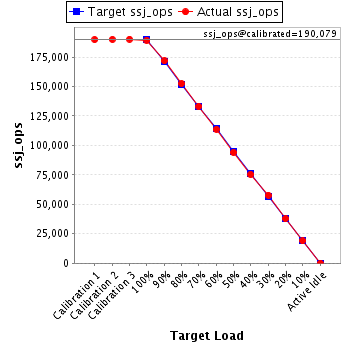
| ssj_ops@calibrated=190,079 | |||
| 100% | 99.6% | 190,079 | 189,295 |
| 90% | 90.4% | 171,071 | 171,811 |
| 80% | 80.2% | 152,063 | 152,463 |
| 70% | 70.1% | 133,055 | 133,152 |
| 60% | 59.9% | 114,047 | 113,773 |
| 50% | 49.5% | 95,039 | 94,158 |
| 40% | 39.6% | 76,032 | 75,298 |
| 30% | 30.4% | 57,024 | 57,791 |
| 20% | 19.9% | 38,016 | 37,817 |
| 10% | 10.0% | 19,008 | 19,050 |
| Active Idle | 0 | 0 | |
| Target Load | Actual Load | ssj_ops | |
|---|---|---|---|
| Target | Actual | ||
| Calibration 1 | 188,802 | ||
| Calibration 2 | 189,881 | ||
| Calibration 3 | 190,195 | ||
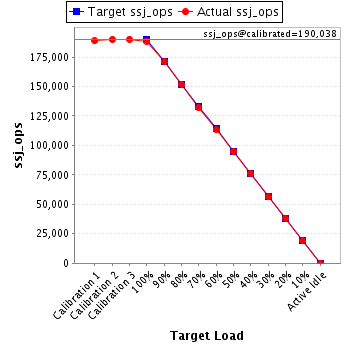
| ssj_ops@calibrated=190,038 | |||
| 100% | 99.2% | 190,038 | 188,560 |
| 90% | 89.9% | 171,034 | 170,935 |
| 80% | 80.0% | 152,030 | 151,946 |
| 70% | 69.5% | 133,027 | 131,997 |
| 60% | 59.6% | 114,023 | 113,210 |
| 50% | 49.8% | 95,019 | 94,693 |
| 40% | 40.0% | 76,015 | 76,068 |
| 30% | 29.7% | 57,011 | 56,482 |
| 20% | 19.9% | 38,008 | 37,742 |
| 10% | 10.0% | 19,004 | 19,016 |
| Active Idle | 0 | 0 | |
| Target Load | Actual Load | ssj_ops | |
|---|---|---|---|
| Target | Actual | ||
| Calibration 1 | 192,909 | ||
| Calibration 2 | 192,641 | ||
| Calibration 3 | 192,168 | ||
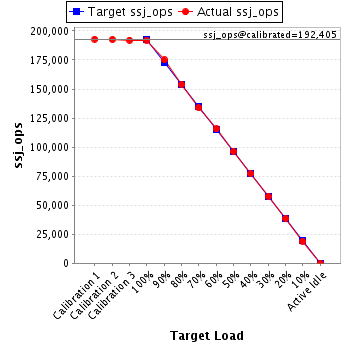
| ssj_ops@calibrated=192,405 | |||
| 100% | 99.8% | 192,405 | 192,090 |
| 90% | 91.0% | 173,164 | 175,087 |
| 80% | 80.0% | 153,924 | 154,016 |
| 70% | 69.6% | 134,683 | 133,874 |
| 60% | 60.1% | 115,443 | 115,657 |
| 50% | 49.9% | 96,202 | 96,004 |
| 40% | 40.0% | 76,962 | 77,037 |
| 30% | 29.9% | 57,721 | 57,453 |
| 20% | 20.0% | 38,481 | 38,454 |
| 10% | 9.9% | 19,240 | 19,065 |
| Active Idle | 0 | 0 | |
| Target Load | Actual Load | ssj_ops | |
|---|---|---|---|
| Target | Actual | ||
| Calibration 1 | 192,619 | ||
| Calibration 2 | 192,927 | ||
| Calibration 3 | 192,786 | ||
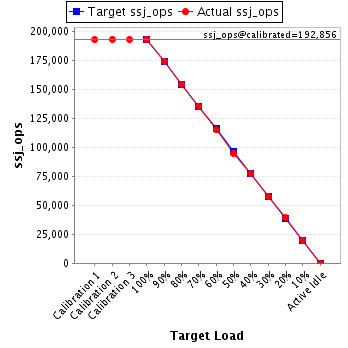
| ssj_ops@calibrated=192,856 | |||
| 100% | 100.1% | 192,856 | 193,095 |
| 90% | 90.2% | 173,571 | 173,985 |
| 80% | 80.0% | 154,285 | 154,325 |
| 70% | 70.1% | 134,999 | 135,176 |
| 60% | 59.6% | 115,714 | 114,974 |
| 50% | 49.2% | 96,428 | 94,945 |
| 40% | 40.1% | 77,143 | 77,424 |
| 30% | 29.7% | 57,857 | 57,318 |
| 20% | 20.3% | 38,571 | 39,135 |
| 10% | 10.0% | 19,286 | 19,317 |
| Active Idle | 0 | 0 | |
| Target Load | Actual Load | ssj_ops | |
|---|---|---|---|
| Target | Actual | ||
| Calibration 1 | 191,189 | ||
| Calibration 2 | 191,514 | ||
| Calibration 3 | 191,904 | ||
| ssj_ops@calibrated=191,709 | |||
| 100% | 99.6% | 191,709 | 190,968 |
| 90% | 90.2% | 172,538 | 172,993 |
| 80% | 80.0% | 153,367 | 153,317 |
| 70% | 69.7% | 134,196 | 133,610 |
| 60% | 60.3% | 115,025 | 115,565 |
| 50% | 49.8% | 95,854 | 95,561 |
| 40% | 39.7% | 76,684 | 76,154 |
| 30% | 30.3% | 57,513 | 58,152 |
| 20% | 20.1% | 38,342 | 38,493 |
| 10% | 10.3% | 19,171 | 19,754 |
| Active Idle | 0 | 0 | |

| Target Load | Actual Load | ssj_ops | |
|---|---|---|---|
| Target | Actual | ||
| Calibration 1 | 195,187 | ||
| Calibration 2 | 193,867 | ||
| Calibration 3 | 194,851 | ||
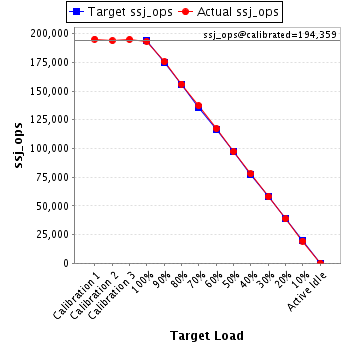
| ssj_ops@calibrated=194,359 | |||
| 100% | 99.5% | 194,359 | 193,293 |
| 90% | 90.3% | 174,923 | 175,497 |
| 80% | 80.3% | 155,487 | 156,090 |
| 70% | 70.6% | 136,051 | 137,181 |
| 60% | 60.4% | 116,615 | 117,331 |
| 50% | 50.0% | 97,180 | 97,233 |
| 40% | 40.0% | 77,744 | 77,799 |
| 30% | 29.8% | 58,308 | 58,005 |
| 20% | 19.9% | 38,872 | 38,618 |
| 10% | 10.0% | 19,436 | 19,378 |
| Active Idle | 0 | 0 | |
| Target Load | Actual Load | ssj_ops | |
|---|---|---|---|
| Target | Actual | ||
| Calibration 1 | 190,587 | ||
| Calibration 2 | 190,785 | ||
| Calibration 3 | 190,779 | ||
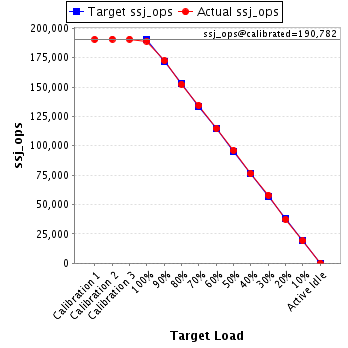
| ssj_ops@calibrated=190,782 | |||
| 100% | 99.1% | 190,782 | 189,087 |
| 90% | 90.4% | 171,704 | 172,536 |
| 80% | 79.9% | 152,626 | 152,442 |
| 70% | 70.5% | 133,547 | 134,452 |
| 60% | 60.2% | 114,469 | 114,847 |
| 50% | 50.4% | 95,391 | 96,106 |
| 40% | 40.0% | 76,313 | 76,238 |
| 30% | 30.3% | 57,235 | 57,878 |
| 20% | 19.6% | 38,156 | 37,410 |
| 10% | 10.1% | 19,078 | 19,204 |
| Active Idle | 0 | 0 | |
| Target Load | Actual Load | ssj_ops | |
|---|---|---|---|
| Target | Actual | ||
| Calibration 1 | 191,338 | ||
| Calibration 2 | 191,190 | ||
| Calibration 3 | 191,208 | ||
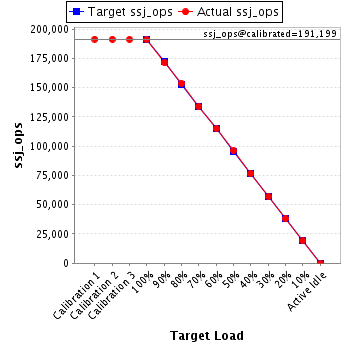
| ssj_ops@calibrated=191,199 | |||
| 100% | 99.9% | 191,199 | 191,013 |
| 90% | 89.6% | 172,079 | 171,335 |
| 80% | 80.3% | 152,959 | 153,575 |
| 70% | 70.1% | 133,839 | 134,001 |
| 60% | 60.2% | 114,719 | 115,133 |
| 50% | 50.2% | 95,600 | 96,058 |
| 40% | 40.1% | 76,480 | 76,734 |
| 30% | 29.8% | 57,360 | 57,025 |
| 20% | 19.8% | 38,240 | 37,929 |
| 10% | 10.0% | 19,120 | 19,051 |
| Active Idle | 0 | 0 | |
| Target Load | Actual Load | ssj_ops | |
|---|---|---|---|
| Target | Actual | ||
| Calibration 1 | 190,370 | ||
| Calibration 2 | 189,268 | ||
| Calibration 3 | 189,543 | ||
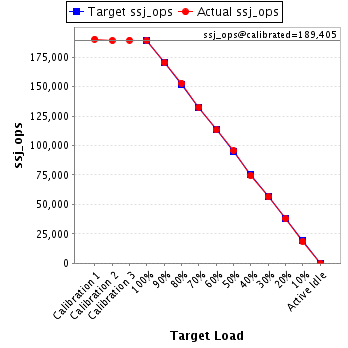
| ssj_ops@calibrated=189,405 | |||
| 100% | 99.9% | 189,405 | 189,214 |
| 90% | 90.0% | 170,465 | 170,472 |
| 80% | 80.8% | 151,524 | 153,007 |
| 70% | 70.0% | 132,584 | 132,649 |
| 60% | 59.8% | 113,643 | 113,219 |
| 50% | 50.6% | 94,703 | 95,789 |
| 40% | 39.3% | 75,762 | 74,371 |
| 30% | 29.7% | 56,822 | 56,340 |
| 20% | 20.0% | 37,881 | 37,800 |
| 10% | 9.9% | 18,941 | 18,727 |
| Active Idle | 0 | 0 | |
| Target Load | Actual Load | ssj_ops | |
|---|---|---|---|
| Target | Actual | ||
| Calibration 1 | 189,801 | ||
| Calibration 2 | 189,703 | ||
| Calibration 3 | 189,932 | ||
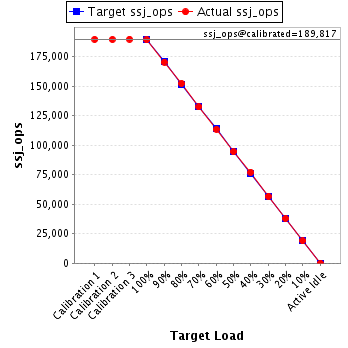
| ssj_ops@calibrated=189,817 | |||
| 100% | 99.7% | 189,817 | 189,329 |
| 90% | 89.9% | 170,836 | 170,553 |
| 80% | 80.3% | 151,854 | 152,479 |
| 70% | 69.8% | 132,872 | 132,447 |
| 60% | 59.8% | 113,890 | 113,593 |
| 50% | 49.8% | 94,909 | 94,486 |
| 40% | 40.7% | 75,927 | 77,204 |
| 30% | 29.9% | 56,945 | 56,706 |
| 20% | 20.0% | 37,963 | 37,974 |
| 10% | 10.0% | 18,982 | 18,942 |
| Active Idle | 0 | 0 | |
| Target Load | Actual Load | ssj_ops | |
|---|---|---|---|
| Target | Actual | ||
| Calibration 1 | 189,933 | ||
| Calibration 2 | 189,563 | ||
| Calibration 3 | 189,379 | ||
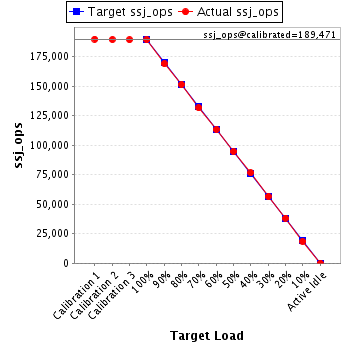
| ssj_ops@calibrated=189,471 | |||
| 100% | 100.0% | 189,471 | 189,431 |
| 90% | 89.3% | 170,524 | 169,123 |
| 80% | 79.9% | 151,577 | 151,392 |
| 70% | 69.5% | 132,630 | 131,734 |
| 60% | 59.9% | 113,683 | 113,511 |
| 50% | 50.1% | 94,736 | 94,841 |
| 40% | 40.4% | 75,788 | 76,599 |
| 30% | 29.9% | 56,841 | 56,561 |
| 20% | 20.2% | 37,894 | 38,331 |
| 10% | 9.8% | 18,947 | 18,567 |
| Active Idle | 0 | 0 | |
| Target Load | Actual Load | ssj_ops | |
|---|---|---|---|
| Target | Actual | ||
| Calibration 1 | 193,023 | ||
| Calibration 2 | 192,637 | ||
| Calibration 3 | 192,845 | ||
| ssj_ops@calibrated=192,741 | |||
| 100% | 99.5% | 192,741 | 191,769 |
| 90% | 89.3% | 173,467 | 172,073 |
| 80% | 80.6% | 154,193 | 155,396 |
| 70% | 69.4% | 134,919 | 133,779 |
| 60% | 59.7% | 115,645 | 115,042 |
| 50% | 50.3% | 96,371 | 96,972 |
| 40% | 39.5% | 77,097 | 76,191 |
| 30% | 30.0% | 57,822 | 57,766 |
| 20% | 20.1% | 38,548 | 38,658 |
| 10% | 10.0% | 19,274 | 19,189 |
| Active Idle | 0 | 0 | |

| Target Load | Actual Load | ssj_ops | |
|---|---|---|---|
| Target | Actual | ||
| Calibration 1 | 192,223 | ||
| Calibration 2 | 192,635 | ||
| Calibration 3 | 192,740 | ||
| ssj_ops@calibrated=192,688 | |||
| 100% | 99.7% | 192,688 | 192,087 |
| 90% | 89.8% | 173,419 | 172,944 |
| 80% | 81.2% | 154,150 | 156,508 |
| 70% | 69.8% | 134,881 | 134,439 |
| 60% | 59.7% | 115,613 | 115,029 |
| 50% | 49.2% | 96,344 | 94,797 |
| 40% | 40.2% | 77,075 | 77,408 |
| 30% | 29.7% | 57,806 | 57,194 |
| 20% | 19.8% | 38,538 | 38,121 |
| 10% | 10.3% | 19,269 | 19,787 |
| Active Idle | 0 | 0 | |

| Target Load | Actual Load | ssj_ops | |
|---|---|---|---|
| Target | Actual | ||
| Calibration 1 | 191,463 | ||
| Calibration 2 | 190,640 | ||
| Calibration 3 | 190,778 | ||
| ssj_ops@calibrated=190,709 | |||
| 100% | 99.9% | 190,709 | 190,539 |
| 90% | 90.1% | 171,638 | 171,849 |
| 80% | 80.1% | 152,567 | 152,726 |
| 70% | 69.5% | 133,496 | 132,501 |
| 60% | 60.8% | 114,425 | 115,863 |
| 50% | 50.0% | 95,354 | 95,369 |
| 40% | 39.8% | 76,284 | 75,835 |
| 30% | 29.9% | 57,213 | 56,938 |
| 20% | 19.8% | 38,142 | 37,744 |
| 10% | 10.1% | 19,071 | 19,292 |
| Active Idle | 0 | 0 | |

| Target Load | Actual Load | ssj_ops | |
|---|---|---|---|
| Target | Actual | ||
| Calibration 1 | 193,127 | ||
| Calibration 2 | 193,092 | ||
| Calibration 3 | 193,442 | ||
| ssj_ops@calibrated=193,267 | |||
| 100% | 100.1% | 193,267 | 193,391 |
| 90% | 89.7% | 173,941 | 173,446 |
| 80% | 79.7% | 154,614 | 153,970 |
| 70% | 69.8% | 135,287 | 134,883 |
| 60% | 60.7% | 115,960 | 117,252 |
| 50% | 50.2% | 96,634 | 97,024 |
| 40% | 39.8% | 77,307 | 76,836 |
| 30% | 30.1% | 57,980 | 58,196 |
| 20% | 20.0% | 38,653 | 38,742 |
| 10% | 9.9% | 19,327 | 19,037 |
| Active Idle | 0 | 0 | |

| Target Load | Actual Load | ssj_ops | |
|---|---|---|---|
| Target | Actual | ||
| Calibration 1 | 192,255 | ||
| Calibration 2 | 193,409 | ||
| Calibration 3 | 193,520 | ||
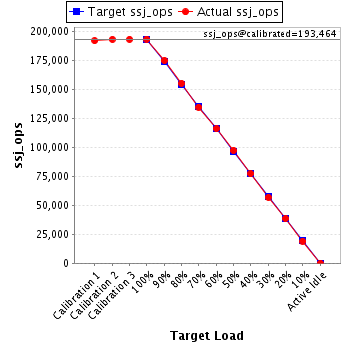
| ssj_ops@calibrated=193,464 | |||
| 100% | 100.1% | 193,464 | 193,589 |
| 90% | 90.6% | 174,118 | 175,198 |
| 80% | 80.4% | 154,772 | 155,550 |
| 70% | 69.7% | 135,425 | 134,888 |
| 60% | 60.1% | 116,079 | 116,349 |
| 50% | 50.4% | 96,732 | 97,482 |
| 40% | 40.0% | 77,386 | 77,311 |
| 30% | 29.4% | 58,039 | 56,904 |
| 20% | 20.0% | 38,693 | 38,615 |
| 10% | 9.9% | 19,346 | 19,142 |
| Active Idle | 0 | 0 | |
| Target Load | Actual Load | ssj_ops | |
|---|---|---|---|
| Target | Actual | ||
| Calibration 1 | 193,162 | ||
| Calibration 2 | 191,513 | ||
| Calibration 3 | 191,869 | ||
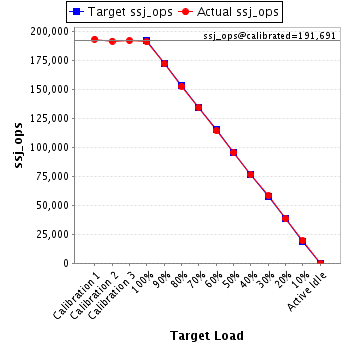
| ssj_ops@calibrated=191,691 | |||
| 100% | 99.6% | 191,691 | 190,867 |
| 90% | 89.7% | 172,522 | 171,858 |
| 80% | 79.6% | 153,353 | 152,631 |
| 70% | 70.0% | 134,184 | 134,259 |
| 60% | 59.7% | 115,015 | 114,353 |
| 50% | 49.8% | 95,845 | 95,418 |
| 40% | 39.7% | 76,676 | 76,189 |
| 30% | 30.3% | 57,507 | 58,047 |
| 20% | 20.0% | 38,338 | 38,259 |
| 10% | 10.0% | 19,169 | 19,212 |
| Active Idle | 0 | 0 | |
| Target Load | Actual Load | ssj_ops | |
|---|---|---|---|
| Target | Actual | ||
| Calibration 1 | 191,992 | ||
| Calibration 2 | 190,961 | ||
| Calibration 3 | 190,682 | ||
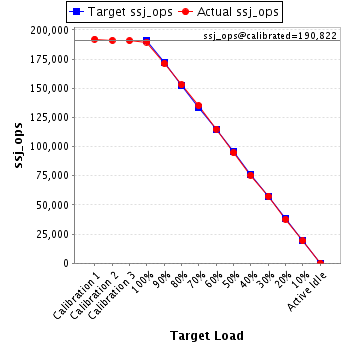
| ssj_ops@calibrated=190,822 | |||
| 100% | 99.3% | 190,822 | 189,552 |
| 90% | 89.7% | 171,739 | 171,098 |
| 80% | 80.1% | 152,657 | 152,811 |
| 70% | 70.8% | 133,575 | 135,079 |
| 60% | 60.3% | 114,493 | 115,013 |
| 50% | 49.6% | 95,411 | 94,726 |
| 40% | 39.5% | 76,329 | 75,422 |
| 30% | 30.1% | 57,246 | 57,423 |
| 20% | 19.8% | 38,164 | 37,712 |
| 10% | 10.0% | 19,082 | 19,146 |
| Active Idle | 0 | 0 | |
| Target Load | Actual Load | ssj_ops | |
|---|---|---|---|
| Target | Actual | ||
| Calibration 1 | 191,775 | ||
| Calibration 2 | 191,386 | ||
| Calibration 3 | 191,939 | ||
| ssj_ops@calibrated=191,662 | |||
| 100% | 99.3% | 191,662 | 190,240 |
| 90% | 90.9% | 172,496 | 174,300 |
| 80% | 79.3% | 153,330 | 152,071 |
| 70% | 69.4% | 134,164 | 133,069 |
| 60% | 60.0% | 114,997 | 114,914 |
| 50% | 50.0% | 95,831 | 95,749 |
| 40% | 40.4% | 76,665 | 77,487 |
| 30% | 29.8% | 57,499 | 57,131 |
| 20% | 20.3% | 38,332 | 38,867 |
| 10% | 10.0% | 19,166 | 19,183 |
| Active Idle | 0 | 0 | |

| Target Load | Actual Load | ssj_ops | |
|---|---|---|---|
| Target | Actual | ||
| Calibration 1 | 190,431 | ||
| Calibration 2 | 190,331 | ||
| Calibration 3 | 190,363 | ||
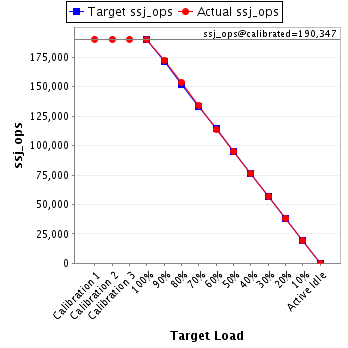
| ssj_ops@calibrated=190,347 | |||
| 100% | 99.8% | 190,347 | 189,880 |
| 90% | 90.5% | 171,312 | 172,239 |
| 80% | 80.6% | 152,277 | 153,503 |
| 70% | 70.3% | 133,243 | 133,756 |
| 60% | 59.8% | 114,208 | 113,738 |
| 50% | 50.0% | 95,173 | 95,114 |
| 40% | 40.2% | 76,139 | 76,463 |
| 30% | 29.9% | 57,104 | 56,992 |
| 20% | 20.1% | 38,069 | 38,353 |
| 10% | 10.1% | 19,035 | 19,221 |
| Active Idle | 0 | 0 | |
| Target Load | Actual Load | ssj_ops | |
|---|---|---|---|
| Target | Actual | ||
| Calibration 1 | 195,067 | ||
| Calibration 2 | 195,134 | ||
| Calibration 3 | 195,679 | ||
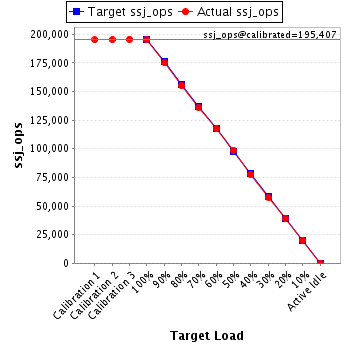
| ssj_ops@calibrated=195,407 | |||
| 100% | 99.8% | 195,407 | 195,065 |
| 90% | 89.7% | 175,866 | 175,208 |
| 80% | 79.3% | 156,325 | 155,009 |
| 70% | 69.7% | 136,785 | 136,296 |
| 60% | 60.2% | 117,244 | 117,609 |
| 50% | 50.4% | 97,703 | 98,518 |
| 40% | 39.8% | 78,163 | 77,769 |
| 30% | 29.5% | 58,622 | 57,646 |
| 20% | 20.1% | 39,081 | 39,246 |
| 10% | 10.3% | 19,541 | 20,150 |
| Active Idle | 0 | 0 | |
| Target Load | Actual Load | ssj_ops | |
|---|---|---|---|
| Target | Actual | ||
| Calibration 1 | 188,920 | ||
| Calibration 2 | 187,240 | ||
| Calibration 3 | 188,226 | ||
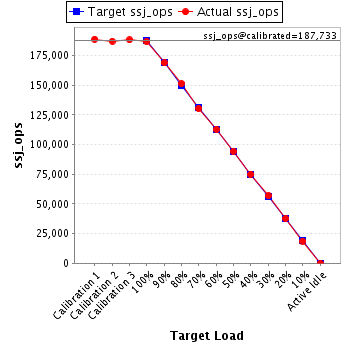
| ssj_ops@calibrated=187,733 | |||
| 100% | 99.6% | 187,733 | 186,981 |
| 90% | 90.0% | 168,960 | 168,946 |
| 80% | 80.6% | 150,186 | 151,354 |
| 70% | 69.5% | 131,413 | 130,519 |
| 60% | 60.2% | 112,640 | 112,993 |
| 50% | 50.3% | 93,866 | 94,491 |
| 40% | 40.0% | 75,093 | 75,001 |
| 30% | 30.3% | 56,320 | 56,822 |
| 20% | 20.1% | 37,547 | 37,761 |
| 10% | 10.0% | 18,773 | 18,739 |
| Active Idle | 0 | 0 | |
| Target Load | Actual Load | ssj_ops | |
|---|---|---|---|
| Target | Actual | ||
| Calibration 1 | 190,553 | ||
| Calibration 2 | 189,935 | ||
| Calibration 3 | 190,719 | ||
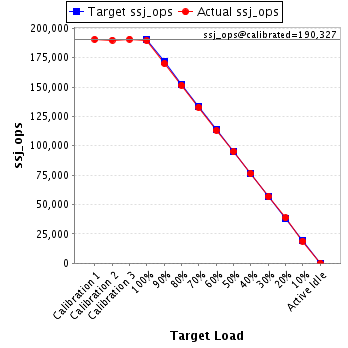
| ssj_ops@calibrated=190,327 | |||
| 100% | 99.5% | 190,327 | 189,465 |
| 90% | 89.3% | 171,294 | 170,009 |
| 80% | 79.6% | 152,262 | 151,439 |
| 70% | 69.8% | 133,229 | 132,816 |
| 60% | 59.4% | 114,196 | 113,084 |
| 50% | 49.9% | 95,164 | 95,053 |
| 40% | 40.1% | 76,131 | 76,271 |
| 30% | 29.8% | 57,098 | 56,725 |
| 20% | 20.3% | 38,065 | 38,605 |
| 10% | 9.9% | 19,033 | 18,887 |
| Active Idle | 0 | 0 | |
| Target Load | Actual Load | ssj_ops | |
|---|---|---|---|
| Target | Actual | ||
| Calibration 1 | 194,260 | ||
| Calibration 2 | 194,498 | ||
| Calibration 3 | 194,885 | ||
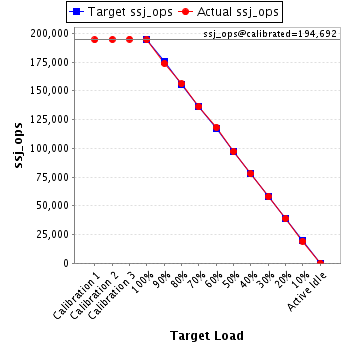
| ssj_ops@calibrated=194,692 | |||
| 100% | 99.8% | 194,692 | 194,263 |
| 90% | 89.3% | 175,222 | 173,886 |
| 80% | 80.2% | 155,753 | 156,049 |
| 70% | 70.0% | 136,284 | 136,251 |
| 60% | 60.7% | 116,815 | 118,182 |
| 50% | 49.9% | 97,346 | 97,182 |
| 40% | 39.9% | 77,877 | 77,742 |
| 30% | 29.8% | 58,407 | 57,933 |
| 20% | 19.9% | 38,938 | 38,779 |
| 10% | 9.8% | 19,469 | 19,137 |
| Active Idle | 0 | 0 | |
| Target Load | Actual Load | ssj_ops | |
|---|---|---|---|
| Target | Actual | ||
| Calibration 1 | 192,827 | ||
| Calibration 2 | 193,043 | ||
| Calibration 3 | 193,025 | ||
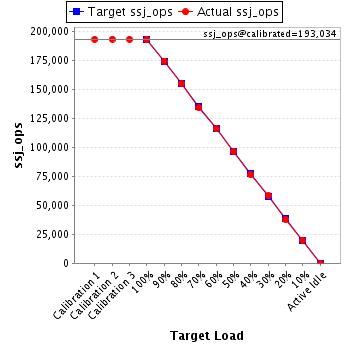
| ssj_ops@calibrated=193,034 | |||
| 100% | 100.0% | 193,034 | 192,959 |
| 90% | 90.2% | 173,731 | 174,208 |
| 80% | 80.0% | 154,427 | 154,494 |
| 70% | 69.4% | 135,124 | 133,944 |
| 60% | 60.0% | 115,820 | 115,913 |
| 50% | 50.0% | 96,517 | 96,535 |
| 40% | 39.6% | 77,214 | 76,474 |
| 30% | 30.1% | 57,910 | 58,116 |
| 20% | 19.7% | 38,607 | 37,946 |
| 10% | 10.2% | 19,303 | 19,783 |
| Active Idle | 0 | 0 | |
| Target Load | Actual Load | ssj_ops | |
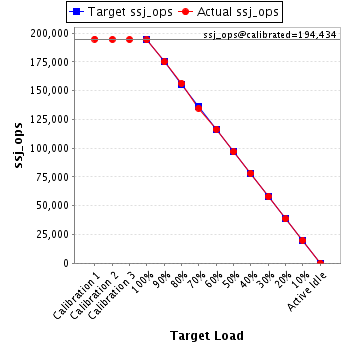
|---|---|---|---|
| Target | Actual | ||
| Calibration 1 | 194,749 | ||
| Calibration 2 | 194,507 | ||
| Calibration 3 | 194,361 | ||
| ssj_ops@calibrated=194,434 | |||
| 100% | 99.8% | 194,434 | 194,050 |
| 90% | 90.0% | 174,991 | 174,986 |
| 80% | 80.4% | 155,547 | 156,341 |
| 70% | 69.3% | 136,104 | 134,718 |
| 60% | 59.9% | 116,661 | 116,509 |
| 50% | 49.8% | 97,217 | 96,777 |
| 40% | 40.2% | 77,774 | 78,104 |
| 30% | 29.8% | 58,330 | 57,940 |
| 20% | 19.8% | 38,887 | 38,509 |
| 10% | 10.2% | 19,443 | 19,836 |
| Active Idle | 0 | 0 | |