
SPECpower_ssj2008
Host 'node5' Performance Report
Copyright © 2007-2020 Standard Performance Evaluation Corporation
| ASUSTeK Computer Inc. RS620SA-E10-RS12 | ssj_ops@100% = 6,087,804 ssj_ops@100% per JVM = 190,244 |
||||
| Test Sponsor: | ASUSTeK Computer Inc. | SPEC License #: | 9016 | Test Method: | Multi Node |
| Tested By: | ASUSTeK Computer Inc. | Test Location: | Taipei, Taiwan. | Test Date: | Sep 18, 2020 |
| Hardware Availability: | Sep-2020 | Software Availability: | Jul-2020 | Publication: | Oct 7, 2020 |
| System Source: | Single Supplier | System Designation: | Server | Power Provisioning: | Line-powered |
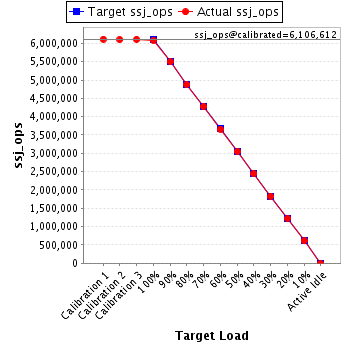
| Target Load | Actual Load | ssj_ops | |
|---|---|---|---|
| Target | Actual | ||
| Calibration 1 | 6,114,430 | ||
| Calibration 2 | 6,102,625 | ||
| Calibration 3 | 6,110,600 | ||
| ssj_ops@calibrated=6,106,612 | |||
| 100% | 99.7% | 6,106,612 | 6,087,804 |
| 90% | 90.0% | 5,495,951 | 5,498,232 |
| 80% | 79.8% | 4,885,290 | 4,875,313 |
| 70% | 70.0% | 4,274,628 | 4,275,998 |
| 60% | 60.0% | 3,663,967 | 3,661,703 |
| 50% | 50.0% | 3,053,306 | 3,051,913 |
| 40% | 40.0% | 2,442,645 | 2,442,253 |
| 30% | 30.0% | 1,831,984 | 1,832,345 |
| 20% | 20.0% | 1,221,322 | 1,220,535 |
| 10% | 10.0% | 610,661 | 611,659 |
| Active Idle | 0 | 0 | |
| Set Identifier: | RS620SA-E10-RS12 |
| Set Description: | System Under Test |
| # of Identical Nodes: | 6 |
| Comment: | 'SUT' |
| Hardware | |
|---|---|
| Hardware Vendor: | ASUSTeK Computer Inc. |
| Model: | RS620SA-E10-RS12 |
| Form Factor: | 1U |
| CPU Name: | AMD EPYC 7742 2.25Ghz |
| CPU Characteristics: | 64-Core, 2.25GHz, 256MB L3 Cache |
| CPU Frequency (MHz): | 2250 |
| CPU(s) Enabled: | 64 cores, 1 chip, 64 cores/chip |
| Hardware Threads: | 128 (2 / core) |
| CPU(s) Orderable: | 1 chip |
| Primary Cache: | 32 KB I + 32 KB D on chip per core |
| Secondary Cache: | 512 KB I+D on chip per core |
| Tertiary Cache: | 256 MB I+D on chip per chip, 16 MB shared / 4 cores |
| Other Cache: | None |
| Memory Amount (GB): | 128 |
| # and size of DIMM: | 8 x 16 GB |
| Memory Details: | 8 x 16GB 2Rx8 PC4-3200AA-R ECC RDIMM; all slots populated |
| Power Supply Quantity and Rating (W): | None |
| Power Supply Details: | Shared |
| Disk Drive: | 1 x 240GB Seagate Nytro 510DCT M.2 PCIE SSD P/N: 03B03-00130200 |
| Disk Controller: | Integrated PCIE controller |
| # and type of Network Interface Cards (NICs) Installed: | 1 x Intel I210 Gigabit Ethernet controller |
| NICs Enabled in Firmware / OS / Connected: | 1/1/1 |
| Network Speed (Mbit): | 1000 |
| Keyboard: | None |
| Mouse: | None |
| Monitor: | None |
| Optical Drives: | No |
| Other Hardware: | None |
| Software | |
|---|---|
| Power Management: | Enabled(See SUT Notes) |
| Operating System (OS): | Suse Linux Enterprise Server 15 SP1 |
| OS Version: | 4.12.14-195-default |
| Filesystem: | xfs |
| JVM Vendor: | Oracle |
| JVM Version: | Java HotSpot(TM) 64-Bit Server VM (build 14.0.2+12-46, mixed mode, sharing), version 14.0.2 |
| JVM Command-line Options: | -server -Xmn1200m -Xms1400m -Xmx1400m -XX:MaxTenuringThreshold=1 -XX:ParallelGCThreads=2 -XX:InlineSmallCode=4000 -XX:MaxInlineSize=300 -XX:FreqInlineSize=3000 -XX:+UseParallelGC -XX:+UseLargePages -XX:+UseHugeTLBFS -XX:+UseTransparentHugePages |
| JVM Affinity: | for each two physicalCores { numactl -C physicalCoreId, physicalCoreId + 1, physicalCoreId + 64, physicalCoreId + 65 -l } |
| JVM Instances: | 32 |
| JVM Initial Heap (MB): | 1400 |
| JVM Maximum Heap (MB): | 1400 |
| JVM Address Bits: | 64 |
| Boot Firmware Version: | 0305 |
| Management Firmware Version: | 2.1.09 |
| Workload Version: | SSJ 1.2.10 |
| Director Location: | Controller |
| Other Software: | None |
| JVM Instance | ssj_ops@100% |
|---|---|
| node5.001 | 192,329 |
| node5.002 | 193,992 |
| node5.003 | 195,332 |
| node5.004 | 192,133 |
| node5.005 | 193,691 |
| node5.006 | 195,045 |
| node5.007 | 194,757 |
| node5.008 | 192,778 |
| node5.009 | 194,603 |
| node5.010 | 189,547 |
| node5.011 | 189,153 |
| node5.012 | 196,482 |
| node5.013 | 188,580 |
| node5.014 | 190,856 |
| node5.015 | 189,546 |
| node5.016 | 188,092 |
| node5.017 | 187,936 |
| node5.018 | 187,640 |
| node5.019 | 190,911 |
| node5.020 | 194,946 |
| node5.021 | 187,186 |
| node5.022 | 193,802 |
| node5.023 | 192,401 |
| node5.024 | 191,685 |
| node5.025 | 192,915 |
| node5.026 | 188,035 |
| node5.027 | 190,552 |
| node5.028 | 193,258 |
| node5.029 | 198,307 |
| node5.030 | 190,423 |
| node5.031 | 167,314 |
| node5.032 | 163,580 |
| ssj_ops@100% | 6,087,804 |
| ssj_ops@100% per JVM | 190,244 |

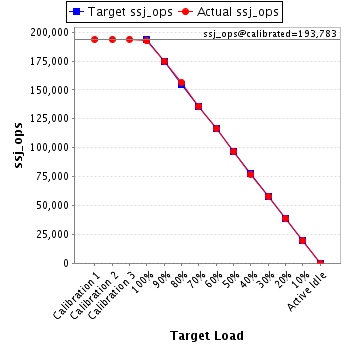
| Target Load | Actual Load | ssj_ops | |
|---|---|---|---|
| Target | Actual | ||
| Calibration 1 | 193,676 | ||
| Calibration 2 | 193,669 | ||
| Calibration 3 | 193,896 | ||
| ssj_ops@calibrated=193,783 | |||
| 100% | 99.3% | 193,783 | 192,329 |
| 90% | 90.3% | 174,404 | 174,950 |
| 80% | 80.7% | 155,026 | 156,343 |
| 70% | 70.2% | 135,648 | 136,052 |
| 60% | 60.2% | 116,270 | 116,597 |
| 50% | 49.8% | 96,891 | 96,568 |
| 40% | 39.8% | 77,513 | 77,188 |
| 30% | 29.8% | 58,135 | 57,830 |
| 20% | 20.0% | 38,757 | 38,669 |
| 10% | 10.0% | 19,378 | 19,347 |
| Active Idle | 0 | 0 | |
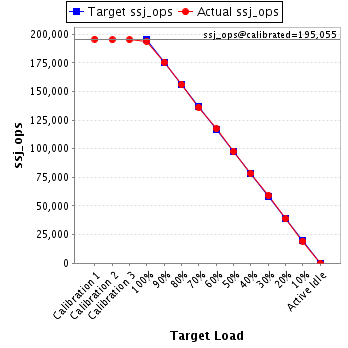
| Target Load | Actual Load | ssj_ops | |
|---|---|---|---|
| Target | Actual | ||
| Calibration 1 | 195,664 | ||
| Calibration 2 | 195,058 | ||
| Calibration 3 | 195,053 | ||
| ssj_ops@calibrated=195,055 | |||
| 100% | 99.5% | 195,055 | 193,992 |
| 90% | 90.0% | 175,550 | 175,592 |
| 80% | 79.9% | 156,044 | 155,835 |
| 70% | 69.9% | 136,539 | 136,267 |
| 60% | 60.2% | 117,033 | 117,452 |
| 50% | 50.1% | 97,528 | 97,750 |
| 40% | 40.2% | 78,022 | 78,336 |
| 30% | 30.2% | 58,517 | 58,948 |
| 20% | 19.9% | 39,011 | 38,742 |
| 10% | 10.0% | 19,506 | 19,429 |
| Active Idle | 0 | 0 | |
| Target Load | Actual Load | ssj_ops | |
|---|---|---|---|
| Target | Actual | ||
| Calibration 1 | 195,418 | ||
| Calibration 2 | 196,441 | ||
| Calibration 3 | 196,489 | ||
| ssj_ops@calibrated=196,465 | |||
| 100% | 99.4% | 196,465 | 195,332 |
| 90% | 89.9% | 176,819 | 176,600 |
| 80% | 79.2% | 157,172 | 155,527 |
| 70% | 70.0% | 137,526 | 137,472 |
| 60% | 60.1% | 117,879 | 117,980 |
| 50% | 49.4% | 98,233 | 97,141 |
| 40% | 39.9% | 78,586 | 78,371 |
| 30% | 29.9% | 58,940 | 58,809 |
| 20% | 19.7% | 39,293 | 38,771 |
| 10% | 10.1% | 19,647 | 19,833 |
| Active Idle | 0 | 0 | |

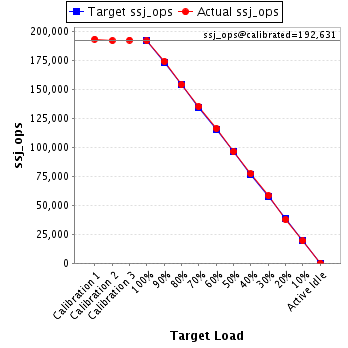
| Target Load | Actual Load | ssj_ops | |
|---|---|---|---|
| Target | Actual | ||
| Calibration 1 | 193,610 | ||
| Calibration 2 | 192,372 | ||
| Calibration 3 | 192,889 | ||
| ssj_ops@calibrated=192,631 | |||
| 100% | 99.7% | 192,631 | 192,133 |
| 90% | 90.5% | 173,368 | 174,384 |
| 80% | 80.1% | 154,105 | 154,217 |
| 70% | 70.3% | 134,841 | 135,451 |
| 60% | 60.5% | 115,578 | 116,476 |
| 50% | 50.1% | 96,315 | 96,501 |
| 40% | 40.1% | 77,052 | 77,217 |
| 30% | 30.3% | 57,789 | 58,313 |
| 20% | 19.6% | 38,526 | 37,714 |
| 10% | 10.1% | 19,263 | 19,380 |
| Active Idle | 0 | 0 | |
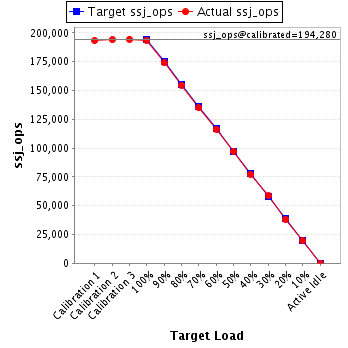
| Target Load | Actual Load | ssj_ops | |
|---|---|---|---|
| Target | Actual | ||
| Calibration 1 | 193,322 | ||
| Calibration 2 | 194,053 | ||
| Calibration 3 | 194,507 | ||
| ssj_ops@calibrated=194,280 | |||
| 100% | 99.7% | 194,280 | 193,691 |
| 90% | 89.5% | 174,852 | 173,825 |
| 80% | 79.6% | 155,424 | 154,594 |
| 70% | 69.4% | 135,996 | 134,873 |
| 60% | 59.9% | 116,568 | 116,277 |
| 50% | 50.1% | 97,140 | 97,310 |
| 40% | 39.8% | 77,712 | 77,393 |
| 30% | 30.1% | 58,284 | 58,488 |
| 20% | 19.7% | 38,856 | 38,359 |
| 10% | 10.0% | 19,428 | 19,508 |
| Active Idle | 0 | 0 | |
| Target Load | Actual Load | ssj_ops | |
|---|---|---|---|
| Target | Actual | ||
| Calibration 1 | 195,892 | ||
| Calibration 2 | 195,614 | ||
| Calibration 3 | 195,635 | ||
| ssj_ops@calibrated=195,624 | |||
| 100% | 99.7% | 195,624 | 195,045 |
| 90% | 89.8% | 176,062 | 175,696 |
| 80% | 79.8% | 156,499 | 156,141 |
| 70% | 69.9% | 136,937 | 136,671 |
| 60% | 59.5% | 117,375 | 116,478 |
| 50% | 49.6% | 97,812 | 97,094 |
| 40% | 40.5% | 78,250 | 79,194 |
| 30% | 29.7% | 58,687 | 58,183 |
| 20% | 20.1% | 39,125 | 39,298 |
| 10% | 10.0% | 19,562 | 19,537 |
| Active Idle | 0 | 0 | |

| Target Load | Actual Load | ssj_ops | |
|---|---|---|---|
| Target | Actual | ||
| Calibration 1 | 194,425 | ||
| Calibration 2 | 195,347 | ||
| Calibration 3 | 195,856 | ||
| ssj_ops@calibrated=195,601 | |||
| 100% | 99.6% | 195,601 | 194,757 |
| 90% | 90.1% | 176,041 | 176,163 |
| 80% | 80.0% | 156,481 | 156,432 |
| 70% | 70.0% | 136,921 | 136,823 |
| 60% | 59.9% | 117,361 | 117,118 |
| 50% | 49.3% | 97,801 | 96,465 |
| 40% | 40.1% | 78,240 | 78,509 |
| 30% | 30.2% | 58,680 | 59,124 |
| 20% | 19.9% | 39,120 | 38,929 |
| 10% | 9.8% | 19,560 | 19,229 |
| Active Idle | 0 | 0 | |

| Target Load | Actual Load | ssj_ops | |
|---|---|---|---|
| Target | Actual | ||
| Calibration 1 | 193,765 | ||
| Calibration 2 | 193,228 | ||
| Calibration 3 | 192,799 | ||
| ssj_ops@calibrated=193,013 | |||
| 100% | 99.9% | 193,013 | 192,778 |
| 90% | 90.6% | 173,712 | 174,873 |
| 80% | 80.0% | 154,411 | 154,402 |
| 70% | 69.9% | 135,109 | 134,836 |
| 60% | 59.9% | 115,808 | 115,596 |
| 50% | 49.7% | 96,507 | 95,943 |
| 40% | 40.3% | 77,205 | 77,718 |
| 30% | 30.4% | 57,904 | 58,696 |
| 20% | 20.1% | 38,603 | 38,846 |
| 10% | 10.1% | 19,301 | 19,434 |
| Active Idle | 0 | 0 | |

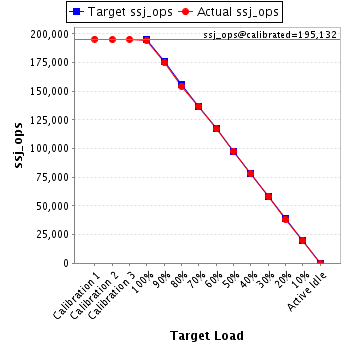
| Target Load | Actual Load | ssj_ops | |
|---|---|---|---|
| Target | Actual | ||
| Calibration 1 | 195,401 | ||
| Calibration 2 | 194,934 | ||
| Calibration 3 | 195,330 | ||
| ssj_ops@calibrated=195,132 | |||
| 100% | 99.7% | 195,132 | 194,603 |
| 90% | 89.7% | 175,619 | 175,057 |
| 80% | 79.1% | 156,105 | 154,444 |
| 70% | 70.2% | 136,592 | 136,901 |
| 60% | 60.1% | 117,079 | 117,239 |
| 50% | 50.1% | 97,566 | 97,821 |
| 40% | 39.9% | 78,053 | 77,916 |
| 30% | 29.8% | 58,540 | 58,200 |
| 20% | 19.7% | 39,026 | 38,477 |
| 10% | 10.1% | 19,513 | 19,757 |
| Active Idle | 0 | 0 | |
| Target Load | Actual Load | ssj_ops | |
|---|---|---|---|
| Target | Actual | ||
| Calibration 1 | 189,394 | ||
| Calibration 2 | 189,393 | ||
| Calibration 3 | 189,528 | ||
| ssj_ops@calibrated=189,461 | |||
| 100% | 100.0% | 189,461 | 189,547 |
| 90% | 90.2% | 170,515 | 170,981 |
| 80% | 79.5% | 151,569 | 150,578 |
| 70% | 70.7% | 132,623 | 133,909 |
| 60% | 59.7% | 113,676 | 113,108 |
| 50% | 50.1% | 94,730 | 94,902 |
| 40% | 39.9% | 75,784 | 75,572 |
| 30% | 29.6% | 56,838 | 56,026 |
| 20% | 20.1% | 37,892 | 38,174 |
| 10% | 10.1% | 18,946 | 19,112 |
| Active Idle | 0 | 0 | |

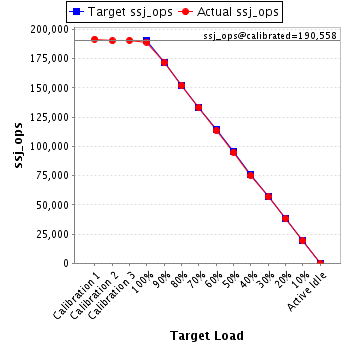
| Target Load | Actual Load | ssj_ops | |
|---|---|---|---|
| Target | Actual | ||
| Calibration 1 | 191,713 | ||
| Calibration 2 | 190,307 | ||
| Calibration 3 | 190,810 | ||
| ssj_ops@calibrated=190,558 | |||
| 100% | 99.3% | 190,558 | 189,153 |
| 90% | 90.1% | 171,503 | 171,777 |
| 80% | 79.8% | 152,447 | 152,141 |
| 70% | 69.9% | 133,391 | 133,247 |
| 60% | 59.5% | 114,335 | 113,461 |
| 50% | 49.8% | 95,279 | 94,850 |
| 40% | 39.3% | 76,223 | 74,964 |
| 30% | 29.8% | 57,168 | 56,812 |
| 20% | 19.9% | 38,112 | 37,984 |
| 10% | 10.0% | 19,056 | 19,125 |
| Active Idle | 0 | 0 | |
| Target Load | Actual Load | ssj_ops | |
|---|---|---|---|
| Target | Actual | ||
| Calibration 1 | 197,363 | ||
| Calibration 2 | 197,107 | ||
| Calibration 3 | 197,192 | ||
| ssj_ops@calibrated=197,149 | |||
| 100% | 99.7% | 197,149 | 196,482 |
| 90% | 89.5% | 177,434 | 176,425 |
| 80% | 79.2% | 157,720 | 156,155 |
| 70% | 70.3% | 138,005 | 138,501 |
| 60% | 59.8% | 118,290 | 117,833 |
| 50% | 50.3% | 98,575 | 99,115 |
| 40% | 40.1% | 78,860 | 79,044 |
| 30% | 30.2% | 59,145 | 59,546 |
| 20% | 20.0% | 39,430 | 39,377 |
| 10% | 10.0% | 19,715 | 19,704 |
| Active Idle | 0 | 0 | |

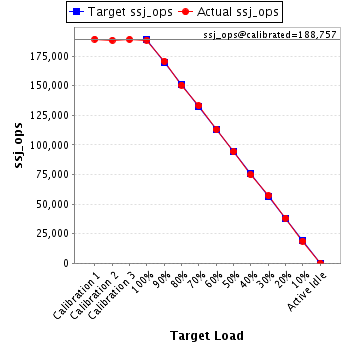
| Target Load | Actual Load | ssj_ops | |
|---|---|---|---|
| Target | Actual | ||
| Calibration 1 | 189,291 | ||
| Calibration 2 | 188,413 | ||
| Calibration 3 | 189,101 | ||
| ssj_ops@calibrated=188,757 | |||
| 100% | 99.9% | 188,757 | 188,580 |
| 90% | 90.4% | 169,881 | 170,656 |
| 80% | 79.8% | 151,006 | 150,538 |
| 70% | 70.5% | 132,130 | 133,084 |
| 60% | 59.9% | 113,254 | 113,129 |
| 50% | 50.0% | 94,378 | 94,345 |
| 40% | 39.6% | 75,503 | 74,708 |
| 30% | 30.2% | 56,627 | 57,066 |
| 20% | 20.3% | 37,751 | 38,229 |
| 10% | 10.0% | 18,876 | 18,783 |
| Active Idle | 0 | 0 | |
| Target Load | Actual Load | ssj_ops | |
|---|---|---|---|
| Target | Actual | ||
| Calibration 1 | 191,947 | ||
| Calibration 2 | 190,205 | ||
| Calibration 3 | 190,822 | ||
| ssj_ops@calibrated=190,513 | |||
| 100% | 100.2% | 190,513 | 190,856 |
| 90% | 90.1% | 171,462 | 171,578 |
| 80% | 79.6% | 152,411 | 151,686 |
| 70% | 70.0% | 133,359 | 133,313 |
| 60% | 59.8% | 114,308 | 113,995 |
| 50% | 50.4% | 95,257 | 96,072 |
| 40% | 40.2% | 76,205 | 76,578 |
| 30% | 30.4% | 57,154 | 57,961 |
| 20% | 20.1% | 38,103 | 38,210 |
| 10% | 9.9% | 19,051 | 18,908 |
| Active Idle | 0 | 0 | |
| Target Load | Actual Load | ssj_ops | |
|---|---|---|---|
| Target | Actual | ||
| Calibration 1 | 190,387 | ||
| Calibration 2 | 189,819 | ||
| Calibration 3 | 190,098 | ||
| ssj_ops@calibrated=189,958 | |||
| 100% | 99.8% | 189,958 | 189,546 |
| 90% | 90.3% | 170,962 | 171,509 |
| 80% | 80.2% | 151,967 | 152,293 |
| 70% | 70.2% | 132,971 | 133,438 |
| 60% | 59.6% | 113,975 | 113,302 |
| 50% | 50.3% | 94,979 | 95,504 |
| 40% | 39.7% | 75,983 | 75,396 |
| 30% | 29.9% | 56,987 | 56,796 |
| 20% | 20.0% | 37,992 | 38,075 |
| 10% | 9.9% | 18,996 | 18,823 |
| Active Idle | 0 | 0 | |
| Target Load | Actual Load | ssj_ops | |
|---|---|---|---|
| Target | Actual | ||
| Calibration 1 | 188,637 | ||
| Calibration 2 | 188,118 | ||
| Calibration 3 | 188,600 | ||
| ssj_ops@calibrated=188,359 | |||
| 100% | 99.9% | 188,359 | 188,092 |
| 90% | 89.1% | 169,523 | 167,746 |
| 80% | 80.0% | 150,688 | 150,615 |
| 70% | 69.9% | 131,852 | 131,660 |
| 60% | 59.6% | 113,016 | 112,345 |
| 50% | 50.1% | 94,180 | 94,368 |
| 40% | 40.4% | 75,344 | 76,102 |
| 30% | 30.1% | 56,508 | 56,678 |
| 20% | 19.8% | 37,672 | 37,229 |
| 10% | 10.0% | 18,836 | 18,893 |
| Active Idle | 0 | 0 | |
| Target Load | Actual Load | ssj_ops | |
|---|---|---|---|
| Target | Actual | ||
| Calibration 1 | 189,383 | ||
| Calibration 2 | 188,634 | ||
| Calibration 3 | 188,661 | ||
| ssj_ops@calibrated=188,648 | |||
| 100% | 99.6% | 188,648 | 187,936 |
| 90% | 89.9% | 169,783 | 169,580 |
| 80% | 79.9% | 150,918 | 150,654 |
| 70% | 70.5% | 132,053 | 132,946 |
| 60% | 59.7% | 113,189 | 112,706 |
| 50% | 50.4% | 94,324 | 95,041 |
| 40% | 39.8% | 75,459 | 75,075 |
| 30% | 30.3% | 56,594 | 57,159 |
| 20% | 19.8% | 37,730 | 37,262 |
| 10% | 9.8% | 18,865 | 18,492 |
| Active Idle | 0 | 0 | |
| Target Load | Actual Load | ssj_ops | |
|---|---|---|---|
| Target | Actual | ||
| Calibration 1 | 189,093 | ||
| Calibration 2 | 188,194 | ||
| Calibration 3 | 188,853 | ||
| ssj_ops@calibrated=188,524 | |||
| 100% | 99.5% | 188,524 | 187,640 |
| 90% | 90.8% | 169,671 | 171,192 |
| 80% | 80.1% | 150,819 | 151,065 |
| 70% | 69.7% | 131,966 | 131,308 |
| 60% | 59.3% | 113,114 | 111,843 |
| 50% | 50.1% | 94,262 | 94,367 |
| 40% | 40.6% | 75,409 | 76,454 |
| 30% | 29.9% | 56,557 | 56,331 |
| 20% | 19.9% | 37,705 | 37,485 |
| 10% | 9.9% | 18,852 | 18,700 |
| Active Idle | 0 | 0 | |

| Target Load | Actual Load | ssj_ops | |
|---|---|---|---|
| Target | Actual | ||
| Calibration 1 | 191,398 | ||
| Calibration 2 | 191,983 | ||
| Calibration 3 | 192,256 | ||
| ssj_ops@calibrated=192,119 | |||
| 100% | 99.4% | 192,119 | 190,911 |
| 90% | 89.2% | 172,908 | 171,344 |
| 80% | 80.1% | 153,696 | 153,952 |
| 70% | 69.6% | 134,484 | 133,785 |
| 60% | 59.9% | 115,272 | 115,151 |
| 50% | 50.3% | 96,060 | 96,546 |
| 40% | 39.8% | 76,848 | 76,432 |
| 30% | 29.8% | 57,636 | 57,272 |
| 20% | 20.3% | 38,424 | 39,030 |
| 10% | 10.0% | 19,212 | 19,211 |
| Active Idle | 0 | 0 | |

| Target Load | Actual Load | ssj_ops | |
|---|---|---|---|
| Target | Actual | ||
| Calibration 1 | 196,539 | ||
| Calibration 2 | 195,385 | ||
| Calibration 3 | 194,942 | ||
| ssj_ops@calibrated=195,164 | |||
| 100% | 99.9% | 195,164 | 194,946 |
| 90% | 90.4% | 175,647 | 176,373 |
| 80% | 79.5% | 156,131 | 155,199 |
| 70% | 70.1% | 136,614 | 136,748 |
| 60% | 59.8% | 117,098 | 116,701 |
| 50% | 49.4% | 97,582 | 96,502 |
| 40% | 39.9% | 78,065 | 77,933 |
| 30% | 29.8% | 58,549 | 58,233 |
| 20% | 20.3% | 39,033 | 39,573 |
| 10% | 10.1% | 19,516 | 19,800 |
| Active Idle | 0 | 0 | |

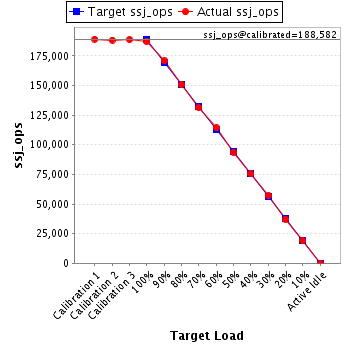
| Target Load | Actual Load | ssj_ops | |
|---|---|---|---|
| Target | Actual | ||
| Calibration 1 | 189,117 | ||
| Calibration 2 | 188,413 | ||
| Calibration 3 | 188,752 | ||
| ssj_ops@calibrated=188,582 | |||
| 100% | 99.3% | 188,582 | 187,186 |
| 90% | 90.5% | 169,724 | 170,754 |
| 80% | 79.9% | 150,866 | 150,736 |
| 70% | 69.6% | 132,008 | 131,277 |
| 60% | 60.7% | 113,149 | 114,459 |
| 50% | 49.8% | 94,291 | 93,850 |
| 40% | 40.0% | 75,433 | 75,364 |
| 30% | 30.2% | 56,575 | 56,963 |
| 20% | 19.8% | 37,716 | 37,337 |
| 10% | 10.0% | 18,858 | 18,854 |
| Active Idle | 0 | 0 | |
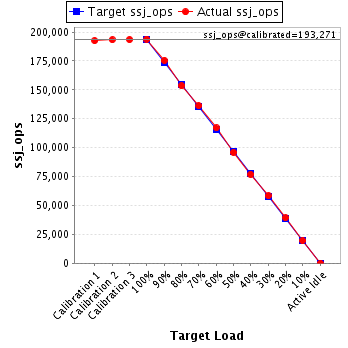
| Target Load | Actual Load | ssj_ops | |
|---|---|---|---|
| Target | Actual | ||
| Calibration 1 | 192,460 | ||
| Calibration 2 | 193,192 | ||
| Calibration 3 | 193,351 | ||
| ssj_ops@calibrated=193,271 | |||
| 100% | 100.3% | 193,271 | 193,802 |
| 90% | 90.7% | 173,944 | 175,304 |
| 80% | 79.4% | 154,617 | 153,373 |
| 70% | 70.5% | 135,290 | 136,214 |
| 60% | 60.6% | 115,963 | 117,126 |
| 50% | 49.6% | 96,636 | 95,940 |
| 40% | 39.7% | 77,309 | 76,796 |
| 30% | 30.2% | 57,981 | 58,303 |
| 20% | 20.3% | 38,654 | 39,162 |
| 10% | 10.1% | 19,327 | 19,596 |
| Active Idle | 0 | 0 | |
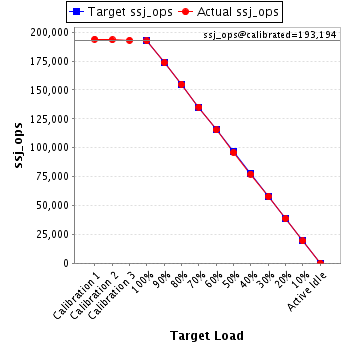
| Target Load | Actual Load | ssj_ops | |
|---|---|---|---|
| Target | Actual | ||
| Calibration 1 | 193,967 | ||
| Calibration 2 | 193,317 | ||
| Calibration 3 | 193,071 | ||
| ssj_ops@calibrated=193,194 | |||
| 100% | 99.6% | 193,194 | 192,401 |
| 90% | 89.9% | 173,875 | 173,678 |
| 80% | 80.1% | 154,555 | 154,789 |
| 70% | 70.0% | 135,236 | 135,238 |
| 60% | 59.7% | 115,916 | 115,392 |
| 50% | 49.6% | 96,597 | 95,868 |
| 40% | 40.0% | 77,278 | 77,223 |
| 30% | 29.9% | 57,958 | 57,756 |
| 20% | 20.0% | 38,639 | 38,584 |
| 10% | 10.0% | 19,319 | 19,292 |
| Active Idle | 0 | 0 | |
| Target Load | Actual Load | ssj_ops | |
|---|---|---|---|
| Target | Actual | ||
| Calibration 1 | 190,734 | ||
| Calibration 2 | 191,793 | ||
| Calibration 3 | 192,164 | ||
| ssj_ops@calibrated=191,979 | |||
| 100% | 99.8% | 191,979 | 191,685 |
| 90% | 89.7% | 172,781 | 172,135 |
| 80% | 79.8% | 153,583 | 153,132 |
| 70% | 69.8% | 134,385 | 133,907 |
| 60% | 60.5% | 115,187 | 116,105 |
| 50% | 50.4% | 95,989 | 96,710 |
| 40% | 39.7% | 76,791 | 76,275 |
| 30% | 29.6% | 57,594 | 56,854 |
| 20% | 20.1% | 38,396 | 38,620 |
| 10% | 10.2% | 19,198 | 19,488 |
| Active Idle | 0 | 0 | |

| Target Load | Actual Load | ssj_ops | |
|---|---|---|---|
| Target | Actual | ||
| Calibration 1 | 194,532 | ||
| Calibration 2 | 193,998 | ||
| Calibration 3 | 194,012 | ||
| ssj_ops@calibrated=194,005 | |||
| 100% | 99.4% | 194,005 | 192,915 |
| 90% | 91.1% | 174,604 | 176,653 |
| 80% | 80.6% | 155,204 | 156,436 |
| 70% | 70.0% | 135,803 | 135,883 |
| 60% | 60.0% | 116,403 | 116,491 |
| 50% | 49.8% | 97,002 | 96,682 |
| 40% | 40.1% | 77,602 | 77,746 |
| 30% | 29.9% | 58,201 | 57,928 |
| 20% | 20.1% | 38,801 | 38,933 |
| 10% | 9.8% | 19,400 | 18,948 |
| Active Idle | 0 | 0 | |

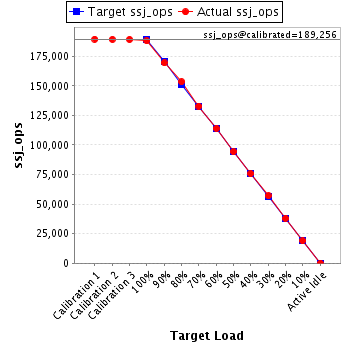
| Target Load | Actual Load | ssj_ops | |
|---|---|---|---|
| Target | Actual | ||
| Calibration 1 | 189,484 | ||
| Calibration 2 | 189,332 | ||
| Calibration 3 | 189,180 | ||
| ssj_ops@calibrated=189,256 | |||
| 100% | 99.4% | 189,256 | 188,035 |
| 90% | 89.5% | 170,331 | 169,430 |
| 80% | 81.0% | 151,405 | 153,320 |
| 70% | 70.2% | 132,479 | 132,872 |
| 60% | 60.3% | 113,554 | 114,069 |
| 50% | 49.8% | 94,628 | 94,328 |
| 40% | 40.0% | 75,702 | 75,724 |
| 30% | 30.1% | 56,777 | 56,992 |
| 20% | 20.1% | 37,851 | 38,104 |
| 10% | 10.0% | 18,926 | 18,958 |
| Active Idle | 0 | 0 | |
| Target Load | Actual Load | ssj_ops | |
|---|---|---|---|
| Target | Actual | ||
| Calibration 1 | 191,984 | ||
| Calibration 2 | 190,338 | ||
| Calibration 3 | 190,562 | ||
| ssj_ops@calibrated=190,450 | |||
| 100% | 100.1% | 190,450 | 190,552 |
| 90% | 89.9% | 171,405 | 171,179 |
| 80% | 79.4% | 152,360 | 151,147 |
| 70% | 70.2% | 133,315 | 133,701 |
| 60% | 59.9% | 114,270 | 114,135 |
| 50% | 50.4% | 95,225 | 95,971 |
| 40% | 39.7% | 76,180 | 75,651 |
| 30% | 30.2% | 57,135 | 57,545 |
| 20% | 19.8% | 38,090 | 37,617 |
| 10% | 9.8% | 19,045 | 18,708 |
| Active Idle | 0 | 0 | |

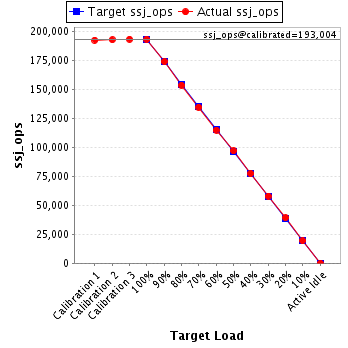
| Target Load | Actual Load | ssj_ops | |
|---|---|---|---|
| Target | Actual | ||
| Calibration 1 | 192,569 | ||
| Calibration 2 | 192,721 | ||
| Calibration 3 | 193,287 | ||
| ssj_ops@calibrated=193,004 | |||
| 100% | 100.1% | 193,004 | 193,258 |
| 90% | 90.1% | 173,704 | 173,941 |
| 80% | 79.6% | 154,403 | 153,637 |
| 70% | 69.8% | 135,103 | 134,672 |
| 60% | 59.5% | 115,802 | 114,905 |
| 50% | 50.2% | 96,502 | 96,881 |
| 40% | 40.1% | 77,202 | 77,412 |
| 30% | 30.0% | 57,901 | 57,990 |
| 20% | 20.3% | 38,601 | 39,113 |
| 10% | 10.1% | 19,300 | 19,429 |
| Active Idle | 0 | 0 | |
| Target Load | Actual Load | ssj_ops | |
|---|---|---|---|
| Target | Actual | ||
| Calibration 1 | 198,819 | ||
| Calibration 2 | 198,528 | ||
| Calibration 3 | 198,722 | ||
| ssj_ops@calibrated=198,625 | |||
| 100% | 99.8% | 198,625 | 198,307 |
| 90% | 89.6% | 178,763 | 177,895 |
| 80% | 79.6% | 158,900 | 158,162 |
| 70% | 70.0% | 139,038 | 139,090 |
| 60% | 60.0% | 119,175 | 119,236 |
| 50% | 49.8% | 99,313 | 98,988 |
| 40% | 40.2% | 79,450 | 79,929 |
| 30% | 29.9% | 59,588 | 59,454 |
| 20% | 20.1% | 39,725 | 39,983 |
| 10% | 10.1% | 19,863 | 20,017 |
| Active Idle | 0 | 0 | |

| Target Load | Actual Load | ssj_ops | |
|---|---|---|---|
| Target | Actual | ||
| Calibration 1 | 190,781 | ||
| Calibration 2 | 190,818 | ||
| Calibration 3 | 191,417 | ||
| ssj_ops@calibrated=191,118 | |||
| 100% | 99.6% | 191,118 | 190,423 |
| 90% | 90.6% | 172,006 | 173,089 |
| 80% | 79.7% | 152,894 | 152,322 |
| 70% | 70.3% | 133,782 | 134,271 |
| 60% | 60.0% | 114,671 | 114,766 |
| 50% | 50.3% | 95,559 | 96,060 |
| 40% | 40.1% | 76,447 | 76,596 |
| 30% | 30.1% | 57,335 | 57,447 |
| 20% | 19.9% | 38,224 | 38,017 |
| 10% | 10.2% | 19,112 | 19,487 |
| Active Idle | 0 | 0 | |

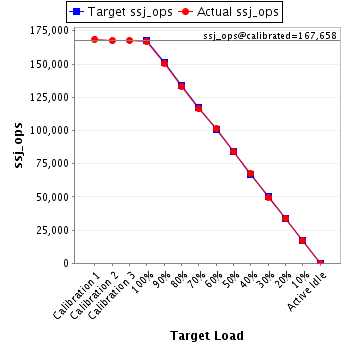
| Target Load | Actual Load | ssj_ops | |
|---|---|---|---|
| Target | Actual | ||
| Calibration 1 | 168,700 | ||
| Calibration 2 | 167,538 | ||
| Calibration 3 | 167,778 | ||
| ssj_ops@calibrated=167,658 | |||
| 100% | 99.8% | 167,658 | 167,314 |
| 90% | 89.8% | 150,892 | 150,605 |
| 80% | 79.6% | 134,126 | 133,427 |
| 70% | 69.3% | 117,360 | 116,136 |
| 60% | 60.4% | 100,595 | 101,252 |
| 50% | 50.0% | 83,829 | 83,841 |
| 40% | 40.3% | 67,063 | 67,584 |
| 30% | 29.6% | 50,297 | 49,616 |
| 20% | 19.9% | 33,532 | 33,440 |
| 10% | 10.2% | 16,766 | 17,040 |
| Active Idle | 0 | 0 | |
| Target Load | Actual Load | ssj_ops | |
|---|---|---|---|
| Target | Actual | ||
| Calibration 1 | 164,966 | ||
| Calibration 2 | 164,365 | ||
| Calibration 3 | 164,985 | ||
| ssj_ops@calibrated=164,675 | |||
| 100% | 99.3% | 164,675 | 163,580 |
| 90% | 89.4% | 148,208 | 147,266 |
| 80% | 80.2% | 131,740 | 132,021 |
| 70% | 70.1% | 115,273 | 115,453 |
| 60% | 60.1% | 98,805 | 98,980 |
| 50% | 50.2% | 82,338 | 82,589 |
| 40% | 40.0% | 65,870 | 65,857 |
| 30% | 29.8% | 49,403 | 49,027 |
| 20% | 20.2% | 32,935 | 33,188 |
| 10% | 10.2% | 16,468 | 16,833 |
| Active Idle | 0 | 0 | |
