SPECpower_ssj2008
Host 'localhost' Performance Report
Copyright © 2007-2020 Standard Performance Evaluation Corporation
| Fujitsu FUJITSU Server PRIMERGY RX4770 M6 | ssj_ops@100% = 9,904,110 ssj_ops@100% per JVM = 1,238,014 |
||||
| Test Sponsor: | Fujitsu | SPEC License #: | 19 | Test Method: | Single Node |
| Tested By: | Fujitsu | Test Location: | Kawasaki, Kanagawa, Japan | Test Date: | Oct 7, 2020 |
| Hardware Availability: | Nov-2020 | Software Availability: | Jul-2020 | Publication: | Nov 4, 2020 |
| System Source: | Single Supplier | System Designation: | Server | Power Provisioning: | Line-powered |
| Target Load | Actual Load | ssj_ops | |
|---|---|---|---|
| Target | Actual | ||
| Calibration 1 | 9,436,394 | ||
| Calibration 2 | 9,906,474 | ||
| Calibration 3 | 9,922,216 | ||
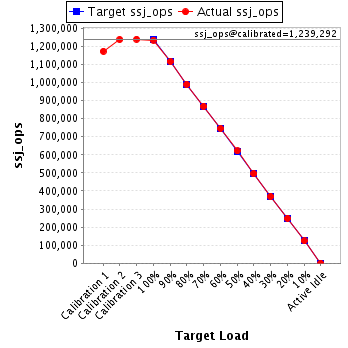
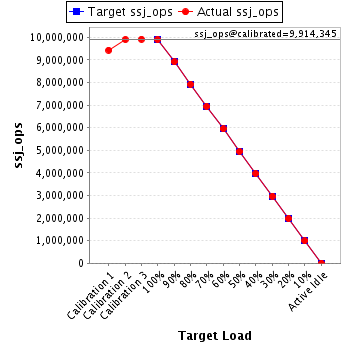
| ssj_ops@calibrated=9,914,345 | |||
| 100% | 99.9% | 9,914,345 | 9,904,110 |
| 90% | 89.9% | 8,922,911 | 8,914,839 |
| 80% | 80.0% | 7,931,476 | 7,933,444 |
| 70% | 70.0% | 6,940,042 | 6,944,695 |
| 60% | 60.0% | 5,948,607 | 5,948,299 |
| 50% | 50.0% | 4,957,173 | 4,956,147 |
| 40% | 40.0% | 3,965,738 | 3,966,282 |
| 30% | 30.0% | 2,974,304 | 2,973,866 |
| 20% | 20.0% | 1,982,869 | 1,980,442 |
| 10% | 10.0% | 991,435 | 990,995 |
| Active Idle | 0 | 0 | |
| Set Identifier: | RX4770M6 |
| Set Description: | System Under Test |
| # of Identical Nodes: | 1 |
| Comment: | Single Node |
| Hardware | |
|---|---|
| Hardware Vendor: | Fujitsu |
| Model: | FUJITSU Server PRIMERGY RX4770 M6 |
| Form Factor: | 3U |
| CPU Name: | Intel Xeon Platinum 8380H |
| CPU Characteristics: | 28-Core, 2.90GHz, 38.5MB L3 Cache |
| CPU Frequency (MHz): | 2900 |
| CPU(s) Enabled: | 112 cores, 4 chips, 28 cores/chip |
| Hardware Threads: | 224 (2 / core) |
| CPU(s) Orderable: | 4 chips |
| Primary Cache: | 32 KB I + 32 KB D on chip per core |
| Secondary Cache: | 1 MB I+D on chip per core |
| Tertiary Cache: | 39424 KB I+D on chip per chip |
| Other Cache: | None |
| Memory Amount (GB): | 384 |
| # and size of DIMM: | 24 x 16384 MB |
| Memory Details: | 24 x 16 GB 2Rx8 PC4-3200Y-R; slots 1A, 1B, 1C, 1D, 1E, 1F, 1G, 1H, 1J, 1K, 1L, 1M, 1N, 1P, 1Q, 1R, 1S, 1T, 1U, 1V, 1W, 1X, 1Y, 1Z populated |
| Power Supply Quantity and Rating (W): | 2 x 900 |
| Power Supply Details: | S26113-E629-V50-1 |
| Disk Drive: | 1 x SSD M.2 240GB, S26361-F5787-E240 |
| Disk Controller: | Integrated SATA Controller |
| # and type of Network Interface Cards (NICs) Installed: | 1 x PLAN CP I350-T4 4X 1000BASE-T OCPv3, PYBLA274U |
| NICs Enabled in Firmware / OS / Connected: | 4/4/1 |
| Network Speed (Mbit): | 1000 |
| Keyboard: | None |
| Mouse: | None |
| Monitor: | None |
| Optical Drives: | No |
| Other Hardware: | None |
| Software | |
|---|---|
| Power Management: | Enabled (see SUT Notes) |
| Operating System (OS): | SUSE Linux Enterprise Server 15 SP2 |
| OS Version: | 5.3.18-19-default |
| Filesystem: | btrfs |
| JVM Vendor: | Oracle Corporation |
| JVM Version: | Oracle Java HotSpot(TM) 64-Bit Server VM 18.9 (build 11.0.8+10-LTS, mixed mode), version 11.0.8 |
| JVM Command-line Options: | -server -Xmn23000m -Xms25000m -Xmx25000m -XX:SurvivorRatio=1 -XX:TargetSurvivorRatio=99 -XX:AllocatePrefetchDistance=256 -XX:AllocatePrefetchLines=4 -XX:ParallelGCThreads=14 -XX:InlineSmallCode=3900 -XX:MaxInlineSize=270 -XX:FreqInlineSize=2500 -XX:+UseLargePages -XX:+UseParallelOldGC -XX:AllocatePrefetchInstr=0 -XX:MinJumpTableSize=18 -XX:UseAVX=0 -XX:+UseHugeTLBFS -XX:+UseTransparentHugePages |
| JVM Affinity: | chrt -r 1 taskset -c [(0,1,2,3,7,8,9,14,15,16,17,21,22,23,112,113,114,115,119,120,121,126,127,128,129,133,134),(4,5,6,10,11,12,13,18,19,20,24,25,26,27,116,117,118,122,123,124,125,130,131,132,136,137,138,139),(28,29,30,31,35,36,37,42,43,44,45,49,50,51,140,141,142,143,147,148,149,154,155,156,157,161,162,163),(32,33,34,38,39,40,41,46,47,48,52,53,54,55,144,145,146,150,151,152,153,158,159,160,164,165,166,167),(56,57,58,59,63,64,65,70,71,72,73,77,78,79,168,169,170,171,175,176,177,182,183,184,185,189,190,191),(60,61,62,66,67,68,69,74,75,76,80,81,82,83,172,173,174,178,179,180,181,186,187,188,192,193,194,195),(84,85,86,87,91,92,93,98,99,100,101,105,106,107,196,197,198,199,203,204,205,210,211,212,213,217,218,219),(88,89,90,94,95,96,97,102,103,104,108,109,110,111,200,201,202,206,207,208,209,214,215,216,220,221,222,223)] numactl --membind=[0-7] |
| JVM Instances: | 8 |
| JVM Initial Heap (MB): | 25000 |
| JVM Maximum Heap (MB): | 25000 |
| JVM Address Bits: | 64 |
| Boot Firmware Version: | R1.1.1 |
| Management Firmware Version: | 3.00P |
| Workload Version: | SSJ 1.2.10 |
| Director Location: | Controller |
| Other Software: | None |
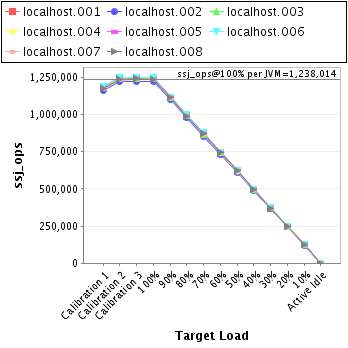
| JVM Instance | ssj_ops@100% |
|---|---|
| localhost.001 | 1,235,313 |
| localhost.002 | 1,224,718 |
| localhost.003 | 1,239,368 |
| localhost.004 | 1,244,047 |
| localhost.005 | 1,245,699 |
| localhost.006 | 1,247,558 |
| localhost.007 | 1,231,957 |
| localhost.008 | 1,235,451 |
| ssj_ops@100% | 9,904,110 |
| ssj_ops@100% per JVM | 1,238,014 |
| Target Load | Actual Load | ssj_ops | |
|---|---|---|---|
| Target | Actual | ||
| Calibration 1 | 1,179,743 | ||
| Calibration 2 | 1,240,494 | ||
| Calibration 3 | 1,236,722 | ||
| ssj_ops@calibrated=1,238,608 | |||
| 100% | 99.7% | 1,238,608 | 1,235,313 |
| 90% | 89.8% | 1,114,747 | 1,111,709 |
| 80% | 80.1% | 990,887 | 992,372 |
| 70% | 70.0% | 867,026 | 866,701 |
| 60% | 59.8% | 743,165 | 740,541 |
| 50% | 50.0% | 619,304 | 619,645 |
| 40% | 40.1% | 495,443 | 496,177 |
| 30% | 30.0% | 371,582 | 370,964 |
| 20% | 20.1% | 247,722 | 248,411 |
| 10% | 10.0% | 123,861 | 123,673 |
| Active Idle | 0 | 0 | |
| Target Load | Actual Load | ssj_ops | |
|---|---|---|---|
| Target | Actual | ||
| Calibration 1 | 1,163,811 | ||
| Calibration 2 | 1,222,161 | ||
| Calibration 3 | 1,223,235 | ||
| ssj_ops@calibrated=1,222,698 | |||
| 100% | 100.2% | 1,222,698 | 1,224,718 |
| 90% | 90.1% | 1,100,428 | 1,101,399 |
| 80% | 80.0% | 978,159 | 977,672 |
| 70% | 69.9% | 855,889 | 854,357 |
| 60% | 59.9% | 733,619 | 732,405 |
| 50% | 49.9% | 611,349 | 609,727 |
| 40% | 40.0% | 489,079 | 488,792 |
| 30% | 30.0% | 366,809 | 366,305 |
| 20% | 20.0% | 244,540 | 244,269 |
| 10% | 10.0% | 122,270 | 121,690 |
| Active Idle | 0 | 0 | |

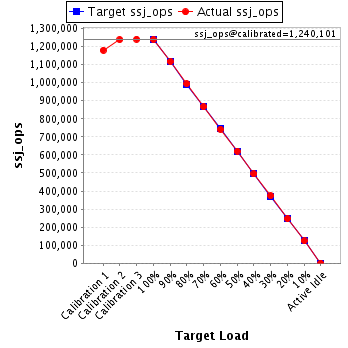
| Target Load | Actual Load | ssj_ops | |
|---|---|---|---|
| Target | Actual | ||
| Calibration 1 | 1,180,167 | ||
| Calibration 2 | 1,238,922 | ||
| Calibration 3 | 1,241,280 | ||
| ssj_ops@calibrated=1,240,101 | |||
| 100% | 99.9% | 1,240,101 | 1,239,368 |
| 90% | 90.1% | 1,116,091 | 1,117,522 |
| 80% | 80.2% | 992,081 | 994,473 |
| 70% | 69.9% | 868,071 | 866,593 |
| 60% | 59.9% | 744,061 | 742,430 |
| 50% | 50.1% | 620,050 | 621,457 |
| 40% | 39.9% | 496,040 | 494,622 |
| 30% | 30.1% | 372,030 | 373,124 |
| 20% | 19.9% | 248,020 | 246,380 |
| 10% | 10.0% | 124,010 | 123,942 |
| Active Idle | 0 | 0 | |
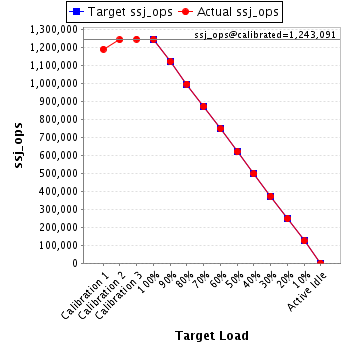
| Target Load | Actual Load | ssj_ops | |
|---|---|---|---|
| Target | Actual | ||
| Calibration 1 | 1,188,654 | ||
| Calibration 2 | 1,241,511 | ||
| Calibration 3 | 1,244,670 | ||
| ssj_ops@calibrated=1,243,091 | |||
| 100% | 100.1% | 1,243,091 | 1,244,047 |
| 90% | 90.1% | 1,118,782 | 1,120,286 |
| 80% | 80.1% | 994,473 | 995,433 |
| 70% | 70.2% | 870,163 | 872,100 |
| 60% | 60.1% | 745,854 | 746,671 |
| 50% | 49.8% | 621,545 | 619,538 |
| 40% | 39.9% | 497,236 | 496,430 |
| 30% | 30.0% | 372,927 | 373,448 |
| 20% | 20.0% | 248,618 | 248,245 |
| 10% | 10.0% | 124,309 | 124,276 |
| Active Idle | 0 | 0 | |
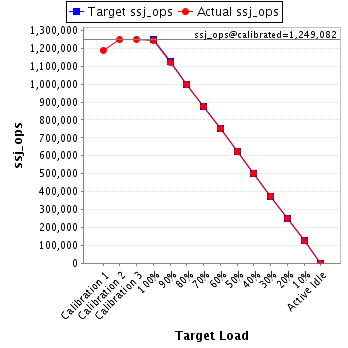
| Target Load | Actual Load | ssj_ops | |
|---|---|---|---|
| Target | Actual | ||
| Calibration 1 | 1,187,451 | ||
| Calibration 2 | 1,247,454 | ||
| Calibration 3 | 1,250,710 | ||
| ssj_ops@calibrated=1,249,082 | |||
| 100% | 99.7% | 1,249,082 | 1,245,699 |
| 90% | 89.7% | 1,124,174 | 1,120,740 |
| 80% | 79.8% | 999,266 | 997,336 |
| 70% | 70.0% | 874,358 | 874,481 |
| 60% | 60.2% | 749,449 | 751,617 |
| 50% | 50.0% | 624,541 | 624,283 |
| 40% | 40.3% | 499,633 | 503,383 |
| 30% | 30.0% | 374,725 | 375,245 |
| 20% | 20.0% | 249,816 | 249,994 |
| 10% | 10.0% | 124,908 | 124,306 |
| Active Idle | 0 | 0 | |
| Target Load | Actual Load | ssj_ops | |
|---|---|---|---|
| Target | Actual | ||
| Calibration 1 | 1,189,793 | ||
| Calibration 2 | 1,245,817 | ||
| Calibration 3 | 1,249,409 | ||
| ssj_ops@calibrated=1,247,613 | |||
| 100% | 100.0% | 1,247,613 | 1,247,558 |
| 90% | 89.6% | 1,122,852 | 1,117,562 |
| 80% | 80.0% | 998,090 | 998,221 |
| 70% | 70.3% | 873,329 | 876,739 |
| 60% | 59.9% | 748,568 | 747,833 |
| 50% | 49.9% | 623,806 | 622,722 |
| 40% | 40.0% | 499,045 | 498,745 |
| 30% | 30.1% | 374,284 | 375,716 |
| 20% | 19.9% | 249,523 | 248,691 |
| 10% | 10.1% | 124,761 | 125,594 |
| Active Idle | 0 | 0 | |

| Target Load | Actual Load | ssj_ops | |
|---|---|---|---|
| Target | Actual | ||
| Calibration 1 | 1,173,587 | ||
| Calibration 2 | 1,231,748 | ||
| Calibration 3 | 1,235,973 | ||
| ssj_ops@calibrated=1,233,860 | |||
| 100% | 99.8% | 1,233,860 | 1,231,957 |
| 90% | 89.9% | 1,110,474 | 1,109,317 |
| 80% | 80.1% | 987,088 | 988,089 |
| 70% | 70.0% | 863,702 | 863,851 |
| 60% | 60.0% | 740,316 | 740,427 |
| 50% | 50.0% | 616,930 | 617,387 |
| 40% | 39.9% | 493,544 | 492,740 |
| 30% | 30.0% | 370,158 | 369,668 |
| 20% | 19.9% | 246,772 | 245,281 |
| 10% | 10.0% | 123,386 | 123,889 |
| Active Idle | 0 | 0 | |

| Target Load | Actual Load | ssj_ops | |
|---|---|---|---|
| Target | Actual | ||
| Calibration 1 | 1,173,188 | ||
| Calibration 2 | 1,238,367 | ||
| Calibration 3 | 1,240,217 | ||
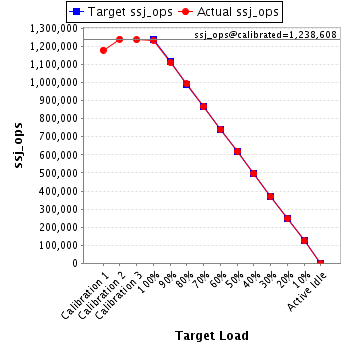
| ssj_ops@calibrated=1,239,292 | |||
| 100% | 99.7% | 1,239,292 | 1,235,451 |
| 90% | 90.1% | 1,115,363 | 1,116,304 |
| 80% | 79.9% | 991,433 | 989,848 |
| 70% | 70.2% | 867,504 | 869,873 |
| 60% | 60.2% | 743,575 | 746,375 |
| 50% | 50.1% | 619,646 | 621,388 |
| 40% | 40.0% | 495,717 | 495,392 |
| 30% | 29.8% | 371,788 | 369,397 |
| 20% | 20.1% | 247,858 | 249,171 |
| 10% | 10.0% | 123,929 | 123,625 |
| Active Idle | 0 | 0 | |