
SPECpower_ssj2008
Aggregate Performance Report
Copyright © 2007-2021 Standard Performance Evaluation Corporation
| Hewlett Packard Enterprise Apollo XL225n Gen10 Plus | ssj_ops@100% = 22,957,212 ssj_ops@100% per Host = 11,478,606 ssj_ops@100% per JVM = 179,353 |
||||
| Test Sponsor: | Hewlett Packard Enterprise | SPEC License #: | 3 | Test Method: | Multi Node |
| Tested By: | Hewlett Packard Enterprise | Test Location: | Houston, TX, USA | Test Date: | Feb 22, 2021 |
| Hardware Availability: | Mar-2021 | Software Availability: | Jan-2021 | Publication: | Mar 15, 2021 |
| System Source: | Single Supplier | System Designation: | Server | Power Provisioning: | Line-powered |
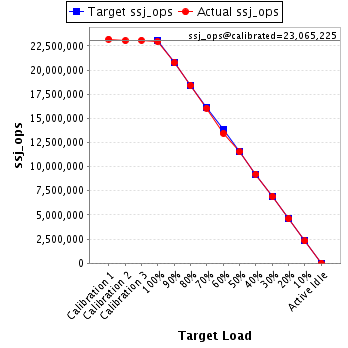
| Target Load | Actual Load | ssj_ops | |
|---|---|---|---|
| Target | Actual | ||
| Calibration 1 | 23,198,381 | ||
| Calibration 2 | 23,050,204 | ||
| Calibration 3 | 23,080,246 | ||
| ssj_ops@calibrated=23,065,225 | |||
| 100% | 99.5% | 23,065,225 | 22,957,212 |
| 90% | 90.0% | 20,758,703 | 20,755,986 |
| 80% | 79.8% | 18,452,180 | 18,407,161 |
| 70% | 69.7% | 16,145,658 | 16,065,866 |
| 60% | 58.3% | 13,839,135 | 13,440,745 |
| 50% | 50.0% | 11,532,613 | 11,531,876 |
| 40% | 40.0% | 9,226,090 | 9,222,024 |
| 30% | 30.0% | 6,919,568 | 6,918,432 |
| 20% | 20.0% | 4,613,045 | 4,614,155 |
| 10% | 10.0% | 2,306,523 | 2,309,941 |
| Active Idle | 0 | 0 | |
| # of Nodes | # of Chips | # of Cores | # of Threads | Total RAM (GB) | # of OS Images | # of JVM Instances |
|---|---|---|---|---|---|---|
| 2 | 4 | 256 | 512 | 512 | 2 | 128 |
| Set Identifier: | SUT |
| Set Description: | System Under Test |
| # of Identical Nodes: | 2 |
| Comment: | SUT |
| Hardware per Node | |
|---|---|
| Hardware Vendor: | Hewlett Packard Enterprise |
| Model: | Apollo XL225n Gen10 Plus |
| Form Factor: | Blade |
| CPU Name: | AMD EPYC 7763 2.45 GHz |
| CPU Characteristics: | 64-Core, 2.45 GHz, 256MB L3 Cache |
| CPU Frequency (MHz): | 2450 |
| CPU(s) Enabled: | 128 cores, 2 chips, 64 cores/chip |
| Hardware Threads: | 256 (2 / core) |
| CPU(s) Orderable: | 1,2 chips |
| Primary Cache: | 32 KB I + 32 KB D on chip per core |
| Secondary Cache: | 512 KB I+D on chip per core |
| Tertiary Cache: | 256 MB I+D on chip per chip |
| Other Cache: | None |
| Memory Amount (GB): | 256 |
| # and size of DIMM: | 16 x 16384 MB |
| Memory Details: | 16 GB 2Rx8 PC4-3200AA-R; all slots populated |
| Power Supply Quantity and Rating (W): | None |
| Power Supply Details: | Shared |
| Disk Drive: | 1 x HPE 480GB SATA 6G SSD (P05976-B21) |
| Disk Controller: | Embedded SATA Controller |
| # and type of Network Interface Cards (NICs) Installed: | 1 x Intel Ethernet I350 4-Port 1Gb NIC |
| NICs Enabled in Firmware / OS / Connected: | 4/4/1 |
| Network Speed (Mbit): | 1000 |
| Keyboard: | None |
| Mouse: | None |
| Monitor: | None |
| Optical Drives: | No |
| Other Hardware: | None |
| Software per Node | |
|---|---|
| Power Management: | Enabled (see SUT Notes) |
| Operating System (OS): | Windows Server 2019 Datacenter |
| OS Version: | Version 1809 (OS Build 17763.1728) |
| Filesystem: | NTFS |
| JVM Vendor: | Oracle Corporation |
| JVM Version: | Java HotSpot(TM) 64-Bit Server VM 18.9 (build 11.0.8+10-LTS, mixed mode) |
| JVM Command-line Options: | -server -Xmn1450m -Xms1700m -Xmx1700m -XX:SurvivorRatio=1 -XX:TargetSurvivorRatio=99 -XX:ParallelGCThreads=2 -XX:AllocatePrefetchDistance=256 -XX:AllocatePrefetchLines=2 -XX:LoopUnrollLimit=45 -XX:InitialTenuringThreshold=12 -XX:MaxTenuringThreshold=15 -XX:InlineSmallCode=3900 -XX:MaxInlineSize=270 -XX:FreqInlineSize=2500 -XX:+UseLargePages -XX:+UseParallelOldGC -XX:LargePageSizeInBytes=2m -XX:+UseBiasedLocking -XX:+UseHugeTLBFS -XX:+UseTransparentHugePages |
| JVM Affinity: | start /NODE [0-15] /AFFINITY [0xF, 0xF0, 0xF00, 0xF000] |
| JVM Instances: | 64 |
| JVM Initial Heap (MB): | 1700 |
| JVM Maximum Heap (MB): | 1700 |
| JVM Address Bits: | 64 |
| Boot Firmware Version: | A46 v2.40 (01/21/2021) |
| Management Firmware Version: | 2.40 Jan 05 2021 |
| Workload Version: | SSJ 1.2.10 |
| Director Location: | Controller |
| Other Software: | KB4598296 |
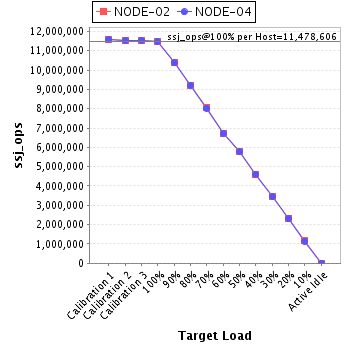
| Host | ssj_ops@100% |
|---|---|
| NODE-02 | 11,489,052 |
| NODE-04 | 11,468,160 |
| ssj_ops@100% | 22,957,212 |
| ssj_ops@100% per Host | 11,478,606 |
| ssj_ops@100% per JVM | 179,353 |
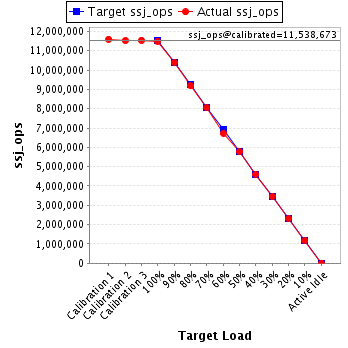
| Target Load | Actual Load | ssj_ops | |
|---|---|---|---|
| Target | Actual | ||
| Calibration 1 | 11,600,798 | ||
| Calibration 2 | 11,528,112 | ||
| Calibration 3 | 11,549,233 | ||
| ssj_ops@calibrated=11,538,673 | |||
| 100% | 99.6% | 11,538,673 | 11,489,052 |
| 90% | 90.0% | 10,384,805 | 10,386,517 |
| 80% | 79.6% | 9,230,938 | 9,184,499 |
| 70% | 69.7% | 8,077,071 | 8,039,324 |
| 60% | 58.3% | 6,923,204 | 6,728,877 |
| 50% | 50.0% | 5,769,336 | 5,767,374 |
| 40% | 40.0% | 4,615,469 | 4,612,578 |
| 30% | 30.0% | 3,461,602 | 3,458,264 |
| 20% | 20.0% | 2,307,735 | 2,307,028 |
| 10% | 10.0% | 1,153,867 | 1,158,696 |
| Active Idle | 0 | 0 | |
| Target Load | Actual Load | ssj_ops | |
|---|---|---|---|
| Target | Actual | ||
| Calibration 1 | 11,597,583 | ||
| Calibration 2 | 11,522,092 | ||
| Calibration 3 | 11,531,013 | ||
| ssj_ops@calibrated=11,526,553 | |||
| 100% | 99.5% | 11,526,553 | 11,468,160 |
| 90% | 90.0% | 10,373,897 | 10,369,468 |
| 80% | 80.0% | 9,221,242 | 9,222,661 |
| 70% | 69.6% | 8,068,587 | 8,026,542 |
| 60% | 58.2% | 6,915,932 | 6,711,868 |
| 50% | 50.0% | 5,763,276 | 5,764,502 |
| 40% | 40.0% | 4,610,621 | 4,609,447 |
| 30% | 30.0% | 3,457,966 | 3,460,168 |
| 20% | 20.0% | 2,305,311 | 2,307,128 |
| 10% | 10.0% | 1,152,655 | 1,151,245 |
| Active Idle | 0 | 0 | |
