
SPECpower_ssj2008
Aggregate Performance Report
Copyright © 2007-2021 Standard Performance Evaluation Corporation
| Hewlett Packard Enterprise Apollo XL225n Gen10 Plus | ssj_ops@100% = 49,655,346 ssj_ops@100% per Host = 12,413,837 ssj_ops@100% per JVM = 96,983 |
||||
| Test Sponsor: | Hewlett Packard Enterprise | SPEC License #: | 3 | Test Method: | Multi Node |
| Tested By: | Hewlett Packard Enterprise | Test Location: | Houston, TX, USA | Test Date: | Feb 22, 2021 |
| Hardware Availability: | Mar-2021 | Software Availability: | Jul-2020 | Publication: | Mar 15, 2021 |
| System Source: | Single Supplier | System Designation: | Server | Power Provisioning: | Line-powered |
| Target Load | Actual Load | ssj_ops | |
|---|---|---|---|
| Target | Actual | ||
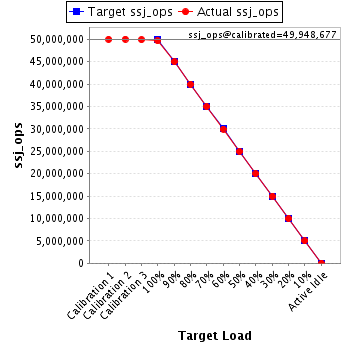
| Calibration 1 | 49,996,683 | ||
| Calibration 2 | 50,015,065 | ||
| Calibration 3 | 49,882,289 | ||
| ssj_ops@calibrated=49,948,677 | |||
| 100% | 99.4% | 49,948,677 | 49,655,346 |
| 90% | 90.0% | 44,953,810 | 44,962,262 |
| 80% | 80.0% | 39,958,942 | 39,963,474 |
| 70% | 70.0% | 34,964,074 | 34,968,982 |
| 60% | 60.0% | 29,969,206 | 29,959,863 |
| 50% | 50.0% | 24,974,339 | 24,968,320 |
| 40% | 40.0% | 19,979,471 | 19,979,113 |
| 30% | 30.0% | 14,984,603 | 14,986,136 |
| 20% | 20.0% | 9,989,735 | 9,995,055 |
| 10% | 10.0% | 4,994,868 | 4,991,541 |
| Active Idle | 0 | 0 | |
| # of Nodes | # of Chips | # of Cores | # of Threads | Total RAM (GB) | # of OS Images | # of JVM Instances |
|---|---|---|---|---|---|---|
| 4 | 8 | 512 | 1,024 | 1,024 | 4 | 512 |
| Set Identifier: | SUT |
| Set Description: | System Under Test |
| # of Identical Nodes: | 4 |
| Comment: | SUT |
| Hardware per Node | |
|---|---|
| Hardware Vendor: | Hewlett Packard Enterprise |
| Model: | Apollo XL225n Gen10 Plus |
| Form Factor: | Blade |
| CPU Name: | AMD EPYC 7763 2.45 GHz |
| CPU Characteristics: | 64-Core, 2.45 GHz, 256MB L3 Cache |
| CPU Frequency (MHz): | 2450 |
| CPU(s) Enabled: | 128 cores, 2 chips, 64 cores/chip |
| Hardware Threads: | 256 (2 / core) |
| CPU(s) Orderable: | 1,2 chips |
| Primary Cache: | 32 KB I + 32 KB D on chip per core |
| Secondary Cache: | 512 KB I+D on chip per core |
| Tertiary Cache: | 256 MB I+D on chip per chip |
| Other Cache: | None |
| Memory Amount (GB): | 256 |
| # and size of DIMM: | 16 x 16384 MB |
| Memory Details: | 16 GB 2Rx8 PC4-3200AA-R; all slots populated |
| Power Supply Quantity and Rating (W): | None |
| Power Supply Details: | Shared |
| Disk Drive: | 1 x HPE 480GB SATA 6G SSD (P05976-B21) |
| Disk Controller: | Embedded SATA Controller |
| # and type of Network Interface Cards (NICs) Installed: | 1 x Intel Ethernet I350 4-Port 1Gb NIC |
| NICs Enabled in Firmware / OS / Connected: | 4/4/1 |
| Network Speed (Mbit): | 1000 |
| Keyboard: | None |
| Mouse: | None |
| Monitor: | None |
| Optical Drives: | No |
| Other Hardware: | None |
| Software per Node | |
|---|---|
| Power Management: | Enabled (see SUT Notes) |
| Operating System (OS): | SUSE Linux Enterprise Server 12 SP5 |
| OS Version: | 4.12.14-122.17-default |
| Filesystem: | xfs |
| JVM Vendor: | Oracle Corporation |
| JVM Version: | Java HotSpot(TM) 64-Bit Server VM 18.9 (build 11.0.8+10-LTS, mixed mode) |
| JVM Command-line Options: | -server -Xmn1450m -Xms1700m -Xmx1700m -XX:SurvivorRatio=1 -XX:TargetSurvivorRatio=99 -XX:ParallelGCThreads=2 -XX:AllocatePrefetchDistance=256 -XX:AllocatePrefetchLines=2 -XX:LoopUnrollLimit=45 -XX:InitialTenuringThreshold=12 -XX:MaxTenuringThreshold=15 -XX:InlineSmallCode=3900 -XX:MaxInlineSize=270 -XX:FreqInlineSize=2500 -XX:+UseLargePages -XX:+UseParallelOldGC -XX:LargePageSizeInBytes=2m -XX:+UseBiasedLocking -XX:+UseHugeTLBFS -XX:+UseTransparentHugePages |
| JVM Affinity: | for each physicalCore { numactl -C physicalCoreId, physicalCoreId + 128 } |
| JVM Instances: | 128 |
| JVM Initial Heap (MB): | 1700 |
| JVM Maximum Heap (MB): | 1700 |
| JVM Address Bits: | 64 |
| Boot Firmware Version: | A46 v2.40 (01/21/2021) |
| Management Firmware Version: | 2.40 Jan 05 2021 |
| Workload Version: | SSJ 1.2.10 |
| Director Location: | Controller |
| Other Software: | None |
| Host | ssj_ops@100% |
|---|---|
| SLES12SP5-Node01 | 12,390,222 |
| SLES12SP5-Node02 | 12,394,509 |
| SLES12SP5-Node03 | 12,453,969 |
| SLES12SP5-Node04 | 12,416,646 |
| ssj_ops@100% | 49,655,346 |
| ssj_ops@100% per Host | 12,413,837 |
| ssj_ops@100% per JVM | 96,983 |

| Target Load | Actual Load | ssj_ops | |
|---|---|---|---|
| Target | Actual | ||
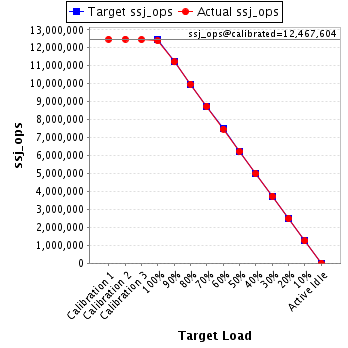
| Calibration 1 | 12,474,478 | ||
| Calibration 2 | 12,480,288 | ||
| Calibration 3 | 12,454,920 | ||
| ssj_ops@calibrated=12,467,604 | |||
| 100% | 99.4% | 12,467,604 | 12,390,222 |
| 90% | 90.0% | 11,220,844 | 11,217,286 |
| 80% | 80.0% | 9,974,083 | 9,977,978 |
| 70% | 70.0% | 8,727,323 | 8,730,738 |
| 60% | 60.0% | 7,480,562 | 7,476,452 |
| 50% | 50.0% | 6,233,802 | 6,232,366 |
| 40% | 40.0% | 4,987,042 | 4,984,363 |
| 30% | 30.0% | 3,740,281 | 3,738,311 |
| 20% | 20.0% | 2,493,521 | 2,495,283 |
| 10% | 10.0% | 1,246,760 | 1,244,840 |
| Active Idle | 0 | 0 | |
| Target Load | Actual Load | ssj_ops | |
|---|---|---|---|
| Target | Actual | ||
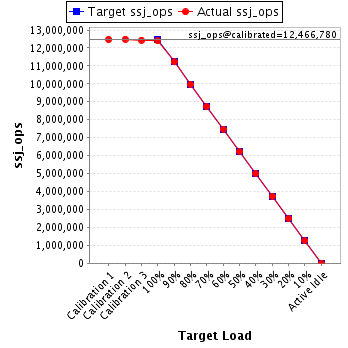
| Calibration 1 | 12,477,286 | ||
| Calibration 2 | 12,491,698 | ||
| Calibration 3 | 12,441,863 | ||
| ssj_ops@calibrated=12,466,780 | |||
| 100% | 99.4% | 12,466,780 | 12,394,509 |
| 90% | 90.0% | 11,220,102 | 11,221,796 |
| 80% | 80.0% | 9,973,424 | 9,974,433 |
| 70% | 70.1% | 8,726,746 | 8,733,084 |
| 60% | 60.0% | 7,480,068 | 7,482,619 |
| 50% | 50.0% | 6,233,390 | 6,232,696 |
| 40% | 40.1% | 4,986,712 | 4,994,417 |
| 30% | 30.0% | 3,740,034 | 3,738,587 |
| 20% | 20.0% | 2,493,356 | 2,495,569 |
| 10% | 10.0% | 1,246,678 | 1,246,631 |
| Active Idle | 0 | 0 | |
| Target Load | Actual Load | ssj_ops | |
|---|---|---|---|
| Target | Actual | ||
| Calibration 1 | 12,534,302 | ||
| Calibration 2 | 12,541,847 | ||
| Calibration 3 | 12,515,369 | ||
| ssj_ops@calibrated=12,528,608 | |||
| 100% | 99.4% | 12,528,608 | 12,453,969 |
| 90% | 90.0% | 11,275,748 | 11,276,311 |
| 80% | 80.0% | 10,022,887 | 10,028,952 |
| 70% | 70.0% | 8,770,026 | 8,772,423 |
| 60% | 59.9% | 7,517,165 | 7,507,169 |
| 50% | 50.0% | 6,264,304 | 6,262,819 |
| 40% | 40.0% | 5,011,443 | 5,009,352 |
| 30% | 30.0% | 3,758,583 | 3,759,879 |
| 20% | 20.0% | 2,505,722 | 2,504,945 |
| 10% | 10.0% | 1,252,861 | 1,251,344 |
| Active Idle | 0 | 0 | |

| Target Load | Actual Load | ssj_ops | |
|---|---|---|---|
| Target | Actual | ||
| Calibration 1 | 12,510,618 | ||
| Calibration 2 | 12,501,232 | ||
| Calibration 3 | 12,470,137 | ||
| ssj_ops@calibrated=12,485,684 | |||
| 100% | 99.4% | 12,485,684 | 12,416,646 |
| 90% | 90.1% | 11,237,116 | 11,246,869 |
| 80% | 79.9% | 9,988,547 | 9,982,111 |
| 70% | 69.9% | 8,739,979 | 8,732,737 |
| 60% | 60.0% | 7,491,411 | 7,493,624 |
| 50% | 50.0% | 6,242,842 | 6,240,439 |
| 40% | 40.0% | 4,994,274 | 4,990,981 |
| 30% | 30.0% | 3,745,705 | 3,749,359 |
| 20% | 20.0% | 2,497,137 | 2,499,258 |
| 10% | 10.0% | 1,248,568 | 1,248,726 |
| Active Idle | 0 | 0 | |
