SPECpower_ssj2008
Host 'localhost' Performance Report
Copyright © 2007-2021 Standard Performance Evaluation Corporation
| Fujitsu PRIMERGY RX2530 M6 | ssj_ops@100% = 7,573,884 ssj_ops@100% per JVM = 946,736 |
||||
| Test Sponsor: | Fujitsu | SPEC License #: | 19 | Test Method: | Single Node |
| Tested By: | Fujitsu | Test Location: | Kawasaki, Kanagawa, Japan | Test Date: | Apr 2, 2021 |
| Hardware Availability: | May-2021 | Software Availability: | Dec-2020 | Publication: | Apr 28, 2021 |
| System Source: | Single Supplier | System Designation: | Server | Power Provisioning: | Line-powered |
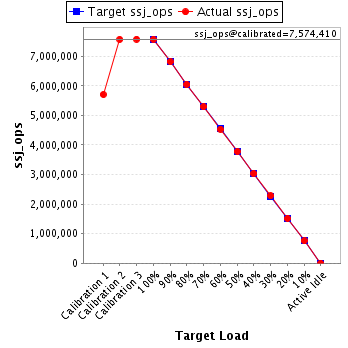
| Target Load | Actual Load | ssj_ops | |
|---|---|---|---|
| Target | Actual | ||
| Calibration 1 | 5,705,593 | ||
| Calibration 2 | 7,571,015 | ||
| Calibration 3 | 7,577,805 | ||
| ssj_ops@calibrated=7,574,410 | |||
| 100% | 100.0% | 7,574,410 | 7,573,884 |
| 90% | 90.0% | 6,816,969 | 6,814,856 |
| 80% | 79.8% | 6,059,528 | 6,047,198 |
| 70% | 69.9% | 5,302,087 | 5,292,424 |
| 60% | 59.9% | 4,544,646 | 4,535,904 |
| 50% | 49.9% | 3,787,205 | 3,781,094 |
| 40% | 40.0% | 3,029,764 | 3,031,768 |
| 30% | 30.1% | 2,272,323 | 2,279,204 |
| 20% | 20.0% | 1,514,882 | 1,516,364 |
| 10% | 10.0% | 757,441 | 758,504 |
| Active Idle | 0 | 0 | |
| Set Identifier: | RX2530M6 |
| Set Description: | System Under Test |
| # of Identical Nodes: | 1 |
| Comment: | Single Node |
| Hardware | |
|---|---|
| Hardware Vendor: | Fujitsu |
| Model: | PRIMERGY RX2530 M6 |
| Form Factor: | 1U |
| CPU Name: | Intel Xeon Platinum 8380 |
| CPU Characteristics: | 40-Core, 2.30GHz, 60MB L3 Cache |
| CPU Frequency (MHz): | 2300 |
| CPU(s) Enabled: | 80 cores, 2 chips, 40 cores/chip |
| Hardware Threads: | 160 (2 / core) |
| CPU(s) Orderable: | 2 chips |
| Primary Cache: | 32 KB I + 48 KB D on chip per core |
| Secondary Cache: | 1280 KB I+D on chip per core |
| Tertiary Cache: | 60 MB I+D on chip per chip |
| Other Cache: | None |
| Memory Amount (GB): | 256 |
| # and size of DIMM: | 16 x 16384 MB |
| Memory Details: | 16 x 16 GB 2Rx8 PC4-3200Y-R; slots 1A, 1B, 1C, 1D, 1E, 1F, 1G, 1H, 1J, 1K, 1L, 1M, 1N, 1P, 1Q, 1R populated |
| Power Supply Quantity and Rating (W): | 1 x 900 |
| Power Supply Details: | S26113-E629-V50-1 |
| Disk Drive: | 1 x SSD M.2 240GB, S26361-F5787-E240 |
| Disk Controller: | Integrated SATA Controller |
| # and type of Network Interface Cards (NICs) Installed: | 1 x PLAN CP I350-T4 4X 1000BASE-T OCPv3, PYBLA274U |
| NICs Enabled in Firmware / OS / Connected: | 4/4/1 |
| Network Speed (Mbit): | 1000 |
| Keyboard: | None |
| Mouse: | None |
| Monitor: | None |
| Optical Drives: | No |
| Other Hardware: | None |
| Software | |
|---|---|
| Power Management: | Enabled (see SUT Notes) |
| Operating System (OS): | SUSE Linux Enterprise Server 15 SP2 |
| OS Version: | 5.3.18-24.43-default |
| Filesystem: | btrfs |
| JVM Vendor: | Oracle Corporation |
| JVM Version: | Oracle Java HotSpot(TM) 64-Bit Server VM 18.9 (build 11.0.9+7-LTS, mixed mode) |
| JVM Command-line Options: | -server -Xmn16000m -Xms18000m -Xmx18000m -XX:+UseHugeTLBFS -XX:+UseLargePages -XX:+UseTransparentHugePages -XX:AllocatePrefetchDistance=256 -XX:AllocatePrefetchInstr=0 -XX:AllocatePrefetchLines=4 -XX:InlineSmallCode=3900 -XX:MaxInlineSize=270 -XX:ParallelGCThreads=8 -XX:SurvivorRatio=1 -XX:TargetSurvivorRatio=99 -XX:+UseParallelOldGC -XX:FreqInlineSize=2500 -XX:MinJumpTableSize=18 -XX:UseAVX=0 -XX:+UseBiasedLocking |
| JVM Affinity: | chrt -r 1 taskset -c [(0,1,2,3,4,5,6,7,8,9,80,81,82,83,84,85,86,87,88,89),(10,11,12,13,14,15,16,17,18,19,90,91,92,93,94,95,96,97,98),(20,21,22,23,24,25,26,27,28,29,100,101,102,103,104,105,106,107,108,109),(30,31,32,33,34,35,36,37,38,39,110,111,112,113,114,115,116,117,118),(40,41,42,43,44,45,46,47,48,49,120,121,122,123,124,125,126,127,128,129),(50,51,52,53,54,55,56,57,58,59,130,131,132,133,134,135,136,137,138),(60,61,62,63,64,65,66,67,68,69,140,141,142,143,144,145,146,147,148,149),(70,71,72,73,74,75,76,77,78,79,150,151,152,153,154,155,156,157,158)] numactl --membind=[0-3] |
| JVM Instances: | 8 |
| JVM Initial Heap (MB): | 1950 |
| JVM Maximum Heap (MB): | 1950 |
| JVM Address Bits: | 64 |
| Boot Firmware Version: | R1.3.0 |
| Management Firmware Version: | 3.20m |
| Workload Version: | SSJ 1.2.10 |
| Director Location: | Controller |
| Other Software: | None |
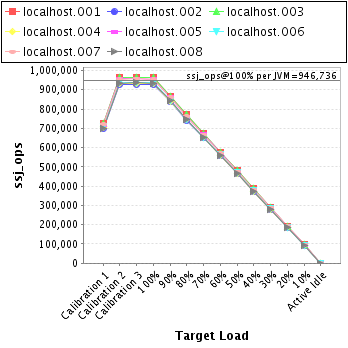
| JVM Instance | ssj_ops@100% |
|---|---|
| localhost.001 | 965,313 |
| localhost.002 | 928,791 |
| localhost.003 | 964,115 |
| localhost.004 | 931,929 |
| localhost.005 | 955,825 |
| localhost.006 | 937,621 |
| localhost.007 | 955,371 |
| localhost.008 | 934,920 |
| ssj_ops@100% | 7,573,884 |
| ssj_ops@100% per JVM | 946,736 |
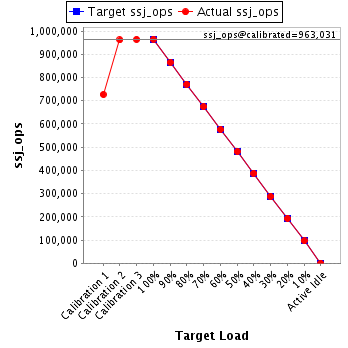
| Target Load | Actual Load | ssj_ops | |
|---|---|---|---|
| Target | Actual | ||
| Calibration 1 | 726,894 | ||
| Calibration 2 | 961,797 | ||
| Calibration 3 | 964,264 | ||
| ssj_ops@calibrated=963,031 | |||
| 100% | 100.2% | 963,031 | 965,313 |
| 90% | 89.9% | 866,727 | 865,805 |
| 80% | 80.1% | 770,424 | 771,376 |
| 70% | 70.0% | 674,121 | 674,276 |
| 60% | 59.8% | 577,818 | 576,089 |
| 50% | 50.0% | 481,515 | 481,213 |
| 40% | 40.2% | 385,212 | 386,968 |
| 30% | 29.9% | 288,909 | 287,707 |
| 20% | 20.1% | 192,606 | 193,284 |
| 10% | 10.0% | 96,303 | 96,696 |
| Active Idle | 0 | 0 | |
| Target Load | Actual Load | ssj_ops | |
|---|---|---|---|
| Target | Actual | ||
| Calibration 1 | 700,648 | ||
| Calibration 2 | 929,931 | ||
| Calibration 3 | 929,516 | ||
| ssj_ops@calibrated=929,723 | |||
| 100% | 99.9% | 929,723 | 928,791 |
| 90% | 90.0% | 836,751 | 836,647 |
| 80% | 79.9% | 743,779 | 743,165 |
| 70% | 69.9% | 650,806 | 650,142 |
| 60% | 59.9% | 557,834 | 557,173 |
| 50% | 50.1% | 464,862 | 466,168 |
| 40% | 39.9% | 371,889 | 371,118 |
| 30% | 30.0% | 278,917 | 278,787 |
| 20% | 20.2% | 185,945 | 187,384 |
| 10% | 10.0% | 92,972 | 93,160 |
| Active Idle | 0 | 0 | |

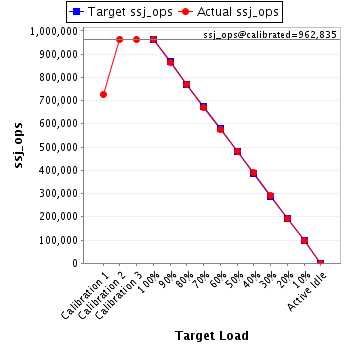
| Target Load | Actual Load | ssj_ops | |
|---|---|---|---|
| Target | Actual | ||
| Calibration 1 | 726,276 | ||
| Calibration 2 | 963,579 | ||
| Calibration 3 | 962,090 | ||
| ssj_ops@calibrated=962,835 | |||
| 100% | 100.1% | 962,835 | 964,115 |
| 90% | 89.8% | 866,551 | 864,333 |
| 80% | 80.0% | 770,268 | 770,546 |
| 70% | 69.8% | 673,984 | 671,878 |
| 60% | 59.9% | 577,701 | 576,932 |
| 50% | 50.1% | 481,417 | 482,306 |
| 40% | 40.3% | 385,134 | 388,451 |
| 30% | 30.1% | 288,850 | 290,033 |
| 20% | 19.9% | 192,567 | 192,016 |
| 10% | 10.0% | 96,283 | 96,606 |
| Active Idle | 0 | 0 | |
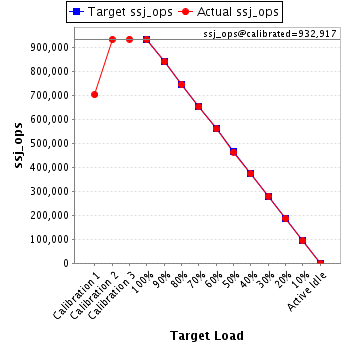
| Target Load | Actual Load | ssj_ops | |
|---|---|---|---|
| Target | Actual | ||
| Calibration 1 | 702,837 | ||
| Calibration 2 | 931,896 | ||
| Calibration 3 | 933,937 | ||
| ssj_ops@calibrated=932,917 | |||
| 100% | 99.9% | 932,917 | 931,929 |
| 90% | 90.0% | 839,625 | 839,928 |
| 80% | 79.8% | 746,333 | 744,472 |
| 70% | 69.8% | 653,042 | 651,583 |
| 60% | 60.0% | 559,750 | 559,736 |
| 50% | 49.7% | 466,458 | 463,504 |
| 40% | 40.0% | 373,167 | 372,777 |
| 30% | 30.0% | 279,875 | 280,207 |
| 20% | 20.0% | 186,583 | 186,264 |
| 10% | 10.0% | 93,292 | 93,013 |
| Active Idle | 0 | 0 | |
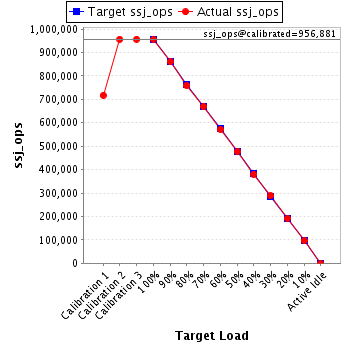
| Target Load | Actual Load | ssj_ops | |
|---|---|---|---|
| Target | Actual | ||
| Calibration 1 | 717,840 | ||
| Calibration 2 | 956,659 | ||
| Calibration 3 | 957,103 | ||
| ssj_ops@calibrated=956,881 | |||
| 100% | 99.9% | 956,881 | 955,825 |
| 90% | 90.0% | 861,193 | 860,757 |
| 80% | 79.4% | 765,505 | 760,005 |
| 70% | 69.9% | 669,816 | 669,159 |
| 60% | 59.8% | 574,128 | 572,067 |
| 50% | 49.8% | 478,440 | 476,402 |
| 40% | 39.8% | 382,752 | 380,830 |
| 30% | 30.1% | 287,064 | 287,993 |
| 20% | 20.0% | 191,376 | 191,808 |
| 10% | 10.0% | 95,688 | 95,928 |
| Active Idle | 0 | 0 | |
| Target Load | Actual Load | ssj_ops | |
|---|---|---|---|
| Target | Actual | ||
| Calibration 1 | 708,734 | ||
| Calibration 2 | 937,817 | ||
| Calibration 3 | 938,007 | ||
| ssj_ops@calibrated=937,912 | |||
| 100% | 100.0% | 937,912 | 937,621 |
| 90% | 89.8% | 844,121 | 842,678 |
| 80% | 79.6% | 750,330 | 746,762 |
| 70% | 69.7% | 656,538 | 654,123 |
| 60% | 60.1% | 562,747 | 563,254 |
| 50% | 50.0% | 468,956 | 468,807 |
| 40% | 40.1% | 375,165 | 375,880 |
| 30% | 30.3% | 281,374 | 283,848 |
| 20% | 19.9% | 187,582 | 186,977 |
| 10% | 10.0% | 93,791 | 94,075 |
| Active Idle | 0 | 0 | |

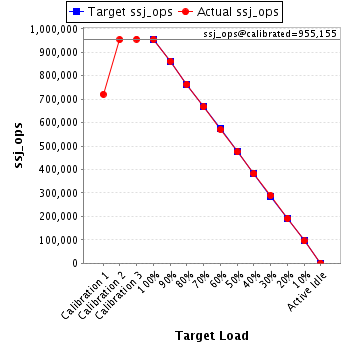
| Target Load | Actual Load | ssj_ops | |
|---|---|---|---|
| Target | Actual | ||
| Calibration 1 | 721,094 | ||
| Calibration 2 | 954,195 | ||
| Calibration 3 | 956,115 | ||
| ssj_ops@calibrated=955,155 | |||
| 100% | 100.0% | 955,155 | 955,371 |
| 90% | 90.3% | 859,639 | 862,294 |
| 80% | 79.9% | 764,124 | 763,186 |
| 70% | 69.9% | 668,608 | 667,223 |
| 60% | 59.7% | 573,093 | 570,441 |
| 50% | 49.8% | 477,577 | 475,402 |
| 40% | 40.0% | 382,062 | 381,668 |
| 30% | 30.3% | 286,546 | 289,237 |
| 20% | 20.0% | 191,031 | 190,977 |
| 10% | 10.0% | 95,515 | 95,163 |
| Active Idle | 0 | 0 | |
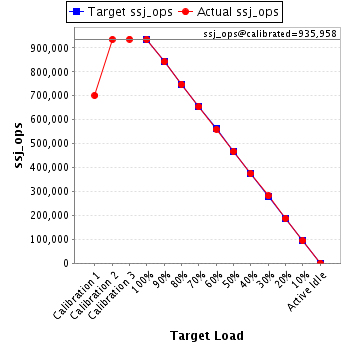
| Target Load | Actual Load | ssj_ops | |
|---|---|---|---|
| Target | Actual | ||
| Calibration 1 | 701,271 | ||
| Calibration 2 | 935,141 | ||
| Calibration 3 | 936,774 | ||
| ssj_ops@calibrated=935,958 | |||
| 100% | 99.9% | 935,958 | 934,920 |
| 90% | 90.0% | 842,362 | 842,415 |
| 80% | 79.9% | 748,766 | 747,684 |
| 70% | 69.9% | 655,170 | 654,040 |
| 60% | 59.9% | 561,575 | 560,212 |
| 50% | 49.9% | 467,979 | 467,292 |
| 40% | 40.0% | 374,383 | 374,076 |
| 30% | 30.1% | 280,787 | 281,391 |
| 20% | 20.0% | 187,192 | 187,654 |
| 10% | 10.0% | 93,596 | 93,863 |
| Active Idle | 0 | 0 | |