| Target Load |
Actual Load |
ssj_ops |
| Target |
Actual |
| Calibration 1 |
|
|
12,361,004 |
| Calibration 2 |
|
|
12,337,536 |
| Calibration 3 |
|
|
12,361,225 |
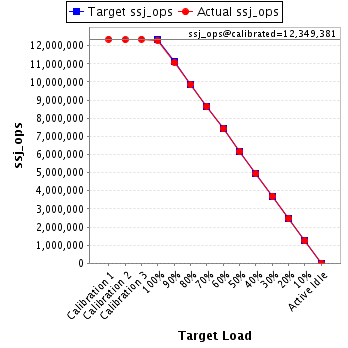
| ssj_ops@calibrated=12,349,381 |
| 100% |
99.6% |
12,349,381 |
12,303,077 |
| 90% |
89.7% |
11,114,443 |
11,081,904 |
| 80% |
79.7% |
9,879,505 |
9,846,137 |
| 70% |
69.9% |
8,644,566 |
8,637,124 |
| 60% |
60.0% |
7,409,628 |
7,411,377 |
| 50% |
49.8% |
6,174,690 |
6,155,744 |
| 40% |
40.0% |
4,939,752 |
4,938,696 |
| 30% |
30.0% |
3,704,814 |
3,704,801 |
| 20% |
20.0% |
2,469,876 |
2,469,911 |
| 10% |
10.0% |
1,234,938 |
1,234,550 |
| Active Idle |
|
0 |
0 |
| Hardware |
| Hardware Vendor: |
Lenovo Global Technology |
| Model: |
ThinkSystem SR645 |
| Form Factor: |
1U |
| CPU Name: |
AMD EPYC 7763 2.45GHz |
| CPU Characteristics: |
64-Core, 2.45GHz, 256MB L3 Cache |
| CPU Frequency (MHz): |
2450 |
| CPU(s) Enabled: |
128 cores, 2 chips, 64 cores/chip |
| Hardware Threads: |
256 (2 / core) |
| CPU(s) Orderable: |
1,2 chips |
| Primary Cache: |
32 KB I + 32 KB D on chip per core |
| Secondary Cache: |
512 KB I+D on chip per core |
| Tertiary Cache: |
256 MB I+D on chip per chip |
| Other Cache: |
None |
| Memory Amount (GB): |
256 |
| # and size of DIMM: |
16 x 16384 MB |
| Memory Details: |
16 x 16GB 2Rx8 PC4-3200AA-RE2-12; slots 1, 3, 5, 7, 10, 12, 14, 16, 17, 19, 21, 23, 26, 28, 30,and 32 populated |
| Power Supply Quantity and Rating (W): |
1 x 750 |
| Power Supply Details: |
Lenovo P/N:4P57A26292 |
| Disk Drive: |
1 x 128GB M.2 SSD P/N:7N47A00130 M.2 Module P/N:4Y37A09738 |
| Disk Controller: |
Integrated SATA controller |
| # and type of Network Interface Cards (NICs) Installed: |
1 x ThinkSystem Broadcom 1GbE 2-Port Ethernet Adapter |
| NICs Enabled in Firmware / OS / Connected: |
2/2/1 |
| Network Speed (Mbit): |
1000 |
| Keyboard: |
None |
| Mouse: |
None |
| Monitor: |
None |
| Optical Drives: |
No |
| Other Hardware: |
None |
| JVM Instance |
ssj_ops@100% |
| localhost.001 |
190,389 |
| localhost.002 |
197,998 |
| localhost.003 |
190,050 |
| localhost.004 |
193,899 |
| localhost.005 |
195,537 |
| localhost.006 |
196,258 |
| localhost.007 |
190,716 |
| localhost.008 |
190,569 |
| localhost.009 |
193,879 |
| localhost.010 |
197,141 |
| localhost.011 |
186,080 |
| localhost.012 |
187,684 |
| localhost.013 |
193,165 |
| localhost.014 |
193,708 |
| localhost.015 |
196,046 |
| localhost.016 |
195,727 |
| localhost.017 |
197,531 |
| localhost.018 |
190,360 |
| localhost.019 |
194,230 |
| localhost.020 |
191,861 |
| localhost.021 |
191,609 |
| localhost.022 |
195,197 |
| localhost.023 |
186,615 |
| localhost.024 |
190,492 |
| localhost.025 |
189,628 |
| localhost.026 |
195,446 |
| localhost.027 |
189,101 |
| localhost.028 |
197,935 |
| localhost.029 |
189,037 |
| localhost.030 |
194,916 |
| localhost.031 |
188,544 |
| localhost.032 |
196,975 |
| localhost.033 |
187,726 |
| localhost.034 |
195,345 |
| localhost.035 |
190,022 |
| localhost.036 |
190,419 |
| localhost.037 |
192,956 |
| localhost.038 |
189,577 |
| localhost.039 |
194,935 |
| localhost.040 |
190,752 |
| localhost.041 |
190,104 |
| localhost.042 |
192,672 |
| localhost.043 |
191,984 |
| localhost.044 |
191,032 |
| localhost.045 |
194,756 |
| localhost.046 |
190,134 |
| localhost.047 |
191,826 |
| localhost.048 |
189,927 |
| localhost.049 |
196,920 |
| localhost.050 |
191,347 |
| localhost.051 |
191,126 |
| localhost.052 |
191,989 |
| localhost.053 |
186,837 |
| localhost.054 |
192,379 |
| localhost.055 |
197,725 |
| localhost.056 |
189,486 |
| localhost.057 |
189,600 |
| localhost.058 |
193,674 |
| localhost.059 |
194,025 |
| localhost.060 |
194,142 |
| localhost.061 |
192,521 |
| localhost.062 |
190,401 |
| localhost.063 |
192,350 |
| localhost.064 |
186,068 |
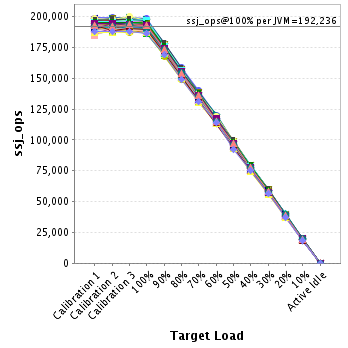
| ssj_ops@100% |
12,303,077 |
| ssj_ops@100% per JVM |
192,236 |
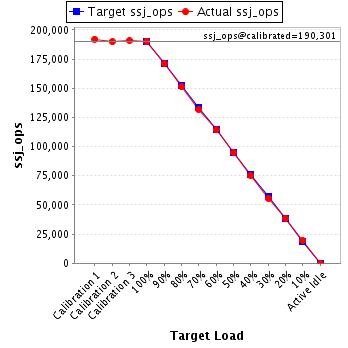
JVM 'localhost.001' Scores:
| Target Load |
Actual Load |
ssj_ops |
| Target |
Actual |
| Calibration 1 |
|
|
191,997 |
| Calibration 2 |
|
|
189,769 |
| Calibration 3 |
|
|
190,834 |
| ssj_ops@calibrated=190,301 |
| 100% |
100.0% |
190,301 |
190,389 |
| 90% |
89.9% |
171,271 |
171,016 |
| 80% |
79.5% |
152,241 |
151,267 |
| 70% |
69.2% |
133,211 |
131,746 |
| 60% |
60.1% |
114,181 |
114,285 |
| 50% |
49.7% |
95,151 |
94,563 |
| 40% |
39.6% |
76,121 |
75,285 |
| 30% |
29.3% |
57,090 |
55,748 |
| 20% |
20.2% |
38,060 |
38,354 |
| 10% |
10.1% |
19,030 |
19,255 |
| Active Idle |
|
0 |
0 |
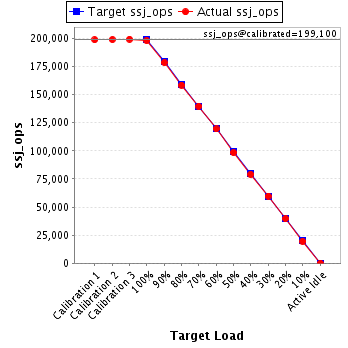
JVM 'localhost.002' Scores:
| Target Load |
Actual Load |
ssj_ops |
| Target |
Actual |
| Calibration 1 |
|
|
198,686 |
| Calibration 2 |
|
|
198,886 |
| Calibration 3 |
|
|
199,314 |
| ssj_ops@calibrated=199,100 |
| 100% |
99.4% |
199,100 |
197,998 |
| 90% |
89.6% |
179,190 |
178,455 |
| 80% |
79.6% |
159,280 |
158,500 |
| 70% |
70.1% |
139,370 |
139,634 |
| 60% |
60.0% |
119,460 |
119,453 |
| 50% |
49.4% |
99,550 |
98,358 |
| 40% |
39.7% |
79,640 |
79,087 |
| 30% |
30.0% |
59,730 |
59,798 |
| 20% |
19.9% |
39,820 |
39,611 |
| 10% |
9.8% |
19,910 |
19,589 |
| Active Idle |
|
0 |
0 |
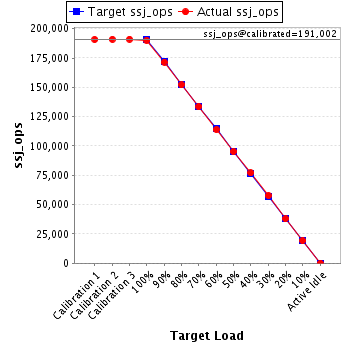
JVM 'localhost.003' Scores:
| Target Load |
Actual Load |
ssj_ops |
| Target |
Actual |
| Calibration 1 |
|
|
190,808 |
| Calibration 2 |
|
|
190,949 |
| Calibration 3 |
|
|
191,056 |
| ssj_ops@calibrated=191,002 |
| 100% |
99.5% |
191,002 |
190,050 |
| 90% |
89.8% |
171,902 |
171,537 |
| 80% |
79.6% |
152,802 |
151,985 |
| 70% |
69.9% |
133,702 |
133,525 |
| 60% |
59.7% |
114,601 |
113,970 |
| 50% |
49.9% |
95,501 |
95,249 |
| 40% |
40.3% |
76,401 |
76,973 |
| 30% |
30.2% |
57,301 |
57,715 |
| 20% |
19.8% |
38,200 |
37,834 |
| 10% |
10.1% |
19,100 |
19,324 |
| Active Idle |
|
0 |
0 |
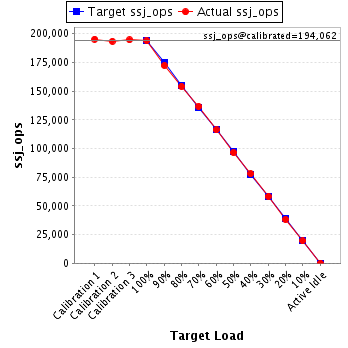
JVM 'localhost.004' Scores:
| Target Load |
Actual Load |
ssj_ops |
| Target |
Actual |
| Calibration 1 |
|
|
195,318 |
| Calibration 2 |
|
|
193,513 |
| Calibration 3 |
|
|
194,611 |
| ssj_ops@calibrated=194,062 |
| 100% |
99.9% |
194,062 |
193,899 |
| 90% |
88.8% |
174,656 |
172,378 |
| 80% |
79.4% |
155,250 |
154,043 |
| 70% |
70.4% |
135,843 |
136,693 |
| 60% |
59.9% |
116,437 |
116,208 |
| 50% |
49.7% |
97,031 |
96,463 |
| 40% |
40.2% |
77,625 |
77,971 |
| 30% |
30.0% |
58,219 |
58,267 |
| 20% |
19.7% |
38,812 |
38,158 |
| 10% |
10.0% |
19,406 |
19,466 |
| Active Idle |
|
0 |
0 |
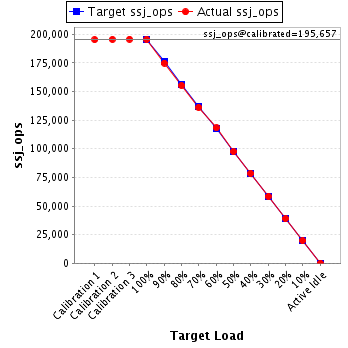
JVM 'localhost.005' Scores:
| Target Load |
Actual Load |
ssj_ops |
| Target |
Actual |
| Calibration 1 |
|
|
195,207 |
| Calibration 2 |
|
|
195,550 |
| Calibration 3 |
|
|
195,764 |
| ssj_ops@calibrated=195,657 |
| 100% |
99.9% |
195,657 |
195,537 |
| 90% |
89.4% |
176,091 |
174,941 |
| 80% |
79.3% |
156,526 |
155,147 |
| 70% |
69.6% |
136,960 |
136,156 |
| 60% |
60.4% |
117,394 |
118,240 |
| 50% |
49.8% |
97,829 |
97,534 |
| 40% |
40.1% |
78,263 |
78,491 |
| 30% |
29.9% |
58,697 |
58,456 |
| 20% |
19.9% |
39,131 |
38,934 |
| 10% |
10.1% |
19,566 |
19,747 |
| Active Idle |
|
0 |
0 |
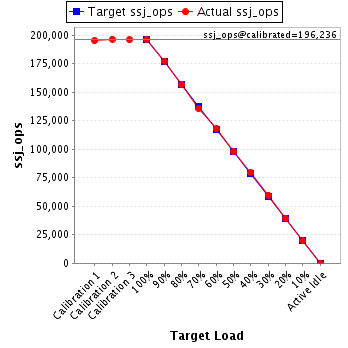
JVM 'localhost.006' Scores:
| Target Load |
Actual Load |
ssj_ops |
| Target |
Actual |
| Calibration 1 |
|
|
195,240 |
| Calibration 2 |
|
|
196,526 |
| Calibration 3 |
|
|
195,945 |
| ssj_ops@calibrated=196,236 |
| 100% |
100.0% |
196,236 |
196,258 |
| 90% |
90.4% |
176,612 |
177,369 |
| 80% |
79.8% |
156,988 |
156,593 |
| 70% |
69.3% |
137,365 |
135,918 |
| 60% |
60.1% |
117,741 |
117,909 |
| 50% |
50.0% |
98,118 |
98,141 |
| 40% |
40.5% |
78,494 |
79,501 |
| 30% |
30.5% |
58,871 |
59,778 |
| 20% |
20.2% |
39,247 |
39,597 |
| 10% |
10.0% |
19,624 |
19,537 |
| Active Idle |
|
0 |
0 |
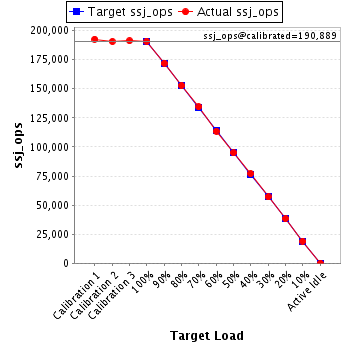
JVM 'localhost.007' Scores:
| Target Load |
Actual Load |
ssj_ops |
| Target |
Actual |
| Calibration 1 |
|
|
192,612 |
| Calibration 2 |
|
|
190,589 |
| Calibration 3 |
|
|
191,189 |
| ssj_ops@calibrated=190,889 |
| 100% |
99.9% |
190,889 |
190,716 |
| 90% |
90.1% |
171,800 |
171,923 |
| 80% |
80.0% |
152,711 |
152,629 |
| 70% |
70.4% |
133,622 |
134,403 |
| 60% |
59.5% |
114,533 |
113,516 |
| 50% |
49.7% |
95,444 |
94,846 |
| 40% |
40.3% |
76,356 |
77,020 |
| 30% |
29.8% |
57,267 |
56,971 |
| 20% |
20.1% |
38,178 |
38,306 |
| 10% |
10.0% |
19,089 |
19,007 |
| Active Idle |
|
0 |
0 |
JVM 'localhost.008' Scores:
| Target Load |
Actual Load |
ssj_ops |
| Target |
Actual |
| Calibration 1 |
|
|
192,849 |
| Calibration 2 |
|
|
191,372 |
| Calibration 3 |
|
|
191,898 |
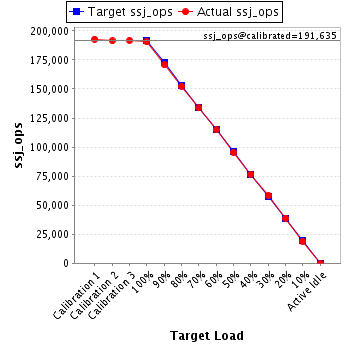
| ssj_ops@calibrated=191,635 |
| 100% |
99.4% |
191,635 |
190,569 |
| 90% |
89.1% |
172,472 |
170,708 |
| 80% |
79.6% |
153,308 |
152,515 |
| 70% |
69.7% |
134,145 |
133,640 |
| 60% |
59.9% |
114,981 |
114,875 |
| 50% |
49.8% |
95,818 |
95,398 |
| 40% |
40.0% |
76,654 |
76,560 |
| 30% |
30.3% |
57,491 |
58,100 |
| 20% |
20.2% |
38,327 |
38,719 |
| 10% |
10.0% |
19,164 |
19,095 |
| Active Idle |
|
0 |
0 |
JVM 'localhost.009' Scores:
| Target Load |
Actual Load |
ssj_ops |
| Target |
Actual |
| Calibration 1 |
|
|
195,524 |
| Calibration 2 |
|
|
195,248 |
| Calibration 3 |
|
|
194,858 |
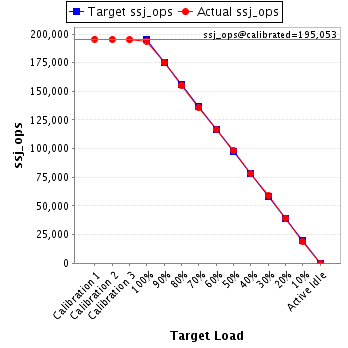
| ssj_ops@calibrated=195,053 |
| 100% |
99.4% |
195,053 |
193,879 |
| 90% |
89.9% |
175,548 |
175,256 |
| 80% |
79.7% |
156,042 |
155,413 |
| 70% |
69.8% |
136,537 |
136,133 |
| 60% |
59.9% |
117,032 |
116,923 |
| 50% |
50.4% |
97,526 |
98,381 |
| 40% |
40.1% |
78,021 |
78,126 |
| 30% |
30.1% |
58,516 |
58,714 |
| 20% |
20.2% |
39,011 |
39,364 |
| 10% |
9.8% |
19,505 |
19,146 |
| Active Idle |
|
0 |
0 |
JVM 'localhost.010' Scores:
| Target Load |
Actual Load |
ssj_ops |
| Target |
Actual |
| Calibration 1 |
|
|
197,964 |
| Calibration 2 |
|
|
195,457 |
| Calibration 3 |
|
|
197,790 |
| ssj_ops@calibrated=196,623 |
| 100% |
100.3% |
196,623 |
197,141 |
| 90% |
89.4% |
176,961 |
175,714 |
| 80% |
79.6% |
157,299 |
156,537 |
| 70% |
69.9% |
137,636 |
137,406 |
| 60% |
59.9% |
117,974 |
117,758 |
| 50% |
49.7% |
98,312 |
97,711 |
| 40% |
40.3% |
78,649 |
79,309 |
| 30% |
30.0% |
58,987 |
58,997 |
| 20% |
20.1% |
39,325 |
39,568 |
| 10% |
9.8% |
19,662 |
19,179 |
| Active Idle |
|
0 |
0 |
JVM 'localhost.011' Scores:
| Target Load |
Actual Load |
ssj_ops |
| Target |
Actual |
| Calibration 1 |
|
|
186,201 |
| Calibration 2 |
|
|
187,683 |
| Calibration 3 |
|
|
188,874 |
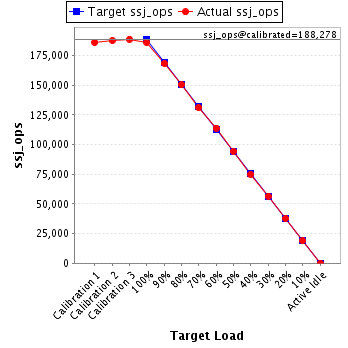
| ssj_ops@calibrated=188,278 |
| 100% |
98.8% |
188,278 |
186,080 |
| 90% |
89.5% |
169,450 |
168,517 |
| 80% |
79.9% |
150,623 |
150,376 |
| 70% |
69.7% |
131,795 |
131,311 |
| 60% |
60.5% |
112,967 |
113,962 |
| 50% |
50.2% |
94,139 |
94,495 |
| 40% |
39.8% |
75,311 |
75,022 |
| 30% |
30.1% |
56,483 |
56,630 |
| 20% |
20.0% |
37,656 |
37,679 |
| 10% |
10.0% |
18,828 |
18,873 |
| Active Idle |
|
0 |
0 |
JVM 'localhost.012' Scores:
| Target Load |
Actual Load |
ssj_ops |
| Target |
Actual |
| Calibration 1 |
|
|
187,388 |
| Calibration 2 |
|
|
187,904 |
| Calibration 3 |
|
|
187,105 |
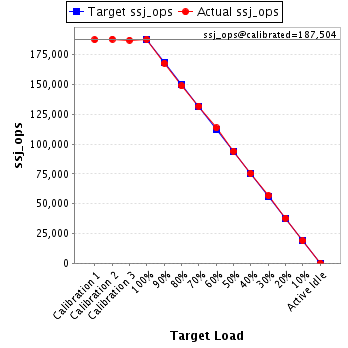
| ssj_ops@calibrated=187,504 |
| 100% |
100.1% |
187,504 |
187,684 |
| 90% |
89.5% |
168,754 |
167,742 |
| 80% |
79.3% |
150,003 |
148,666 |
| 70% |
70.2% |
131,253 |
131,719 |
| 60% |
60.6% |
112,503 |
113,558 |
| 50% |
50.2% |
93,752 |
94,065 |
| 40% |
40.1% |
75,002 |
75,283 |
| 30% |
30.2% |
56,251 |
56,603 |
| 20% |
20.2% |
37,501 |
37,921 |
| 10% |
10.1% |
18,750 |
18,907 |
| Active Idle |
|
0 |
0 |
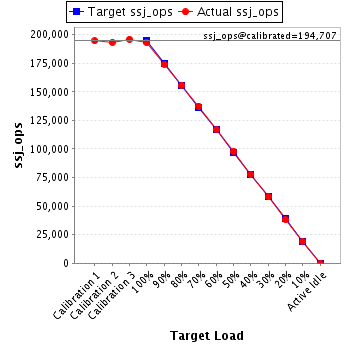
JVM 'localhost.013' Scores:
| Target Load |
Actual Load |
ssj_ops |
| Target |
Actual |
| Calibration 1 |
|
|
194,568 |
| Calibration 2 |
|
|
193,313 |
| Calibration 3 |
|
|
196,101 |
| ssj_ops@calibrated=194,707 |
| 100% |
99.2% |
194,707 |
193,165 |
| 90% |
89.5% |
175,236 |
174,171 |
| 80% |
80.1% |
155,765 |
155,916 |
| 70% |
70.7% |
136,295 |
137,598 |
| 60% |
60.0% |
116,824 |
116,912 |
| 50% |
50.4% |
97,353 |
98,105 |
| 40% |
39.9% |
77,883 |
77,661 |
| 30% |
29.8% |
58,412 |
58,092 |
| 20% |
19.7% |
38,941 |
38,260 |
| 10% |
10.0% |
19,471 |
19,408 |
| Active Idle |
|
0 |
0 |
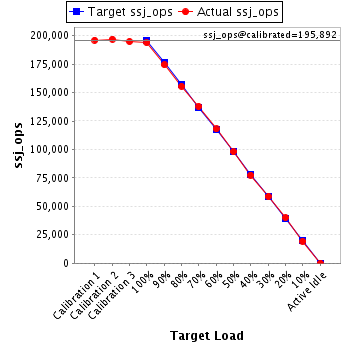
JVM 'localhost.014' Scores:
| Target Load |
Actual Load |
ssj_ops |
| Target |
Actual |
| Calibration 1 |
|
|
196,056 |
| Calibration 2 |
|
|
196,903 |
| Calibration 3 |
|
|
194,881 |
| ssj_ops@calibrated=195,892 |
| 100% |
98.9% |
195,892 |
193,708 |
| 90% |
89.0% |
176,303 |
174,421 |
| 80% |
79.4% |
156,714 |
155,562 |
| 70% |
70.4% |
137,125 |
137,863 |
| 60% |
60.2% |
117,535 |
118,016 |
| 50% |
50.0% |
97,946 |
98,019 |
| 40% |
39.5% |
78,357 |
77,392 |
| 30% |
30.0% |
58,768 |
58,693 |
| 20% |
20.4% |
39,178 |
39,940 |
| 10% |
9.9% |
19,589 |
19,394 |
| Active Idle |
|
0 |
0 |
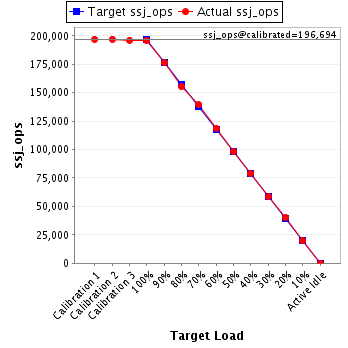
JVM 'localhost.015' Scores:
| Target Load |
Actual Load |
ssj_ops |
| Target |
Actual |
| Calibration 1 |
|
|
197,080 |
| Calibration 2 |
|
|
197,121 |
| Calibration 3 |
|
|
196,268 |
| ssj_ops@calibrated=196,694 |
| 100% |
99.7% |
196,694 |
196,046 |
| 90% |
89.7% |
177,025 |
176,350 |
| 80% |
78.9% |
157,355 |
155,131 |
| 70% |
70.8% |
137,686 |
139,325 |
| 60% |
60.3% |
118,017 |
118,579 |
| 50% |
49.8% |
98,347 |
98,046 |
| 40% |
40.2% |
78,678 |
79,072 |
| 30% |
29.7% |
59,008 |
58,426 |
| 20% |
20.3% |
39,339 |
39,964 |
| 10% |
10.0% |
19,669 |
19,619 |
| Active Idle |
|
0 |
0 |
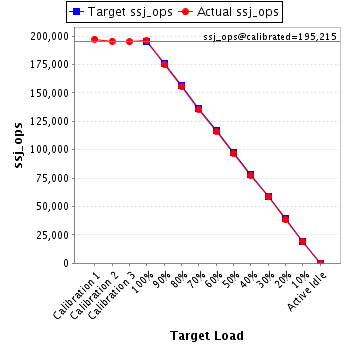
JVM 'localhost.016' Scores:
| Target Load |
Actual Load |
ssj_ops |
| Target |
Actual |
| Calibration 1 |
|
|
197,275 |
| Calibration 2 |
|
|
195,545 |
| Calibration 3 |
|
|
194,886 |
| ssj_ops@calibrated=195,215 |
| 100% |
100.3% |
195,215 |
195,727 |
| 90% |
89.8% |
175,694 |
175,354 |
| 80% |
79.9% |
156,172 |
155,883 |
| 70% |
69.5% |
136,651 |
135,580 |
| 60% |
59.5% |
117,129 |
116,204 |
| 50% |
49.7% |
97,608 |
97,015 |
| 40% |
39.8% |
78,086 |
77,637 |
| 30% |
30.0% |
58,565 |
58,539 |
| 20% |
19.6% |
39,043 |
38,198 |
| 10% |
10.0% |
19,522 |
19,432 |
| Active Idle |
|
0 |
0 |
JVM 'localhost.017' Scores:
| Target Load |
Actual Load |
ssj_ops |
| Target |
Actual |
| Calibration 1 |
|
|
198,766 |
| Calibration 2 |
|
|
198,309 |
| Calibration 3 |
|
|
197,072 |
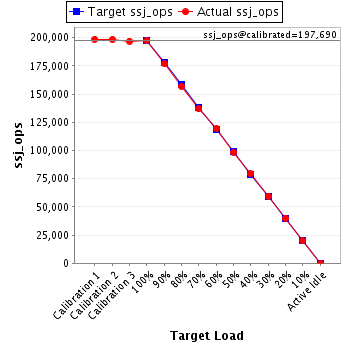
| ssj_ops@calibrated=197,690 |
| 100% |
99.9% |
197,690 |
197,531 |
| 90% |
89.5% |
177,921 |
176,910 |
| 80% |
79.4% |
158,152 |
157,056 |
| 70% |
69.3% |
138,383 |
136,912 |
| 60% |
60.5% |
118,614 |
119,586 |
| 50% |
49.9% |
98,845 |
98,552 |
| 40% |
40.1% |
79,076 |
79,347 |
| 30% |
30.1% |
59,307 |
59,505 |
| 20% |
20.1% |
39,538 |
39,766 |
| 10% |
10.1% |
19,769 |
19,891 |
| Active Idle |
|
0 |
0 |
JVM 'localhost.018' Scores:
| Target Load |
Actual Load |
ssj_ops |
| Target |
Actual |
| Calibration 1 |
|
|
191,844 |
| Calibration 2 |
|
|
190,836 |
| Calibration 3 |
|
|
190,464 |
| ssj_ops@calibrated=190,650 |
| 100% |
99.8% |
190,650 |
190,360 |
| 90% |
89.4% |
171,585 |
170,493 |
| 80% |
79.4% |
152,520 |
151,443 |
| 70% |
70.4% |
133,455 |
134,210 |
| 60% |
59.7% |
114,390 |
113,799 |
| 50% |
49.9% |
95,325 |
95,200 |
| 40% |
40.2% |
76,260 |
76,547 |
| 30% |
30.0% |
57,195 |
57,261 |
| 20% |
20.1% |
38,130 |
38,280 |
| 10% |
10.0% |
19,065 |
19,092 |
| Active Idle |
|
0 |
0 |
JVM 'localhost.019' Scores:
| Target Load |
Actual Load |
ssj_ops |
| Target |
Actual |
| Calibration 1 |
|
|
196,095 |
| Calibration 2 |
|
|
195,386 |
| Calibration 3 |
|
|
197,367 |
| ssj_ops@calibrated=196,376 |
| 100% |
98.9% |
196,376 |
194,230 |
| 90% |
90.0% |
176,738 |
176,796 |
| 80% |
79.5% |
157,101 |
156,182 |
| 70% |
69.3% |
137,463 |
136,181 |
| 60% |
60.0% |
117,826 |
117,790 |
| 50% |
49.9% |
98,188 |
97,958 |
| 40% |
39.9% |
78,550 |
78,308 |
| 30% |
30.5% |
58,913 |
59,802 |
| 20% |
19.7% |
39,275 |
38,728 |
| 10% |
10.1% |
19,638 |
19,761 |
| Active Idle |
|
0 |
0 |
JVM 'localhost.020' Scores:
| Target Load |
Actual Load |
ssj_ops |
| Target |
Actual |
| Calibration 1 |
|
|
191,403 |
| Calibration 2 |
|
|
191,038 |
| Calibration 3 |
|
|
192,233 |
| ssj_ops@calibrated=191,635 |
| 100% |
100.1% |
191,635 |
191,861 |
| 90% |
89.8% |
172,472 |
172,112 |
| 80% |
80.2% |
153,308 |
153,697 |
| 70% |
69.5% |
134,145 |
133,198 |
| 60% |
60.2% |
114,981 |
115,399 |
| 50% |
49.8% |
95,818 |
95,406 |
| 40% |
40.2% |
76,654 |
76,957 |
| 30% |
29.9% |
57,491 |
57,270 |
| 20% |
19.6% |
38,327 |
37,465 |
| 10% |
10.0% |
19,164 |
19,137 |
| Active Idle |
|
0 |
0 |
JVM 'localhost.021' Scores:
| Target Load |
Actual Load |
ssj_ops |
| Target |
Actual |
| Calibration 1 |
|
|
191,264 |
| Calibration 2 |
|
|
191,184 |
| Calibration 3 |
|
|
192,577 |
| ssj_ops@calibrated=191,881 |
| 100% |
99.9% |
191,881 |
191,609 |
| 90% |
89.8% |
172,693 |
172,303 |
| 80% |
80.3% |
153,505 |
153,995 |
| 70% |
70.2% |
134,317 |
134,633 |
| 60% |
59.7% |
115,128 |
114,616 |
| 50% |
49.9% |
95,940 |
95,712 |
| 40% |
39.6% |
76,752 |
75,958 |
| 30% |
30.1% |
57,564 |
57,825 |
| 20% |
19.8% |
38,376 |
38,080 |
| 10% |
10.2% |
19,188 |
19,481 |
| Active Idle |
|
0 |
0 |
JVM 'localhost.022' Scores:
| Target Load |
Actual Load |
ssj_ops |
| Target |
Actual |
| Calibration 1 |
|
|
195,267 |
| Calibration 2 |
|
|
195,519 |
| Calibration 3 |
|
|
195,545 |
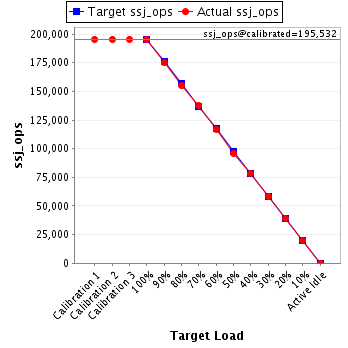
| ssj_ops@calibrated=195,532 |
| 100% |
99.8% |
195,532 |
195,197 |
| 90% |
89.5% |
175,979 |
174,992 |
| 80% |
79.2% |
156,426 |
154,876 |
| 70% |
70.3% |
136,872 |
137,505 |
| 60% |
59.9% |
117,319 |
117,155 |
| 50% |
49.1% |
97,766 |
96,004 |
| 40% |
40.1% |
78,213 |
78,409 |
| 30% |
30.0% |
58,660 |
58,588 |
| 20% |
19.8% |
39,106 |
38,777 |
| 10% |
10.2% |
19,553 |
19,877 |
| Active Idle |
|
0 |
0 |
JVM 'localhost.023' Scores:
| Target Load |
Actual Load |
ssj_ops |
| Target |
Actual |
| Calibration 1 |
|
|
190,089 |
| Calibration 2 |
|
|
190,354 |
| Calibration 3 |
|
|
188,976 |
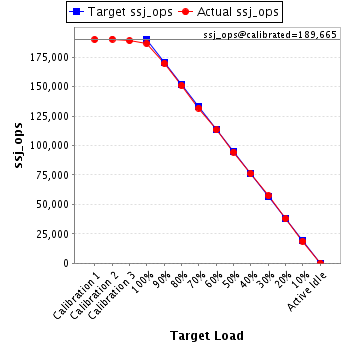
| ssj_ops@calibrated=189,665 |
| 100% |
98.4% |
189,665 |
186,615 |
| 90% |
89.5% |
170,698 |
169,660 |
| 80% |
79.5% |
151,732 |
150,840 |
| 70% |
69.5% |
132,765 |
131,739 |
| 60% |
59.7% |
113,799 |
113,252 |
| 50% |
49.8% |
94,832 |
94,466 |
| 40% |
40.1% |
75,866 |
76,049 |
| 30% |
30.2% |
56,899 |
57,261 |
| 20% |
19.9% |
37,933 |
37,810 |
| 10% |
9.9% |
18,966 |
18,725 |
| Active Idle |
|
0 |
0 |
JVM 'localhost.024' Scores:
| Target Load |
Actual Load |
ssj_ops |
| Target |
Actual |
| Calibration 1 |
|
|
193,907 |
| Calibration 2 |
|
|
188,957 |
| Calibration 3 |
|
|
192,333 |
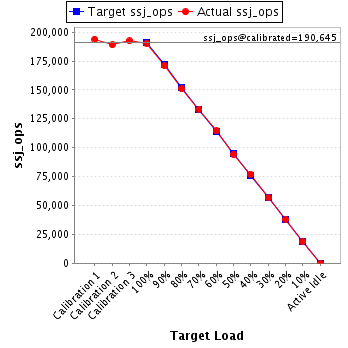
| ssj_ops@calibrated=190,645 |
| 100% |
99.9% |
190,645 |
190,492 |
| 90% |
89.7% |
171,580 |
171,066 |
| 80% |
79.1% |
152,516 |
150,863 |
| 70% |
70.0% |
133,451 |
133,451 |
| 60% |
60.0% |
114,387 |
114,476 |
| 50% |
49.4% |
95,322 |
94,219 |
| 40% |
40.4% |
76,258 |
77,074 |
| 30% |
29.7% |
57,193 |
56,699 |
| 20% |
20.0% |
38,129 |
38,179 |
| 10% |
9.8% |
19,064 |
18,692 |
| Active Idle |
|
0 |
0 |
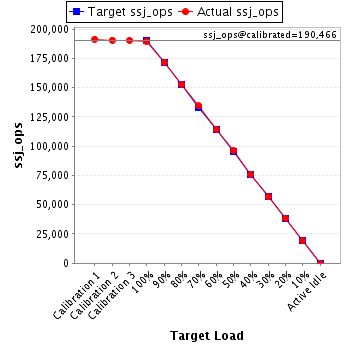
JVM 'localhost.025' Scores:
| Target Load |
Actual Load |
ssj_ops |
| Target |
Actual |
| Calibration 1 |
|
|
191,352 |
| Calibration 2 |
|
|
190,529 |
| Calibration 3 |
|
|
190,402 |
| ssj_ops@calibrated=190,466 |
| 100% |
99.6% |
190,466 |
189,628 |
| 90% |
90.1% |
171,419 |
171,585 |
| 80% |
80.3% |
152,372 |
152,899 |
| 70% |
70.5% |
133,326 |
134,298 |
| 60% |
60.2% |
114,279 |
114,627 |
| 50% |
50.4% |
95,233 |
96,036 |
| 40% |
39.9% |
76,186 |
75,998 |
| 30% |
29.7% |
57,140 |
56,586 |
| 20% |
20.3% |
38,093 |
38,611 |
| 10% |
10.1% |
19,047 |
19,161 |
| Active Idle |
|
0 |
0 |
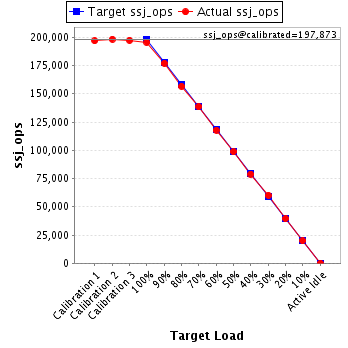
JVM 'localhost.026' Scores:
| Target Load |
Actual Load |
ssj_ops |
| Target |
Actual |
| Calibration 1 |
|
|
196,845 |
| Calibration 2 |
|
|
198,330 |
| Calibration 3 |
|
|
197,417 |
| ssj_ops@calibrated=197,873 |
| 100% |
98.8% |
197,873 |
195,446 |
| 90% |
89.4% |
178,086 |
176,958 |
| 80% |
79.2% |
158,298 |
156,628 |
| 70% |
70.0% |
138,511 |
138,558 |
| 60% |
59.6% |
118,724 |
117,878 |
| 50% |
49.8% |
98,937 |
98,639 |
| 40% |
39.9% |
79,149 |
78,992 |
| 30% |
30.4% |
59,362 |
60,163 |
| 20% |
20.0% |
39,575 |
39,535 |
| 10% |
10.1% |
19,787 |
19,940 |
| Active Idle |
|
0 |
0 |
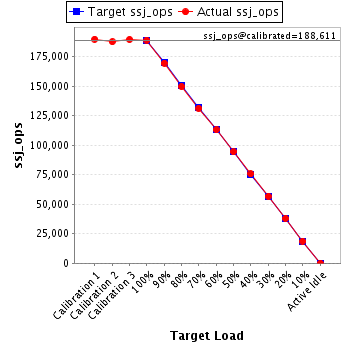
JVM 'localhost.027' Scores:
| Target Load |
Actual Load |
ssj_ops |
| Target |
Actual |
| Calibration 1 |
|
|
189,921 |
| Calibration 2 |
|
|
187,629 |
| Calibration 3 |
|
|
189,594 |
| ssj_ops@calibrated=188,611 |
| 100% |
100.3% |
188,611 |
189,101 |
| 90% |
89.9% |
169,750 |
169,595 |
| 80% |
79.4% |
150,889 |
149,678 |
| 70% |
69.6% |
132,028 |
131,364 |
| 60% |
60.0% |
113,167 |
113,158 |
| 50% |
50.0% |
94,306 |
94,358 |
| 40% |
40.1% |
75,444 |
75,682 |
| 30% |
30.1% |
56,583 |
56,831 |
| 20% |
20.2% |
37,722 |
38,043 |
| 10% |
10.0% |
18,861 |
18,788 |
| Active Idle |
|
0 |
0 |
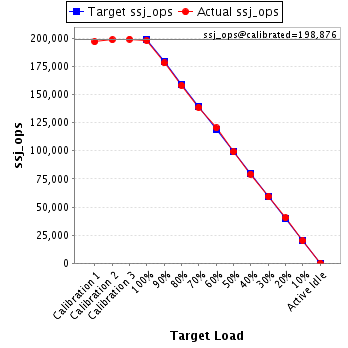
JVM 'localhost.028' Scores:
| Target Load |
Actual Load |
ssj_ops |
| Target |
Actual |
| Calibration 1 |
|
|
196,814 |
| Calibration 2 |
|
|
198,535 |
| Calibration 3 |
|
|
199,217 |
| ssj_ops@calibrated=198,876 |
| 100% |
99.5% |
198,876 |
197,935 |
| 90% |
89.5% |
178,988 |
178,055 |
| 80% |
79.4% |
159,101 |
157,919 |
| 70% |
69.7% |
139,213 |
138,557 |
| 60% |
60.5% |
119,326 |
120,403 |
| 50% |
49.8% |
99,438 |
98,978 |
| 40% |
39.8% |
79,550 |
79,205 |
| 30% |
29.8% |
59,663 |
59,278 |
| 20% |
20.3% |
39,775 |
40,305 |
| 10% |
10.1% |
19,888 |
19,994 |
| Active Idle |
|
0 |
0 |
JVM 'localhost.029' Scores:
| Target Load |
Actual Load |
ssj_ops |
| Target |
Actual |
| Calibration 1 |
|
|
191,452 |
| Calibration 2 |
|
|
189,731 |
| Calibration 3 |
|
|
190,005 |
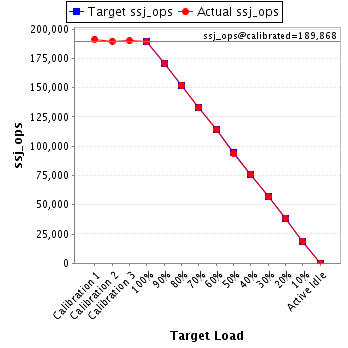
| ssj_ops@calibrated=189,868 |
| 100% |
99.6% |
189,868 |
189,037 |
| 90% |
89.9% |
170,881 |
170,687 |
| 80% |
80.1% |
151,894 |
152,058 |
| 70% |
70.1% |
132,907 |
133,025 |
| 60% |
60.2% |
113,921 |
114,359 |
| 50% |
49.4% |
94,934 |
93,808 |
| 40% |
40.0% |
75,947 |
76,026 |
| 30% |
29.9% |
56,960 |
56,865 |
| 20% |
20.3% |
37,974 |
38,468 |
| 10% |
10.0% |
18,987 |
18,978 |
| Active Idle |
|
0 |
0 |
JVM 'localhost.030' Scores:
| Target Load |
Actual Load |
ssj_ops |
| Target |
Actual |
| Calibration 1 |
|
|
192,851 |
| Calibration 2 |
|
|
195,669 |
| Calibration 3 |
|
|
193,617 |
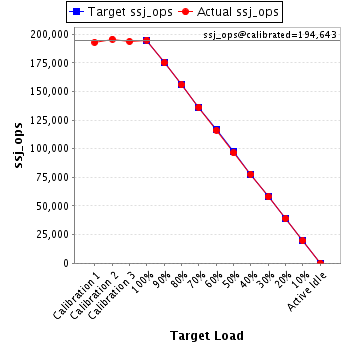
| ssj_ops@calibrated=194,643 |
| 100% |
100.1% |
194,643 |
194,916 |
| 90% |
89.9% |
175,179 |
175,041 |
| 80% |
80.0% |
155,714 |
155,699 |
| 70% |
70.0% |
136,250 |
136,259 |
| 60% |
59.7% |
116,786 |
116,124 |
| 50% |
49.5% |
97,321 |
96,419 |
| 40% |
39.9% |
77,857 |
77,745 |
| 30% |
29.8% |
58,393 |
57,952 |
| 20% |
20.0% |
38,929 |
38,979 |
| 10% |
10.1% |
19,464 |
19,663 |
| Active Idle |
|
0 |
0 |
JVM 'localhost.031' Scores:
| Target Load |
Actual Load |
ssj_ops |
| Target |
Actual |
| Calibration 1 |
|
|
191,019 |
| Calibration 2 |
|
|
189,477 |
| Calibration 3 |
|
|
189,162 |
| ssj_ops@calibrated=189,319 |
| 100% |
99.6% |
189,319 |
188,544 |
| 90% |
89.8% |
170,387 |
169,956 |
| 80% |
79.4% |
151,455 |
150,303 |
| 70% |
70.6% |
132,524 |
133,683 |
| 60% |
60.2% |
113,592 |
113,899 |
| 50% |
49.7% |
94,660 |
94,183 |
| 40% |
39.5% |
75,728 |
74,690 |
| 30% |
29.7% |
56,796 |
56,259 |
| 20% |
20.0% |
37,864 |
37,930 |
| 10% |
10.1% |
18,932 |
19,162 |
| Active Idle |
|
0 |
0 |
JVM 'localhost.032' Scores:
| Target Load |
Actual Load |
ssj_ops |
| Target |
Actual |
| Calibration 1 |
|
|
198,112 |
| Calibration 2 |
|
|
197,200 |
| Calibration 3 |
|
|
200,105 |
| ssj_ops@calibrated=198,653 |
| 100% |
99.2% |
198,653 |
196,975 |
| 90% |
89.3% |
178,787 |
177,456 |
| 80% |
79.1% |
158,922 |
157,062 |
| 70% |
69.3% |
139,057 |
137,642 |
| 60% |
60.0% |
119,192 |
119,212 |
| 50% |
49.9% |
99,326 |
99,147 |
| 40% |
39.8% |
79,461 |
79,033 |
| 30% |
29.8% |
59,596 |
59,113 |
| 20% |
19.7% |
39,731 |
39,185 |
| 10% |
10.0% |
19,865 |
19,869 |
| Active Idle |
|
0 |
0 |
JVM 'localhost.033' Scores:
| Target Load |
Actual Load |
ssj_ops |
| Target |
Actual |
| Calibration 1 |
|
|
189,403 |
| Calibration 2 |
|
|
189,286 |
| Calibration 3 |
|
|
189,325 |
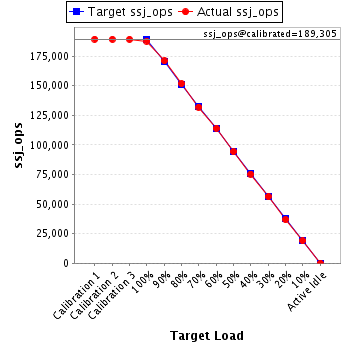
| ssj_ops@calibrated=189,305 |
| 100% |
99.2% |
189,305 |
187,726 |
| 90% |
90.4% |
170,375 |
171,038 |
| 80% |
80.2% |
151,444 |
151,832 |
| 70% |
69.8% |
132,514 |
132,046 |
| 60% |
60.3% |
113,583 |
114,062 |
| 50% |
49.8% |
94,653 |
94,329 |
| 40% |
39.8% |
75,722 |
75,394 |
| 30% |
29.8% |
56,792 |
56,374 |
| 20% |
19.5% |
37,861 |
36,917 |
| 10% |
10.1% |
18,931 |
19,075 |
| Active Idle |
|
0 |
0 |
JVM 'localhost.034' Scores:
| Target Load |
Actual Load |
ssj_ops |
| Target |
Actual |
| Calibration 1 |
|
|
195,309 |
| Calibration 2 |
|
|
195,862 |
| Calibration 3 |
|
|
196,242 |
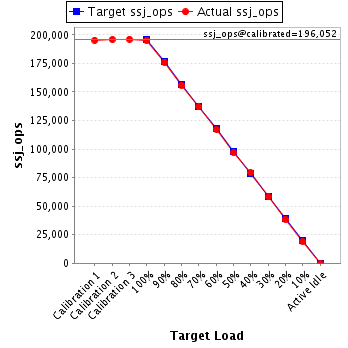
| ssj_ops@calibrated=196,052 |
| 100% |
99.6% |
196,052 |
195,345 |
| 90% |
89.9% |
176,447 |
176,159 |
| 80% |
79.6% |
156,842 |
156,065 |
| 70% |
69.9% |
137,236 |
137,089 |
| 60% |
59.9% |
117,631 |
117,500 |
| 50% |
49.5% |
98,026 |
97,108 |
| 40% |
40.4% |
78,421 |
79,241 |
| 30% |
29.7% |
58,816 |
58,132 |
| 20% |
19.7% |
39,210 |
38,681 |
| 10% |
9.8% |
19,605 |
19,130 |
| Active Idle |
|
0 |
0 |
JVM 'localhost.035' Scores:
| Target Load |
Actual Load |
ssj_ops |
| Target |
Actual |
| Calibration 1 |
|
|
189,805 |
| Calibration 2 |
|
|
190,628 |
| Calibration 3 |
|
|
190,357 |
| ssj_ops@calibrated=190,492 |
| 100% |
99.8% |
190,492 |
190,022 |
| 90% |
89.7% |
171,443 |
170,918 |
| 80% |
80.2% |
152,394 |
152,845 |
| 70% |
69.9% |
133,345 |
133,087 |
| 60% |
60.3% |
114,295 |
114,841 |
| 50% |
50.1% |
95,246 |
95,528 |
| 40% |
40.3% |
76,197 |
76,708 |
| 30% |
30.4% |
57,148 |
57,914 |
| 20% |
20.0% |
38,098 |
38,178 |
| 10% |
9.9% |
19,049 |
18,884 |
| Active Idle |
|
0 |
0 |
JVM 'localhost.036' Scores:
| Target Load |
Actual Load |
ssj_ops |
| Target |
Actual |
| Calibration 1 |
|
|
193,139 |
| Calibration 2 |
|
|
191,800 |
| Calibration 3 |
|
|
192,020 |
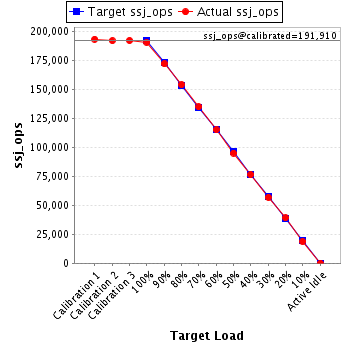
| ssj_ops@calibrated=191,910 |
| 100% |
99.2% |
191,910 |
190,419 |
| 90% |
89.6% |
172,719 |
171,879 |
| 80% |
80.2% |
153,528 |
153,854 |
| 70% |
70.2% |
134,337 |
134,762 |
| 60% |
60.0% |
115,146 |
115,078 |
| 50% |
49.5% |
95,955 |
95,010 |
| 40% |
39.7% |
76,764 |
76,255 |
| 30% |
29.6% |
57,573 |
56,753 |
| 20% |
20.3% |
38,382 |
39,013 |
| 10% |
9.8% |
19,191 |
18,738 |
| Active Idle |
|
0 |
0 |
JVM 'localhost.037' Scores:
| Target Load |
Actual Load |
ssj_ops |
| Target |
Actual |
| Calibration 1 |
|
|
194,976 |
| Calibration 2 |
|
|
193,856 |
| Calibration 3 |
|
|
194,590 |
| ssj_ops@calibrated=194,223 |
| 100% |
99.3% |
194,223 |
192,956 |
| 90% |
89.8% |
174,800 |
174,367 |
| 80% |
79.7% |
155,378 |
154,868 |
| 70% |
69.9% |
135,956 |
135,795 |
| 60% |
60.0% |
116,534 |
116,615 |
| 50% |
50.3% |
97,111 |
97,709 |
| 40% |
39.9% |
77,689 |
77,503 |
| 30% |
30.2% |
58,267 |
58,699 |
| 20% |
19.9% |
38,845 |
38,618 |
| 10% |
10.0% |
19,422 |
19,503 |
| Active Idle |
|
0 |
0 |
JVM 'localhost.038' Scores:
| Target Load |
Actual Load |
ssj_ops |
| Target |
Actual |
| Calibration 1 |
|
|
191,684 |
| Calibration 2 |
|
|
189,513 |
| Calibration 3 |
|
|
188,761 |
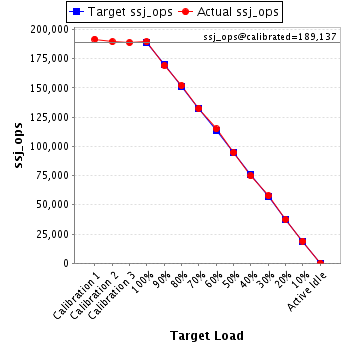
| ssj_ops@calibrated=189,137 |
| 100% |
100.2% |
189,137 |
189,577 |
| 90% |
89.4% |
170,223 |
169,054 |
| 80% |
80.3% |
151,310 |
151,917 |
| 70% |
70.0% |
132,396 |
132,450 |
| 60% |
60.7% |
113,482 |
114,861 |
| 50% |
50.1% |
94,569 |
94,781 |
| 40% |
39.5% |
75,655 |
74,664 |
| 30% |
30.5% |
56,741 |
57,610 |
| 20% |
19.8% |
37,827 |
37,408 |
| 10% |
10.0% |
18,914 |
18,919 |
| Active Idle |
|
0 |
0 |
JVM 'localhost.039' Scores:
| Target Load |
Actual Load |
ssj_ops |
| Target |
Actual |
| Calibration 1 |
|
|
196,475 |
| Calibration 2 |
|
|
195,182 |
| Calibration 3 |
|
|
195,669 |
| ssj_ops@calibrated=195,425 |
| 100% |
99.7% |
195,425 |
194,935 |
| 90% |
90.2% |
175,883 |
176,311 |
| 80% |
80.2% |
156,340 |
156,725 |
| 70% |
70.3% |
136,798 |
137,366 |
| 60% |
60.0% |
117,255 |
117,192 |
| 50% |
49.4% |
97,713 |
96,493 |
| 40% |
40.0% |
78,170 |
78,206 |
| 30% |
29.9% |
58,628 |
58,393 |
| 20% |
19.7% |
39,085 |
38,554 |
| 10% |
9.9% |
19,543 |
19,259 |
| Active Idle |
|
0 |
0 |
JVM 'localhost.040' Scores:
| Target Load |
Actual Load |
ssj_ops |
| Target |
Actual |
| Calibration 1 |
|
|
191,407 |
| Calibration 2 |
|
|
191,449 |
| Calibration 3 |
|
|
192,446 |
| ssj_ops@calibrated=191,948 |
| 100% |
99.4% |
191,948 |
190,752 |
| 90% |
89.5% |
172,753 |
171,764 |
| 80% |
79.6% |
153,558 |
152,711 |
| 70% |
70.5% |
134,363 |
135,278 |
| 60% |
59.1% |
115,169 |
113,403 |
| 50% |
49.8% |
95,974 |
95,606 |
| 40% |
39.9% |
76,779 |
76,539 |
| 30% |
30.0% |
57,584 |
57,613 |
| 20% |
20.2% |
38,390 |
38,701 |
| 10% |
10.1% |
19,195 |
19,311 |
| Active Idle |
|
0 |
0 |
JVM 'localhost.041' Scores:
| Target Load |
Actual Load |
ssj_ops |
| Target |
Actual |
| Calibration 1 |
|
|
184,285 |
| Calibration 2 |
|
|
190,139 |
| Calibration 3 |
|
|
190,634 |
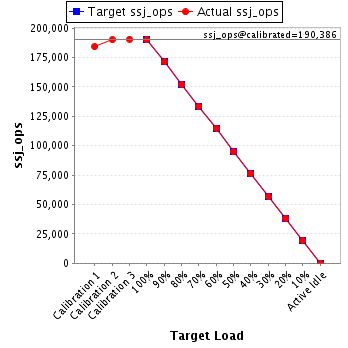
| ssj_ops@calibrated=190,386 |
| 100% |
99.9% |
190,386 |
190,104 |
| 90% |
89.9% |
171,348 |
171,244 |
| 80% |
79.8% |
152,309 |
151,934 |
| 70% |
70.1% |
133,271 |
133,512 |
| 60% |
60.4% |
114,232 |
115,027 |
| 50% |
49.8% |
95,193 |
94,799 |
| 40% |
39.9% |
76,155 |
76,057 |
| 30% |
29.8% |
57,116 |
56,749 |
| 20% |
19.9% |
38,077 |
37,973 |
| 10% |
10.0% |
19,039 |
19,103 |
| Active Idle |
|
0 |
0 |
JVM 'localhost.042' Scores:
| Target Load |
Actual Load |
ssj_ops |
| Target |
Actual |
| Calibration 1 |
|
|
193,215 |
| Calibration 2 |
|
|
192,459 |
| Calibration 3 |
|
|
194,241 |
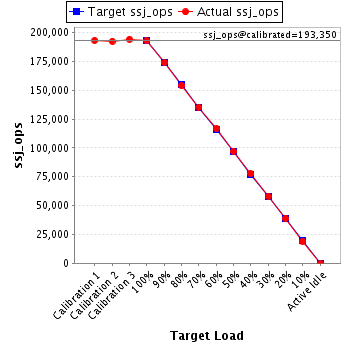
| ssj_ops@calibrated=193,350 |
| 100% |
99.6% |
193,350 |
192,672 |
| 90% |
89.9% |
174,015 |
173,892 |
| 80% |
79.6% |
154,680 |
153,900 |
| 70% |
70.0% |
135,345 |
135,429 |
| 60% |
60.5% |
116,010 |
116,920 |
| 50% |
50.2% |
96,675 |
97,109 |
| 40% |
40.3% |
77,340 |
77,835 |
| 30% |
30.1% |
58,005 |
58,182 |
| 20% |
20.1% |
38,670 |
38,775 |
| 10% |
9.9% |
19,335 |
19,134 |
| Active Idle |
|
0 |
0 |
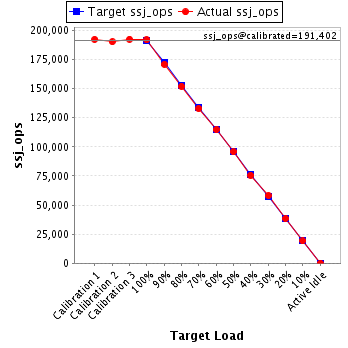
JVM 'localhost.043' Scores:
| Target Load |
Actual Load |
ssj_ops |
| Target |
Actual |
| Calibration 1 |
|
|
192,406 |
| Calibration 2 |
|
|
190,263 |
| Calibration 3 |
|
|
192,541 |
| ssj_ops@calibrated=191,402 |
| 100% |
100.3% |
191,402 |
191,984 |
| 90% |
89.3% |
172,262 |
170,965 |
| 80% |
79.4% |
153,121 |
151,973 |
| 70% |
69.5% |
133,981 |
133,005 |
| 60% |
60.0% |
114,841 |
114,818 |
| 50% |
50.0% |
95,701 |
95,709 |
| 40% |
39.5% |
76,561 |
75,519 |
| 30% |
30.3% |
57,421 |
58,088 |
| 20% |
20.1% |
38,280 |
38,396 |
| 10% |
10.0% |
19,140 |
19,154 |
| Active Idle |
|
0 |
0 |
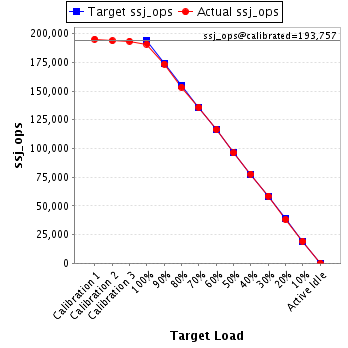
JVM 'localhost.044' Scores:
| Target Load |
Actual Load |
ssj_ops |
| Target |
Actual |
| Calibration 1 |
|
|
195,276 |
| Calibration 2 |
|
|
193,936 |
| Calibration 3 |
|
|
193,578 |
| ssj_ops@calibrated=193,757 |
| 100% |
98.6% |
193,757 |
191,032 |
| 90% |
89.6% |
174,381 |
173,545 |
| 80% |
79.2% |
155,006 |
153,477 |
| 70% |
70.2% |
135,630 |
135,973 |
| 60% |
60.1% |
116,254 |
116,528 |
| 50% |
49.6% |
96,878 |
96,117 |
| 40% |
40.1% |
77,503 |
77,778 |
| 30% |
30.2% |
58,127 |
58,601 |
| 20% |
19.7% |
38,751 |
38,156 |
| 10% |
9.9% |
19,376 |
19,149 |
| Active Idle |
|
0 |
0 |
JVM 'localhost.045' Scores:
| Target Load |
Actual Load |
ssj_ops |
| Target |
Actual |
| Calibration 1 |
|
|
194,575 |
| Calibration 2 |
|
|
194,041 |
| Calibration 3 |
|
|
195,235 |
| ssj_ops@calibrated=194,638 |
| 100% |
100.1% |
194,638 |
194,756 |
| 90% |
90.1% |
175,174 |
175,410 |
| 80% |
79.7% |
155,710 |
155,151 |
| 70% |
69.1% |
136,247 |
134,484 |
| 60% |
59.7% |
116,783 |
116,264 |
| 50% |
49.9% |
97,319 |
97,085 |
| 40% |
40.0% |
77,855 |
77,842 |
| 30% |
29.8% |
58,391 |
58,042 |
| 20% |
20.1% |
38,928 |
39,118 |
| 10% |
9.8% |
19,464 |
19,101 |
| Active Idle |
|
0 |
0 |
JVM 'localhost.046' Scores:
| Target Load |
Actual Load |
ssj_ops |
| Target |
Actual |
| Calibration 1 |
|
|
193,399 |
| Calibration 2 |
|
|
193,322 |
| Calibration 3 |
|
|
190,870 |
| ssj_ops@calibrated=192,096 |
| 100% |
99.0% |
192,096 |
190,134 |
| 90% |
90.0% |
172,887 |
172,827 |
| 80% |
79.8% |
153,677 |
153,279 |
| 70% |
70.1% |
134,467 |
134,585 |
| 60% |
58.9% |
115,258 |
113,211 |
| 50% |
50.0% |
96,048 |
96,085 |
| 40% |
39.5% |
76,838 |
75,790 |
| 30% |
30.0% |
57,629 |
57,628 |
| 20% |
20.1% |
38,419 |
38,656 |
| 10% |
9.9% |
19,210 |
18,977 |
| Active Idle |
|
0 |
0 |
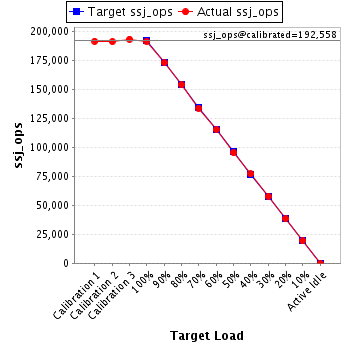
JVM 'localhost.047' Scores:
| Target Load |
Actual Load |
ssj_ops |
| Target |
Actual |
| Calibration 1 |
|
|
191,856 |
| Calibration 2 |
|
|
191,512 |
| Calibration 3 |
|
|
193,604 |
| ssj_ops@calibrated=192,558 |
| 100% |
99.6% |
192,558 |
191,826 |
| 90% |
90.0% |
173,302 |
173,210 |
| 80% |
80.0% |
154,047 |
154,042 |
| 70% |
69.6% |
134,791 |
134,049 |
| 60% |
60.0% |
115,535 |
115,595 |
| 50% |
49.6% |
96,279 |
95,597 |
| 40% |
40.1% |
77,023 |
77,130 |
| 30% |
30.0% |
57,767 |
57,814 |
| 20% |
19.9% |
38,512 |
38,318 |
| 10% |
10.0% |
19,256 |
19,278 |
| Active Idle |
|
0 |
0 |
JVM 'localhost.048' Scores:
| Target Load |
Actual Load |
ssj_ops |
| Target |
Actual |
| Calibration 1 |
|
|
192,606 |
| Calibration 2 |
|
|
190,626 |
| Calibration 3 |
|
|
190,810 |
| ssj_ops@calibrated=190,718 |
| 100% |
99.6% |
190,718 |
189,927 |
| 90% |
89.3% |
171,646 |
170,335 |
| 80% |
79.9% |
152,575 |
152,420 |
| 70% |
70.0% |
133,503 |
133,595 |
| 60% |
60.5% |
114,431 |
115,441 |
| 50% |
49.9% |
95,359 |
95,077 |
| 40% |
39.7% |
76,287 |
75,801 |
| 30% |
29.8% |
57,215 |
56,784 |
| 20% |
20.2% |
38,144 |
38,446 |
| 10% |
10.0% |
19,072 |
19,039 |
| Active Idle |
|
0 |
0 |
JVM 'localhost.049' Scores:
| Target Load |
Actual Load |
ssj_ops |
| Target |
Actual |
| Calibration 1 |
|
|
196,514 |
| Calibration 2 |
|
|
197,427 |
| Calibration 3 |
|
|
197,240 |
| ssj_ops@calibrated=197,333 |
| 100% |
99.8% |
197,333 |
196,920 |
| 90% |
90.4% |
177,600 |
178,482 |
| 80% |
80.0% |
157,867 |
157,923 |
| 70% |
69.6% |
138,133 |
137,416 |
| 60% |
59.5% |
118,400 |
117,492 |
| 50% |
50.3% |
98,667 |
99,353 |
| 40% |
40.1% |
78,933 |
79,170 |
| 30% |
30.4% |
59,200 |
60,041 |
| 20% |
19.9% |
39,467 |
39,218 |
| 10% |
10.1% |
19,733 |
19,916 |
| Active Idle |
|
0 |
0 |
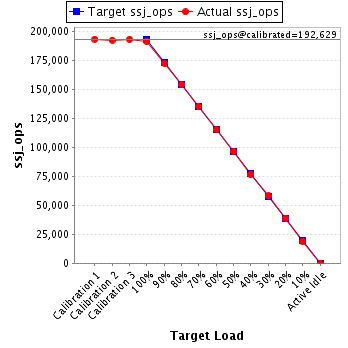
JVM 'localhost.050' Scores:
| Target Load |
Actual Load |
ssj_ops |
| Target |
Actual |
| Calibration 1 |
|
|
193,063 |
| Calibration 2 |
|
|
192,266 |
| Calibration 3 |
|
|
192,992 |
| ssj_ops@calibrated=192,629 |
| 100% |
99.3% |
192,629 |
191,347 |
| 90% |
89.5% |
173,366 |
172,410 |
| 80% |
79.9% |
154,103 |
153,889 |
| 70% |
70.1% |
134,840 |
135,102 |
| 60% |
59.8% |
115,577 |
115,177 |
| 50% |
50.1% |
96,314 |
96,426 |
| 40% |
39.8% |
77,052 |
76,624 |
| 30% |
30.1% |
57,789 |
57,961 |
| 20% |
20.1% |
38,526 |
38,634 |
| 10% |
9.9% |
19,263 |
18,982 |
| Active Idle |
|
0 |
0 |
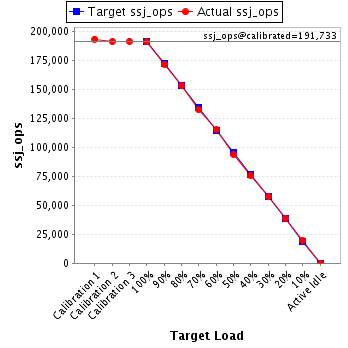
JVM 'localhost.051' Scores:
| Target Load |
Actual Load |
ssj_ops |
| Target |
Actual |
| Calibration 1 |
|
|
193,559 |
| Calibration 2 |
|
|
191,610 |
| Calibration 3 |
|
|
191,857 |
| ssj_ops@calibrated=191,733 |
| 100% |
99.7% |
191,733 |
191,126 |
| 90% |
89.7% |
172,560 |
172,066 |
| 80% |
80.0% |
153,387 |
153,395 |
| 70% |
69.2% |
134,213 |
132,619 |
| 60% |
60.2% |
115,040 |
115,486 |
| 50% |
49.0% |
95,867 |
94,044 |
| 40% |
39.5% |
76,693 |
75,766 |
| 30% |
30.0% |
57,520 |
57,439 |
| 20% |
20.0% |
38,347 |
38,375 |
| 10% |
10.1% |
19,173 |
19,346 |
| Active Idle |
|
0 |
0 |
JVM 'localhost.052' Scores:
| Target Load |
Actual Load |
ssj_ops |
| Target |
Actual |
| Calibration 1 |
|
|
191,806 |
| Calibration 2 |
|
|
193,404 |
| Calibration 3 |
|
|
193,579 |
| ssj_ops@calibrated=193,492 |
| 100% |
99.2% |
193,492 |
191,989 |
| 90% |
89.7% |
174,142 |
173,482 |
| 80% |
79.6% |
154,793 |
154,037 |
| 70% |
69.6% |
135,444 |
134,621 |
| 60% |
59.7% |
116,095 |
115,576 |
| 50% |
50.1% |
96,746 |
96,906 |
| 40% |
40.2% |
77,397 |
77,807 |
| 30% |
30.2% |
58,047 |
58,377 |
| 20% |
20.5% |
38,698 |
39,692 |
| 10% |
9.9% |
19,349 |
19,240 |
| Active Idle |
|
0 |
0 |
JVM 'localhost.053' Scores:
| Target Load |
Actual Load |
ssj_ops |
| Target |
Actual |
| Calibration 1 |
|
|
187,332 |
| Calibration 2 |
|
|
186,735 |
| Calibration 3 |
|
|
188,123 |
| ssj_ops@calibrated=187,429 |
| 100% |
99.7% |
187,429 |
186,837 |
| 90% |
90.9% |
168,686 |
170,408 |
| 80% |
79.9% |
149,943 |
149,681 |
| 70% |
69.6% |
131,200 |
130,517 |
| 60% |
60.5% |
112,457 |
113,404 |
| 50% |
49.8% |
93,715 |
93,370 |
| 40% |
39.7% |
74,972 |
74,367 |
| 30% |
29.9% |
56,229 |
56,014 |
| 20% |
19.9% |
37,486 |
37,376 |
| 10% |
10.1% |
18,743 |
18,854 |
| Active Idle |
|
0 |
0 |
JVM 'localhost.054' Scores:
| Target Load |
Actual Load |
ssj_ops |
| Target |
Actual |
| Calibration 1 |
|
|
193,316 |
| Calibration 2 |
|
|
193,053 |
| Calibration 3 |
|
|
193,340 |
| ssj_ops@calibrated=193,196 |
| 100% |
99.6% |
193,196 |
192,379 |
| 90% |
89.9% |
173,876 |
173,686 |
| 80% |
79.7% |
154,557 |
153,977 |
| 70% |
69.9% |
135,237 |
134,988 |
| 60% |
60.4% |
115,918 |
116,736 |
| 50% |
49.7% |
96,598 |
95,927 |
| 40% |
39.8% |
77,278 |
76,816 |
| 30% |
29.6% |
57,959 |
57,097 |
| 20% |
20.1% |
38,639 |
38,889 |
| 10% |
9.8% |
19,320 |
18,909 |
| Active Idle |
|
0 |
0 |
JVM 'localhost.055' Scores:
| Target Load |
Actual Load |
ssj_ops |
| Target |
Actual |
| Calibration 1 |
|
|
196,318 |
| Calibration 2 |
|
|
195,932 |
| Calibration 3 |
|
|
196,377 |
| ssj_ops@calibrated=196,154 |
| 100% |
100.8% |
196,154 |
197,725 |
| 90% |
90.0% |
176,539 |
176,556 |
| 80% |
80.1% |
156,923 |
157,204 |
| 70% |
69.9% |
137,308 |
137,143 |
| 60% |
59.6% |
117,692 |
116,989 |
| 50% |
49.8% |
98,077 |
97,707 |
| 40% |
40.7% |
78,462 |
79,930 |
| 30% |
30.0% |
58,846 |
58,859 |
| 20% |
20.1% |
39,231 |
39,395 |
| 10% |
10.3% |
19,615 |
20,198 |
| Active Idle |
|
0 |
0 |
JVM 'localhost.056' Scores:
| Target Load |
Actual Load |
ssj_ops |
| Target |
Actual |
| Calibration 1 |
|
|
189,016 |
| Calibration 2 |
|
|
190,233 |
| Calibration 3 |
|
|
189,634 |
| ssj_ops@calibrated=189,933 |
| 100% |
99.8% |
189,933 |
189,486 |
| 90% |
89.4% |
170,940 |
169,724 |
| 80% |
80.0% |
151,947 |
151,990 |
| 70% |
70.3% |
132,953 |
133,576 |
| 60% |
60.1% |
113,960 |
114,098 |
| 50% |
49.9% |
94,967 |
94,868 |
| 40% |
40.3% |
75,973 |
76,455 |
| 30% |
30.0% |
56,980 |
57,071 |
| 20% |
20.1% |
37,987 |
38,115 |
| 10% |
9.9% |
18,993 |
18,798 |
| Active Idle |
|
0 |
0 |
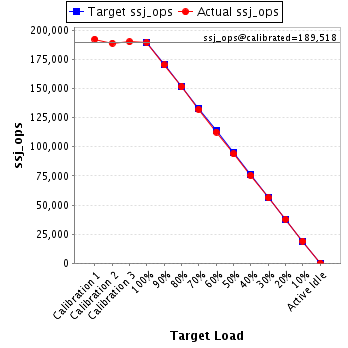
JVM 'localhost.057' Scores:
| Target Load |
Actual Load |
ssj_ops |
| Target |
Actual |
| Calibration 1 |
|
|
192,373 |
| Calibration 2 |
|
|
188,936 |
| Calibration 3 |
|
|
190,100 |
| ssj_ops@calibrated=189,518 |
| 100% |
100.0% |
189,518 |
189,600 |
| 90% |
89.8% |
170,566 |
170,197 |
| 80% |
80.0% |
151,614 |
151,568 |
| 70% |
69.7% |
132,663 |
132,060 |
| 60% |
59.4% |
113,711 |
112,662 |
| 50% |
49.5% |
94,759 |
93,809 |
| 40% |
39.7% |
75,807 |
75,197 |
| 30% |
29.6% |
56,855 |
56,178 |
| 20% |
19.9% |
37,904 |
37,776 |
| 10% |
10.0% |
18,952 |
19,002 |
| Active Idle |
|
0 |
0 |
JVM 'localhost.058' Scores:
| Target Load |
Actual Load |
ssj_ops |
| Target |
Actual |
| Calibration 1 |
|
|
189,964 |
| Calibration 2 |
|
|
194,290 |
| Calibration 3 |
|
|
193,510 |
| ssj_ops@calibrated=193,900 |
| 100% |
99.9% |
193,900 |
193,674 |
| 90% |
89.9% |
174,510 |
174,248 |
| 80% |
80.2% |
155,120 |
155,548 |
| 70% |
69.5% |
135,730 |
134,771 |
| 60% |
60.3% |
116,340 |
116,974 |
| 50% |
49.5% |
96,950 |
95,969 |
| 40% |
40.2% |
77,560 |
77,998 |
| 30% |
30.4% |
58,170 |
59,031 |
| 20% |
20.3% |
38,780 |
39,363 |
| 10% |
10.2% |
19,390 |
19,817 |
| Active Idle |
|
0 |
0 |
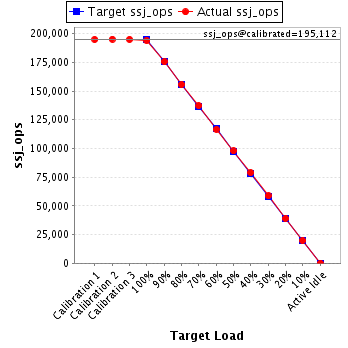
JVM 'localhost.059' Scores:
| Target Load |
Actual Load |
ssj_ops |
| Target |
Actual |
| Calibration 1 |
|
|
194,910 |
| Calibration 2 |
|
|
195,209 |
| Calibration 3 |
|
|
195,015 |
| ssj_ops@calibrated=195,112 |
| 100% |
99.4% |
195,112 |
194,025 |
| 90% |
90.0% |
175,601 |
175,573 |
| 80% |
79.7% |
156,089 |
155,600 |
| 70% |
70.4% |
136,578 |
137,317 |
| 60% |
59.8% |
117,067 |
116,633 |
| 50% |
50.1% |
97,556 |
97,792 |
| 40% |
40.5% |
78,045 |
78,951 |
| 30% |
30.1% |
58,534 |
58,676 |
| 20% |
20.0% |
39,022 |
39,059 |
| 10% |
10.2% |
19,511 |
19,804 |
| Active Idle |
|
0 |
0 |
JVM 'localhost.060' Scores:
| Target Load |
Actual Load |
ssj_ops |
| Target |
Actual |
| Calibration 1 |
|
|
194,463 |
| Calibration 2 |
|
|
193,864 |
| Calibration 3 |
|
|
192,804 |
| ssj_ops@calibrated=193,334 |
| 100% |
100.4% |
193,334 |
194,142 |
| 90% |
89.5% |
174,001 |
173,054 |
| 80% |
80.1% |
154,667 |
154,827 |
| 70% |
70.4% |
135,334 |
136,025 |
| 60% |
59.8% |
116,000 |
115,641 |
| 50% |
50.1% |
96,667 |
96,910 |
| 40% |
40.3% |
77,334 |
77,977 |
| 30% |
30.3% |
58,000 |
58,489 |
| 20% |
19.6% |
38,667 |
37,903 |
| 10% |
9.9% |
19,333 |
19,187 |
| Active Idle |
|
0 |
0 |
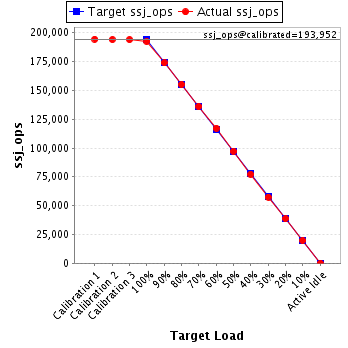
JVM 'localhost.061' Scores:
| Target Load |
Actual Load |
ssj_ops |
| Target |
Actual |
| Calibration 1 |
|
|
194,422 |
| Calibration 2 |
|
|
194,017 |
| Calibration 3 |
|
|
193,886 |
| ssj_ops@calibrated=193,952 |
| 100% |
99.3% |
193,952 |
192,521 |
| 90% |
89.6% |
174,557 |
173,874 |
| 80% |
80.0% |
155,161 |
155,124 |
| 70% |
70.1% |
135,766 |
136,001 |
| 60% |
60.4% |
116,371 |
117,146 |
| 50% |
50.2% |
96,976 |
97,291 |
| 40% |
39.8% |
77,581 |
77,223 |
| 30% |
29.6% |
58,186 |
57,477 |
| 20% |
19.9% |
38,790 |
38,658 |
| 10% |
10.2% |
19,395 |
19,837 |
| Active Idle |
|
0 |
0 |
JVM 'localhost.062' Scores:
| Target Load |
Actual Load |
ssj_ops |
| Target |
Actual |
| Calibration 1 |
|
|
191,825 |
| Calibration 2 |
|
|
191,580 |
| Calibration 3 |
|
|
193,215 |
| ssj_ops@calibrated=192,398 |
| 100% |
99.0% |
192,398 |
190,401 |
| 90% |
90.0% |
173,158 |
173,154 |
| 80% |
80.2% |
153,918 |
154,386 |
| 70% |
70.4% |
134,678 |
135,431 |
| 60% |
59.8% |
115,439 |
115,106 |
| 50% |
50.1% |
96,199 |
96,302 |
| 40% |
40.2% |
76,959 |
77,399 |
| 30% |
29.9% |
57,719 |
57,507 |
| 20% |
20.4% |
38,480 |
39,264 |
| 10% |
10.2% |
19,240 |
19,703 |
| Active Idle |
|
0 |
0 |
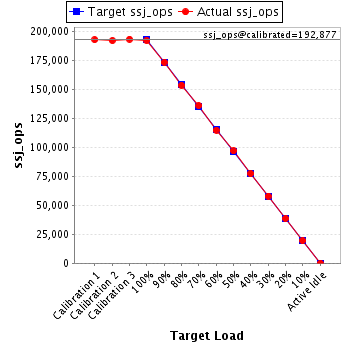
JVM 'localhost.063' Scores:
| Target Load |
Actual Load |
ssj_ops |
| Target |
Actual |
| Calibration 1 |
|
|
192,931 |
| Calibration 2 |
|
|
192,270 |
| Calibration 3 |
|
|
193,484 |
| ssj_ops@calibrated=192,877 |
| 100% |
99.7% |
192,877 |
192,350 |
| 90% |
90.0% |
173,589 |
173,640 |
| 80% |
79.7% |
154,302 |
153,750 |
| 70% |
70.6% |
135,014 |
136,213 |
| 60% |
59.6% |
115,726 |
115,002 |
| 50% |
50.3% |
96,439 |
96,971 |
| 40% |
40.1% |
77,151 |
77,383 |
| 30% |
30.1% |
57,863 |
58,056 |
| 20% |
20.0% |
38,575 |
38,626 |
| 10% |
10.1% |
19,288 |
19,563 |
| Active Idle |
|
0 |
0 |
JVM 'localhost.064' Scores:
| Target Load |
Actual Load |
ssj_ops |
| Target |
Actual |
| Calibration 1 |
|
|
187,601 |
| Calibration 2 |
|
|
187,832 |
| Calibration 3 |
|
|
187,691 |
| ssj_ops@calibrated=187,761 |
| 100% |
99.1% |
187,761 |
186,068 |
| 90% |
90.0% |
168,985 |
168,917 |
| 80% |
79.3% |
150,209 |
148,885 |
| 70% |
69.7% |
131,433 |
130,954 |
| 60% |
60.6% |
112,657 |
113,798 |
| 50% |
49.3% |
93,881 |
92,487 |
| 40% |
39.9% |
75,104 |
74,961 |
| 30% |
30.0% |
56,328 |
56,369 |
| 20% |
19.8% |
37,552 |
37,114 |
| 10% |
9.8% |
18,776 |
18,449 |
| Active Idle |
|
0 |
0 |