SPECpower_ssj2008
Host 'localhost' Performance Report
Copyright © 2007-2021 Standard Performance Evaluation Corporation
| Nettrix R620 G40 | ssj_ops@100% = 7,623,108 ssj_ops@100% per JVM = 1,905,777 |
||||
| Test Sponsor: | Nettrix | SPEC License #: | 6138 | Test Method: | Single Node |
| Tested By: | Nettrix | Test Location: | Beijing, China | Test Date: | Jun 1, 2021 |
| Hardware Availability: | Apr-2021 | Software Availability: | Apr-2021 | Publication: | Jul 29, 2021 |
| System Source: | Single Supplier | System Designation: | Server | Power Provisioning: | Line-powered |
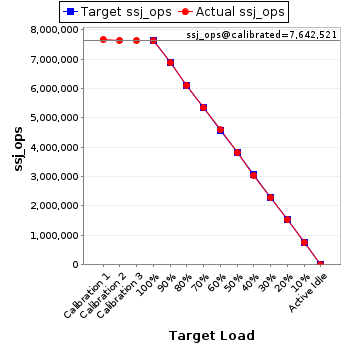
| Target Load | Actual Load | ssj_ops | |
|---|---|---|---|
| Target | Actual | ||
| Calibration 1 | 7,677,269 | ||
| Calibration 2 | 7,645,225 | ||
| Calibration 3 | 7,639,816 | ||
| ssj_ops@calibrated=7,642,521 | |||
| 100% | 99.7% | 7,642,521 | 7,623,108 |
| 90% | 90.0% | 6,878,269 | 6,882,065 |
| 80% | 80.1% | 6,114,016 | 6,118,124 |
| 70% | 69.9% | 5,349,764 | 5,342,375 |
| 60% | 60.0% | 4,585,512 | 4,588,341 |
| 50% | 50.0% | 3,821,260 | 3,819,389 |
| 40% | 39.9% | 3,057,008 | 3,050,822 |
| 30% | 29.9% | 2,292,756 | 2,287,153 |
| 20% | 20.1% | 1,528,504 | 1,532,343 |
| 10% | 10.0% | 764,252 | 765,124 |
| Active Idle | 0 | 0 | |
| Set Identifier: | sut |
| Set Description: | System Under Test |
| # of Identical Nodes: | 1 |
| Comment: | Single Node |
| Hardware | |
|---|---|
| Hardware Vendor: | Nettrix |
| Model: | R620 G40 |
| Form Factor: | 2U |
| CPU Name: | Intel Xeon Platinum 8380 |
| CPU Characteristics: | 40-Core, 2.3GHz, 60MB L3 Cache |
| CPU Frequency (MHz): | 2300 |
| CPU(s) Enabled: | 80 cores, 2 chips, 40 cores/chip |
| Hardware Threads: | 160 (2 / core) |
| CPU(s) Orderable: | 2 chips |
| Primary Cache: | 32 KB I + 48 KB D on chip per core |
| Secondary Cache: | 1280 KB I+D on chip per core |
| Tertiary Cache: | 60 MB I+D on chip per chip |
| Other Cache: | None |
| Memory Amount (GB): | 256 |
| # and size of DIMM: | 16 x 16 GB |
| Memory Details: | 16 x 16GB 2Rx8 PC4-3200Y-R; slots 0, 2, 4, 6, 8, 10, 12, 14, 16, 18, 20, 22, 24, 26, 28 and 30 populated |
| Power Supply Quantity and Rating (W): | 1 x 800 |
| Power Supply Details: | Nettrix PSU 800W, P/N:33000164 |
| Disk Drive: | 1 x 240GB M.2 SATA SSD,P/N:54000798 |
| Disk Controller: | Integrated SATA controller |
| # and type of Network Interface Cards (NICs) Installed: | 1 x 1000BASE-T OCP with 2x RJ45 ports, P/N:C2400204 |
| NICs Enabled in Firmware / OS / Connected: | 2/2/1 |
| Network Speed (Mbit): | 1000 |
| Keyboard: | None |
| Mouse: | None |
| Monitor: | None |
| Optical Drives: | No |
| Other Hardware: | None |
| Software | |
|---|---|
| Power Management: | tuned-adm profile powersave |
| Operating System (OS): | Suse Linux Enterprise Server 15 SP2 |
| OS Version: | 5.3.18-24.61-default |
| Filesystem: | xfs |
| JVM Vendor: | Oracle Corporation |
| JVM Version: | Java HotSpot(TM) 64-Bit Server VM 18.9 (build 11.0.11+9-LTS-194, mixed mode) |
| JVM Command-line Options: | -server -Xmx31744m -Xms31744m -Xmn29696m -XX:SurvivorRatio=1 -XX:TargetSurvivorRatio=99 -XX:ParallelGCThreads=40 -XX:AllocatePrefetchDistance=256 -XX:AllocatePrefetchLines=4 -XX:LoopUnrollLimit=45 -XX:InitialTenuringThreshold=12 -XX:MaxTenuringThreshold=15 -XX:InlineSmallCode=3900 -XX:MaxInlineSize=270 -XX:FreqInlineSize=2500 -XX:+UseTransparentHugePages -XX:+UseParallelOldGC -XX:UseAVX=1 -XX:BiasedLockingStartupDelay=30000 -XX:-UseAdaptiveSizePolicy -XX:-ThreadLocalHandshakes |
| JVM Affinity: | Each JVM instance was affinitized to a cpu node:numactl --cpunodebind=[0,1,2,3] |
| JVM Instances: | 4 |
| JVM Initial Heap (MB): | 31744 |
| JVM Maximum Heap (MB): | 31744 |
| JVM Address Bits: | 64 |
| Boot Firmware Version: | 0PYH001029 |
| Management Firmware Version: | 0.85 |
| Workload Version: | SSJ 1.2.10 |
| Director Location: | Controller |
| Other Software: | None |
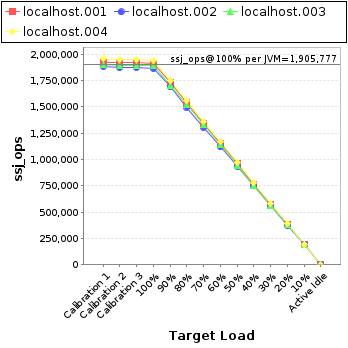
| JVM Instance | ssj_ops@100% |
|---|---|
| localhost.001 | 1,914,672 |
| localhost.002 | 1,869,883 |
| localhost.003 | 1,892,181 |
| localhost.004 | 1,946,373 |
| ssj_ops@100% | 7,623,108 |
| ssj_ops@100% per JVM | 1,905,777 |
| Target Load | Actual Load | ssj_ops | |
|---|---|---|---|
| Target | Actual | ||
| Calibration 1 | 1,923,295 | ||
| Calibration 2 | 1,923,694 | ||
| Calibration 3 | 1,919,431 | ||
| ssj_ops@calibrated=1,921,562 | |||
| 100% | 99.6% | 1,921,562 | 1,914,672 |
| 90% | 90.0% | 1,729,406 | 1,729,145 |
| 80% | 80.1% | 1,537,250 | 1,538,853 |
| 70% | 69.9% | 1,345,094 | 1,343,063 |
| 60% | 60.1% | 1,152,937 | 1,154,739 |
| 50% | 49.9% | 960,781 | 959,692 |
| 40% | 39.9% | 768,625 | 766,576 |
| 30% | 30.0% | 576,469 | 577,001 |
| 20% | 20.0% | 384,312 | 384,336 |
| 10% | 10.0% | 192,156 | 192,234 |
| Active Idle | 0 | 0 | |

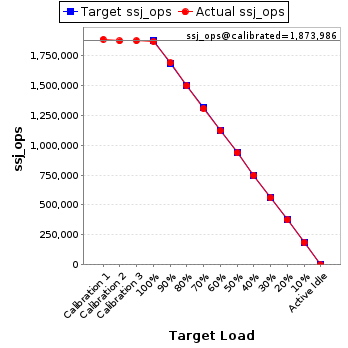
| Target Load | Actual Load | ssj_ops | |
|---|---|---|---|
| Target | Actual | ||
| Calibration 1 | 1,887,442 | ||
| Calibration 2 | 1,873,053 | ||
| Calibration 3 | 1,874,919 | ||
| ssj_ops@calibrated=1,873,986 | |||
| 100% | 99.8% | 1,873,986 | 1,869,883 |
| 90% | 90.2% | 1,686,588 | 1,690,392 |
| 80% | 80.0% | 1,499,189 | 1,498,898 |
| 70% | 69.8% | 1,311,790 | 1,308,850 |
| 60% | 59.8% | 1,124,392 | 1,120,988 |
| 50% | 50.0% | 936,993 | 937,581 |
| 40% | 40.0% | 749,595 | 749,746 |
| 30% | 29.9% | 562,196 | 559,966 |
| 20% | 20.0% | 374,797 | 375,586 |
| 10% | 10.0% | 187,399 | 187,626 |
| Active Idle | 0 | 0 | |
| Target Load | Actual Load | ssj_ops | |
|---|---|---|---|
| Target | Actual | ||
| Calibration 1 | 1,902,836 | ||
| Calibration 2 | 1,895,661 | ||
| Calibration 3 | 1,895,235 | ||
| ssj_ops@calibrated=1,895,448 | |||
| 100% | 99.8% | 1,895,448 | 1,892,181 |
| 90% | 90.1% | 1,705,903 | 1,707,696 |
| 80% | 80.2% | 1,516,358 | 1,520,572 |
| 70% | 70.1% | 1,326,814 | 1,328,904 |
| 60% | 60.1% | 1,137,269 | 1,139,672 |
| 50% | 50.0% | 947,724 | 947,948 |
| 40% | 40.0% | 758,179 | 757,408 |
| 30% | 29.8% | 568,634 | 565,570 |
| 20% | 20.0% | 379,090 | 379,442 |
| 10% | 10.0% | 189,545 | 189,818 |
| Active Idle | 0 | 0 | |

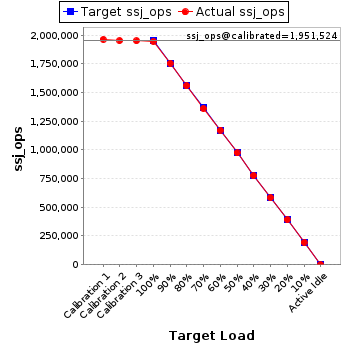
| Target Load | Actual Load | ssj_ops | |
|---|---|---|---|
| Target | Actual | ||
| Calibration 1 | 1,963,695 | ||
| Calibration 2 | 1,952,817 | ||
| Calibration 3 | 1,950,230 | ||
| ssj_ops@calibrated=1,951,524 | |||
| 100% | 99.7% | 1,951,524 | 1,946,373 |
| 90% | 89.9% | 1,756,371 | 1,754,831 |
| 80% | 79.9% | 1,561,219 | 1,559,802 |
| 70% | 69.8% | 1,366,067 | 1,361,558 |
| 60% | 60.1% | 1,170,914 | 1,172,942 |
| 50% | 49.9% | 975,762 | 974,168 |
| 40% | 39.8% | 780,610 | 777,092 |
| 30% | 30.0% | 585,457 | 584,615 |
| 20% | 20.1% | 390,305 | 392,979 |
| 10% | 10.0% | 195,152 | 195,445 |
| Active Idle | 0 | 0 | |