SPECpower_ssj2008
Host 'SUT12' Performance Report
Copyright © 2007-2021 Standard Performance Evaluation Corporation
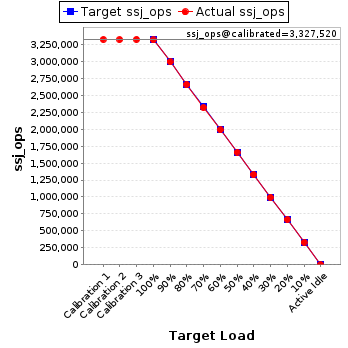
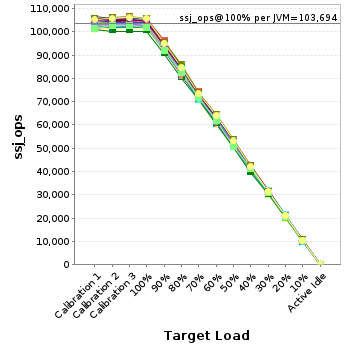
| Hewlett Packard Enterprise ProLiant DL110 Gen10 Plus | ssj_ops@100% = 3,318,199 ssj_ops@100% per JVM = 103,694 |
||||
| Test Sponsor: | Hewlett Packard Enterprise | SPEC License #: | 3 | Test Method: | Single Node |
| Tested By: | Hewlett Packard Enterprise | Test Location: | Houston, TX, USA | Test Date: | Jul 12, 2021 |
| Hardware Availability: | Aug-2021 | Software Availability: | Jun-2021 | Publication: | Aug 31, 2021 |
| System Source: | Single Supplier | System Designation: | Server | Power Provisioning: | Line-powered |
| Target Load | Actual Load | ssj_ops | |
|---|---|---|---|
| Target | Actual | ||
| Calibration 1 | 3,327,877 | ||
| Calibration 2 | 3,325,697 | ||
| Calibration 3 | 3,329,343 | ||
| ssj_ops@calibrated=3,327,520 | |||
| 100% | 99.7% | 3,327,520 | 3,318,199 |
| 90% | 90.1% | 2,994,768 | 2,996,610 |
| 80% | 80.1% | 2,662,016 | 2,663,920 |
| 70% | 69.8% | 2,329,264 | 2,323,252 |
| 60% | 59.8% | 1,996,512 | 1,991,168 |
| 50% | 50.0% | 1,663,760 | 1,662,976 |
| 40% | 40.0% | 1,331,008 | 1,330,630 |
| 30% | 30.0% | 998,256 | 997,346 |
| 20% | 20.1% | 665,504 | 668,831 |
| 10% | 10.0% | 332,752 | 331,877 |
| Active Idle | 0 | 0 | |
| Set Identifier: | SUT |
| Set Description: | System Under Test |
| # of Identical Nodes: | 1 |
| Comment: | SUT |
| Hardware | |
|---|---|
| Hardware Vendor: | Hewlett Packard Enterprise |
| Model: | ProLiant DL110 Gen10 Plus |
| Form Factor: | 1U |
| CPU Name: | Intel Xeon Gold 6314U CPU @ 2.30GHz (Intel Turbo Boost Technology up to 3.4GHz) |
| CPU Characteristics: | 32-Core, 2.30 GHz, 48MB L3 Cache |
| CPU Frequency (MHz): | 2300 |
| CPU(s) Enabled: | 32 cores, 1 chip, 32 cores/chip |
| Hardware Threads: | 64 (2 / core) |
| CPU(s) Orderable: | 1 chip |
| Primary Cache: | 32 KB I + 32 KB D on chip per core |
| Secondary Cache: | 1280 MB I+D on chip per core |
| Tertiary Cache: | 48 MB I+D on chip per chip |
| Other Cache: | None |
| Memory Amount (GB): | 64 |
| # and size of DIMM: | 8 x 8192 MB |
| Memory Details: | 8 x 8GB 1Rx8 PC4-3200-AA-RD1-12; slots 1,2,3,4,5,6,7,8 populated in each socket |
| Power Supply Quantity and Rating (W): | 1 x 700 |
| Power Supply Details: | HPE 700W Flex Slot Platinum Hot Plug Low Halogen AC Power Supply Kit (P44975-B21) |
| Disk Drive: | 1 x HPE 240GB SATA 6G M.2 5300 SSD (P19888-B21) |
| Disk Controller: | None |
| # and type of Network Interface Cards (NICs) Installed: | 1 x Ethernet 10/25Gb 2-port SFP28 MCX562A-ACAI OCP3 Adapter |
| NICs Enabled in Firmware / OS / Connected: | 2/1/1 |
| Network Speed (Mbit): | 1000 |
| Keyboard: | None |
| Mouse: | None |
| Monitor: | None |
| Optical Drives: | No |
| Other Hardware: | None |
| Software | |
|---|---|
| Power Management: | Enabled (see SUT Notes) |
| Operating System (OS): | Windows Server 2019 Datacenter |
| OS Version: | Version 1809 (Build 17763.1132) |
| Filesystem: | NTFS |
| JVM Vendor: | Oracle Corporation |
| JVM Version: | Oracle Java HotSpot(TM) 64-Bit Server VM 18.9 (build 11.0.8+10-LTS, mixed mode) |
| JVM Command-line Options: | -server -Xmn1475m -Xms1675m -Xmx1675m -XX:SurvivorRatio=1 -XX:TargetSurvivorRatio=99 -XX:ParallelGCThreads=2 -XX:AllocatePrefetchDistance=256 -XX:AllocatePrefetchLines=4 -XX:LoopUnrollLimit=45 -XX:InitialTenuringThreshold=12 -XX:MaxTenuringThreshold=15 -XX:InlineSmallCode=3900 -XX:MaxInlineSize=270 -XX:FreqInlineSize=2500 -XX:+UseLargePages -XX:+UseParallelOldGC -XX:UseAVX=0 -XX:-UseAdaptiveSizePolicy -XX:-ThreadLocalHandshakes |
| JVM Affinity: | start /NODE [0,1] /AFFINITY[3,C,30,C0,300,C00,3000,C000,30000,C0000,300000,C00000,3000000,C000000,30000000,C00000000] |
| JVM Instances: | 32 |
| JVM Initial Heap (MB): | 1675 |
| JVM Maximum Heap (MB): | 1675 |
| JVM Address Bits: | 64 |
| Boot Firmware Version: | U56 v1.40 (04/28/2021) |
| Management Firmware Version: | 1.40 Apr 28 2021 |
| Workload Version: | SSJ 1.2.10 |
| Director Location: | Controller |
| Other Software: | HPE Service Pack for ProLiant (SPP) Version:2021.06.21, KB4554354 |
| JVM Instance | ssj_ops@100% |
|---|---|
| SUT12.001 | 105,534 |
| SUT12.002 | 101,681 |
| SUT12.003 | 103,917 |
| SUT12.004 | 101,350 |
| SUT12.005 | 105,000 |
| SUT12.006 | 104,971 |
| SUT12.007 | 104,030 |
| SUT12.008 | 101,848 |
| SUT12.009 | 105,024 |
| SUT12.010 | 103,645 |
| SUT12.011 | 104,831 |
| SUT12.012 | 103,750 |
| SUT12.013 | 104,828 |
| SUT12.014 | 102,646 |
| SUT12.015 | 105,445 |
| SUT12.016 | 104,155 |
| SUT12.017 | 104,039 |
| SUT12.018 | 102,848 |
| SUT12.019 | 102,557 |
| SUT12.020 | 102,624 |
| SUT12.021 | 102,293 |
| SUT12.022 | 105,483 |
| SUT12.023 | 104,857 |
| SUT12.024 | 105,573 |
| SUT12.025 | 100,198 |
| SUT12.026 | 105,656 |
| SUT12.027 | 104,648 |
| SUT12.028 | 101,895 |
| SUT12.029 | 102,821 |
| SUT12.030 | 102,335 |
| SUT12.031 | 101,950 |
| SUT12.032 | 105,765 |
| ssj_ops@100% | 3,318,199 |
| ssj_ops@100% per JVM | 103,694 |
| Target Load | Actual Load | ssj_ops | |
|---|---|---|---|
| Target | Actual | ||
| Calibration 1 | 104,989 | ||
| Calibration 2 | 105,761 | ||
| Calibration 3 | 105,714 | ||
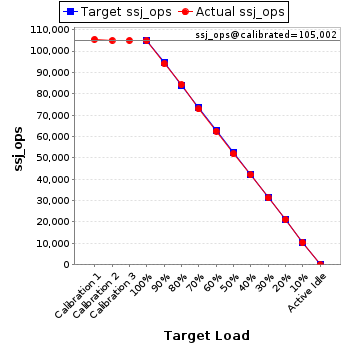
| ssj_ops@calibrated=105,738 | |||
| 100% | 99.8% | 105,738 | 105,534 |
| 90% | 90.9% | 95,164 | 96,096 |
| 80% | 80.2% | 84,590 | 84,840 |
| 70% | 70.2% | 74,016 | 74,212 |
| 60% | 59.0% | 63,443 | 62,411 |
| 50% | 49.3% | 52,869 | 52,136 |
| 40% | 40.1% | 42,295 | 42,383 |
| 30% | 30.1% | 31,721 | 31,811 |
| 20% | 20.0% | 21,148 | 21,178 |
| 10% | 10.1% | 10,574 | 10,662 |
| Active Idle | 0 | 0 | |

| Target Load | Actual Load | ssj_ops | |
|---|---|---|---|
| Target | Actual | ||
| Calibration 1 | 101,570 | ||
| Calibration 2 | 102,496 | ||
| Calibration 3 | 102,516 | ||
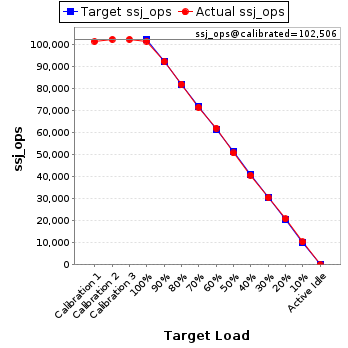
| ssj_ops@calibrated=102,506 | |||
| 100% | 99.2% | 102,506 | 101,681 |
| 90% | 90.2% | 92,256 | 92,445 |
| 80% | 80.1% | 82,005 | 82,096 |
| 70% | 69.9% | 71,754 | 71,639 |
| 60% | 60.6% | 61,504 | 62,129 |
| 50% | 49.5% | 51,253 | 50,790 |
| 40% | 39.6% | 41,002 | 40,637 |
| 30% | 29.8% | 30,752 | 30,563 |
| 20% | 20.4% | 20,501 | 20,877 |
| 10% | 10.1% | 10,251 | 10,345 |
| Active Idle | 0 | 0 | |
| Target Load | Actual Load | ssj_ops | |
|---|---|---|---|
| Target | Actual | ||
| Calibration 1 | 104,806 | ||
| Calibration 2 | 104,535 | ||
| Calibration 3 | 104,655 | ||
| ssj_ops@calibrated=104,595 | |||
| 100% | 99.4% | 104,595 | 103,917 |
| 90% | 90.0% | 94,135 | 94,186 |
| 80% | 80.9% | 83,676 | 84,588 |
| 70% | 69.5% | 73,216 | 72,680 |
| 60% | 59.1% | 62,757 | 61,793 |
| 50% | 50.9% | 52,297 | 53,257 |
| 40% | 39.1% | 41,838 | 40,893 |
| 30% | 30.3% | 31,378 | 31,717 |
| 20% | 20.4% | 20,919 | 21,357 |
| 10% | 9.9% | 10,459 | 10,329 |
| Active Idle | 0 | 0 | |

| Target Load | Actual Load | ssj_ops | |
|---|---|---|---|
| Target | Actual | ||
| Calibration 1 | 100,969 | ||
| Calibration 2 | 101,445 | ||
| Calibration 3 | 101,992 | ||
| ssj_ops@calibrated=101,719 | |||
| 100% | 99.6% | 101,719 | 101,350 |
| 90% | 90.4% | 91,547 | 92,001 |
| 80% | 80.7% | 81,375 | 82,107 |
| 70% | 69.1% | 71,203 | 70,315 |
| 60% | 59.1% | 61,031 | 60,132 |
| 50% | 50.0% | 50,859 | 50,905 |
| 40% | 40.3% | 40,687 | 40,943 |
| 30% | 29.4% | 30,516 | 29,951 |
| 20% | 19.6% | 20,344 | 19,886 |
| 10% | 9.9% | 10,172 | 10,042 |
| Active Idle | 0 | 0 | |

| Target Load | Actual Load | ssj_ops | |
|---|---|---|---|
| Target | Actual | ||
| Calibration 1 | 105,428 | ||
| Calibration 2 | 104,823 | ||
| Calibration 3 | 105,065 | ||
| ssj_ops@calibrated=104,944 | |||
| 100% | 100.1% | 104,944 | 105,000 |
| 90% | 89.7% | 94,450 | 94,140 |
| 80% | 80.8% | 83,955 | 84,753 |
| 70% | 69.1% | 73,461 | 72,519 |
| 60% | 59.2% | 62,967 | 62,123 |
| 50% | 49.5% | 52,472 | 51,910 |
| 40% | 40.3% | 41,978 | 42,321 |
| 30% | 30.1% | 31,483 | 31,586 |
| 20% | 19.6% | 20,989 | 20,564 |
| 10% | 9.7% | 10,494 | 10,197 |
| Active Idle | 0 | 0 | |

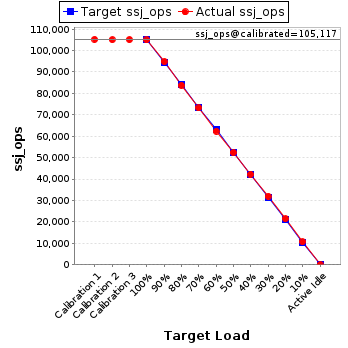
| Target Load | Actual Load | ssj_ops | |
|---|---|---|---|
| Target | Actual | ||
| Calibration 1 | 105,276 | ||
| Calibration 2 | 105,087 | ||
| Calibration 3 | 105,146 | ||
| ssj_ops@calibrated=105,117 | |||
| 100% | 99.9% | 105,117 | 104,971 |
| 90% | 90.3% | 94,605 | 94,930 |
| 80% | 79.7% | 84,093 | 83,809 |
| 70% | 69.7% | 73,582 | 73,222 |
| 60% | 59.4% | 63,070 | 62,404 |
| 50% | 49.9% | 52,558 | 52,482 |
| 40% | 40.2% | 42,047 | 42,278 |
| 30% | 30.5% | 31,535 | 32,024 |
| 20% | 20.5% | 21,023 | 21,526 |
| 10% | 10.2% | 10,512 | 10,687 |
| Active Idle | 0 | 0 | |
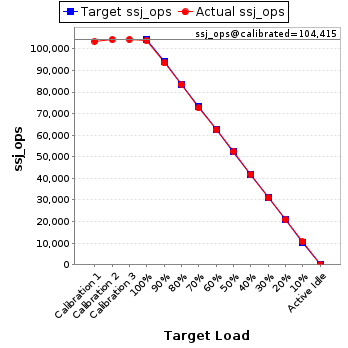
| Target Load | Actual Load | ssj_ops | |
|---|---|---|---|
| Target | Actual | ||
| Calibration 1 | 103,554 | ||
| Calibration 2 | 104,372 | ||
| Calibration 3 | 104,458 | ||
| ssj_ops@calibrated=104,415 | |||
| 100% | 99.6% | 104,415 | 104,030 |
| 90% | 89.6% | 93,974 | 93,519 |
| 80% | 79.9% | 83,532 | 83,479 |
| 70% | 69.6% | 73,091 | 72,623 |
| 60% | 59.9% | 62,649 | 62,496 |
| 50% | 50.3% | 52,208 | 52,533 |
| 40% | 40.1% | 41,766 | 41,916 |
| 30% | 29.7% | 31,325 | 31,051 |
| 20% | 20.1% | 20,883 | 20,949 |
| 10% | 10.2% | 10,442 | 10,654 |
| Active Idle | 0 | 0 | |
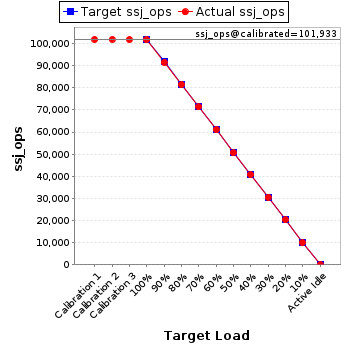
| Target Load | Actual Load | ssj_ops | |
|---|---|---|---|
| Target | Actual | ||
| Calibration 1 | 101,958 | ||
| Calibration 2 | 101,977 | ||
| Calibration 3 | 101,889 | ||
| ssj_ops@calibrated=101,933 | |||
| 100% | 99.9% | 101,933 | 101,848 |
| 90% | 89.9% | 91,740 | 91,643 |
| 80% | 80.0% | 81,546 | 81,522 |
| 70% | 70.0% | 71,353 | 71,376 |
| 60% | 60.0% | 61,160 | 61,178 |
| 50% | 49.7% | 50,967 | 50,640 |
| 40% | 40.0% | 40,773 | 40,735 |
| 30% | 30.0% | 30,580 | 30,573 |
| 20% | 20.0% | 20,387 | 20,339 |
| 10% | 9.9% | 10,193 | 10,074 |
| Active Idle | 0 | 0 | |
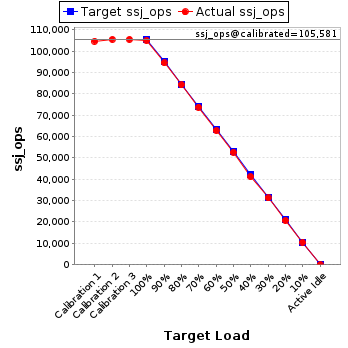
| Target Load | Actual Load | ssj_ops | |
|---|---|---|---|
| Target | Actual | ||
| Calibration 1 | 104,751 | ||
| Calibration 2 | 105,577 | ||
| Calibration 3 | 105,585 | ||
| ssj_ops@calibrated=105,581 | |||
| 100% | 99.5% | 105,581 | 105,024 |
| 90% | 89.5% | 95,023 | 94,545 |
| 80% | 79.8% | 84,465 | 84,229 |
| 70% | 69.9% | 73,907 | 73,847 |
| 60% | 59.5% | 63,349 | 62,834 |
| 50% | 50.0% | 52,791 | 52,761 |
| 40% | 39.0% | 42,233 | 41,219 |
| 30% | 29.6% | 31,674 | 31,265 |
| 20% | 19.6% | 21,116 | 20,737 |
| 10% | 10.0% | 10,558 | 10,558 |
| Active Idle | 0 | 0 | |
| Target Load | Actual Load | ssj_ops | |
|---|---|---|---|
| Target | Actual | ||
| Calibration 1 | 104,544 | ||
| Calibration 2 | 104,339 | ||
| Calibration 3 | 104,355 | ||
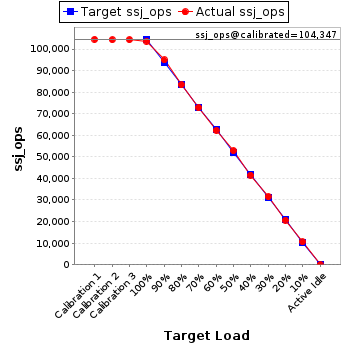
| ssj_ops@calibrated=104,347 | |||
| 100% | 99.3% | 104,347 | 103,645 |
| 90% | 91.0% | 93,912 | 94,981 |
| 80% | 79.9% | 83,478 | 83,422 |
| 70% | 69.9% | 73,043 | 72,912 |
| 60% | 59.7% | 62,608 | 62,332 |
| 50% | 50.7% | 52,174 | 52,878 |
| 40% | 39.8% | 41,739 | 41,556 |
| 30% | 30.3% | 31,304 | 31,590 |
| 20% | 19.8% | 20,869 | 20,711 |
| 10% | 10.1% | 10,435 | 10,558 |
| Active Idle | 0 | 0 | |
| Target Load | Actual Load | ssj_ops | |
|---|---|---|---|
| Target | Actual | ||
| Calibration 1 | 105,801 | ||
| Calibration 2 | 105,148 | ||
| Calibration 3 | 105,201 | ||
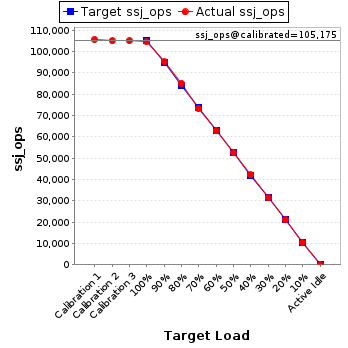
| ssj_ops@calibrated=105,175 | |||
| 100% | 99.7% | 105,175 | 104,831 |
| 90% | 90.6% | 94,657 | 95,294 |
| 80% | 81.1% | 84,140 | 85,255 |
| 70% | 69.7% | 73,622 | 73,312 |
| 60% | 59.7% | 63,105 | 62,764 |
| 50% | 50.1% | 52,587 | 52,644 |
| 40% | 40.2% | 42,070 | 42,319 |
| 30% | 29.9% | 31,552 | 31,450 |
| 20% | 20.0% | 21,035 | 20,997 |
| 10% | 10.0% | 10,517 | 10,466 |
| Active Idle | 0 | 0 | |
| Target Load | Actual Load | ssj_ops | |
|---|---|---|---|
| Target | Actual | ||
| Calibration 1 | 104,525 | ||
| Calibration 2 | 103,722 | ||
| Calibration 3 | 103,961 | ||
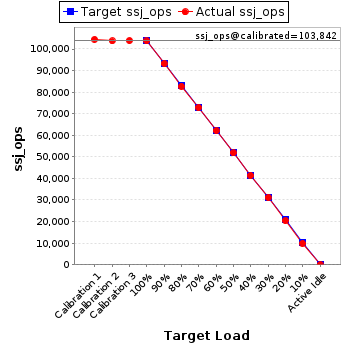
| ssj_ops@calibrated=103,842 | |||
| 100% | 99.9% | 103,842 | 103,750 |
| 90% | 89.8% | 93,458 | 93,264 |
| 80% | 79.7% | 83,073 | 82,774 |
| 70% | 70.2% | 72,689 | 72,903 |
| 60% | 59.9% | 62,305 | 62,188 |
| 50% | 49.9% | 51,921 | 51,840 |
| 40% | 39.8% | 41,537 | 41,372 |
| 30% | 30.1% | 31,153 | 31,220 |
| 20% | 19.6% | 20,768 | 20,405 |
| 10% | 9.6% | 10,384 | 9,945 |
| Active Idle | 0 | 0 | |
| Target Load | Actual Load | ssj_ops | |
|---|---|---|---|
| Target | Actual | ||
| Calibration 1 | 105,520 | ||
| Calibration 2 | 104,938 | ||
| Calibration 3 | 104,960 | ||
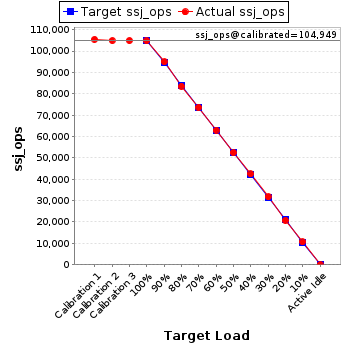
| ssj_ops@calibrated=104,949 | |||
| 100% | 99.9% | 104,949 | 104,828 |
| 90% | 90.5% | 94,454 | 95,000 |
| 80% | 79.7% | 83,959 | 83,626 |
| 70% | 70.2% | 73,464 | 73,697 |
| 60% | 60.0% | 62,970 | 63,013 |
| 50% | 50.1% | 52,475 | 52,541 |
| 40% | 40.4% | 41,980 | 42,443 |
| 30% | 30.3% | 31,485 | 31,815 |
| 20% | 19.8% | 20,990 | 20,824 |
| 10% | 10.1% | 10,495 | 10,631 |
| Active Idle | 0 | 0 | |
| Target Load | Actual Load | ssj_ops | |
|---|---|---|---|
| Target | Actual | ||
| Calibration 1 | 101,872 | ||
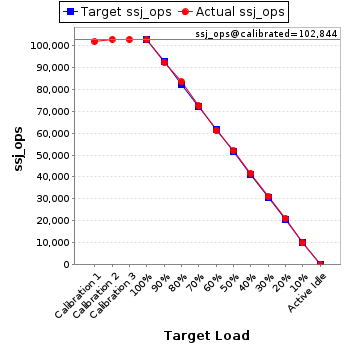
| Calibration 2 | 102,844 | ||
| Calibration 3 | 102,844 | ||
| ssj_ops@calibrated=102,844 | |||
| 100% | 99.8% | 102,844 | 102,646 |
| 90% | 89.9% | 92,560 | 92,425 |
| 80% | 81.1% | 82,275 | 83,420 |
| 70% | 70.4% | 71,991 | 72,402 |
| 60% | 59.6% | 61,706 | 61,287 |
| 50% | 50.4% | 51,422 | 51,874 |
| 40% | 40.6% | 41,138 | 41,749 |
| 30% | 30.3% | 30,853 | 31,135 |
| 20% | 20.6% | 20,569 | 21,196 |
| 10% | 9.7% | 10,284 | 9,958 |
| Active Idle | 0 | 0 | |
| Target Load | Actual Load | ssj_ops | |
|---|---|---|---|
| Target | Actual | ||
| Calibration 1 | 106,478 | ||
| Calibration 2 | 105,650 | ||
| Calibration 3 | 105,501 | ||
| ssj_ops@calibrated=105,575 | |||
| 100% | 99.9% | 105,575 | 105,445 |
| 90% | 89.4% | 95,018 | 94,378 |
| 80% | 79.6% | 84,460 | 84,085 |
| 70% | 69.9% | 73,903 | 73,811 |
| 60% | 59.4% | 63,345 | 62,694 |
| 50% | 50.2% | 52,788 | 53,041 |
| 40% | 40.4% | 42,230 | 42,642 |
| 30% | 29.5% | 31,673 | 31,160 |
| 20% | 20.0% | 21,115 | 21,072 |
| 10% | 10.2% | 10,558 | 10,716 |
| Active Idle | 0 | 0 | |

| Target Load | Actual Load | ssj_ops | |
|---|---|---|---|
| Target | Actual | ||
| Calibration 1 | 104,594 | ||
| Calibration 2 | 104,166 | ||
| Calibration 3 | 104,290 | ||
| ssj_ops@calibrated=104,228 | |||
| 100% | 99.9% | 104,228 | 104,155 |
| 90% | 90.5% | 93,805 | 94,301 |
| 80% | 79.4% | 83,382 | 82,755 |
| 70% | 69.4% | 72,960 | 72,299 |
| 60% | 60.5% | 62,537 | 63,029 |
| 50% | 49.8% | 52,114 | 51,917 |
| 40% | 40.3% | 41,691 | 41,989 |
| 30% | 30.1% | 31,268 | 31,415 |
| 20% | 20.4% | 20,846 | 21,228 |
| 10% | 10.0% | 10,423 | 10,391 |
| Active Idle | 0 | 0 | |

| Target Load | Actual Load | ssj_ops | |
|---|---|---|---|
| Target | Actual | ||
| Calibration 1 | 104,856 | ||
| Calibration 2 | 104,098 | ||
| Calibration 3 | 104,203 | ||
| ssj_ops@calibrated=104,151 | |||
| 100% | 99.9% | 104,151 | 104,039 |
| 90% | 89.4% | 93,736 | 93,143 |
| 80% | 78.7% | 83,321 | 81,990 |
| 70% | 70.8% | 72,906 | 73,699 |
| 60% | 59.9% | 62,491 | 62,436 |
| 50% | 50.3% | 52,075 | 52,415 |
| 40% | 40.6% | 41,660 | 42,285 |
| 30% | 29.7% | 31,245 | 30,888 |
| 20% | 20.3% | 20,830 | 21,186 |
| 10% | 10.1% | 10,415 | 10,481 |
| Active Idle | 0 | 0 | |

| Target Load | Actual Load | ssj_ops | |
|---|---|---|---|
| Target | Actual | ||
| Calibration 1 | 104,191 | ||
| Calibration 2 | 103,577 | ||
| Calibration 3 | 103,558 | ||
| ssj_ops@calibrated=103,567 | |||
| 100% | 99.3% | 103,567 | 102,848 |
| 90% | 90.9% | 93,211 | 94,095 |
| 80% | 79.5% | 82,854 | 82,291 |
| 70% | 69.6% | 72,497 | 72,067 |
| 60% | 60.4% | 62,140 | 62,530 |
| 50% | 49.8% | 51,784 | 51,610 |
| 40% | 39.5% | 41,427 | 40,916 |
| 30% | 30.0% | 31,070 | 31,093 |
| 20% | 19.7% | 20,713 | 20,404 |
| 10% | 9.8% | 10,357 | 10,191 |
| Active Idle | 0 | 0 | |

| Target Load | Actual Load | ssj_ops | |
|---|---|---|---|
| Target | Actual | ||
| Calibration 1 | 103,164 | ||
| Calibration 2 | 102,609 | ||
| Calibration 3 | 102,793 | ||
| ssj_ops@calibrated=102,701 | |||
| 100% | 99.9% | 102,701 | 102,557 |
| 90% | 90.6% | 92,431 | 93,058 |
| 80% | 79.9% | 82,161 | 82,105 |
| 70% | 70.4% | 71,891 | 72,343 |
| 60% | 60.3% | 61,621 | 61,966 |
| 50% | 50.1% | 51,351 | 51,406 |
| 40% | 40.0% | 41,080 | 41,105 |
| 30% | 29.4% | 30,810 | 30,147 |
| 20% | 20.5% | 20,540 | 21,070 |
| 10% | 10.2% | 10,270 | 10,475 |
| Active Idle | 0 | 0 | |

| Target Load | Actual Load | ssj_ops | |
|---|---|---|---|
| Target | Actual | ||
| Calibration 1 | 103,446 | ||
| Calibration 2 | 102,889 | ||
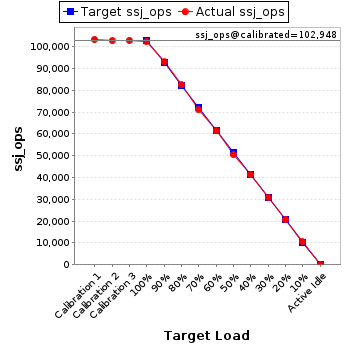
| Calibration 3 | 103,007 | ||
| ssj_ops@calibrated=102,948 | |||
| 100% | 99.7% | 102,948 | 102,624 |
| 90% | 90.4% | 92,653 | 93,018 |
| 80% | 80.2% | 82,358 | 82,554 |
| 70% | 69.2% | 72,064 | 71,256 |
| 60% | 59.7% | 61,769 | 61,417 |
| 50% | 49.1% | 51,474 | 50,571 |
| 40% | 40.1% | 41,179 | 41,232 |
| 30% | 30.1% | 30,884 | 30,975 |
| 20% | 20.3% | 20,590 | 20,928 |
| 10% | 10.1% | 10,295 | 10,413 |
| Active Idle | 0 | 0 | |
| Target Load | Actual Load | ssj_ops | |
|---|---|---|---|
| Target | Actual | ||
| Calibration 1 | 101,964 | ||
| Calibration 2 | 102,086 | ||
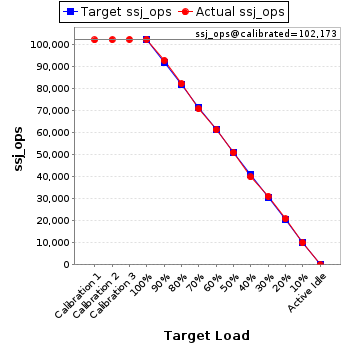
| Calibration 3 | 102,260 | ||
| ssj_ops@calibrated=102,173 | |||
| 100% | 100.1% | 102,173 | 102,293 |
| 90% | 90.8% | 91,956 | 92,758 |
| 80% | 80.5% | 81,738 | 82,210 |
| 70% | 69.3% | 71,521 | 70,762 |
| 60% | 60.0% | 61,304 | 61,257 |
| 50% | 49.9% | 51,086 | 50,961 |
| 40% | 39.0% | 40,869 | 39,808 |
| 30% | 30.4% | 30,652 | 31,094 |
| 20% | 20.4% | 20,435 | 20,869 |
| 10% | 9.9% | 10,217 | 10,096 |
| Active Idle | 0 | 0 | |
| Target Load | Actual Load | ssj_ops | |
|---|---|---|---|
| Target | Actual | ||
| Calibration 1 | 104,524 | ||
| Calibration 2 | 105,493 | ||
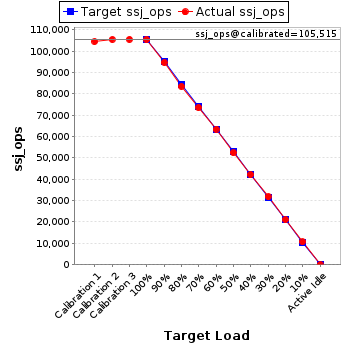
| Calibration 3 | 105,537 | ||
| ssj_ops@calibrated=105,515 | |||
| 100% | 100.0% | 105,515 | 105,483 |
| 90% | 89.8% | 94,964 | 94,711 |
| 80% | 79.2% | 84,412 | 83,519 |
| 70% | 69.7% | 73,861 | 73,591 |
| 60% | 60.2% | 63,309 | 63,479 |
| 50% | 49.7% | 52,758 | 52,426 |
| 40% | 40.0% | 42,206 | 42,164 |
| 30% | 30.2% | 31,655 | 31,916 |
| 20% | 20.0% | 21,103 | 21,149 |
| 10% | 10.1% | 10,552 | 10,683 |
| Active Idle | 0 | 0 | |
| Target Load | Actual Load | ssj_ops | |
|---|---|---|---|
| Target | Actual | ||
| Calibration 1 | 105,507 | ||
| Calibration 2 | 104,992 | ||
| Calibration 3 | 105,012 | ||
| ssj_ops@calibrated=105,002 | |||
| 100% | 99.9% | 105,002 | 104,857 |
| 90% | 89.6% | 94,501 | 94,096 |
| 80% | 80.4% | 84,001 | 84,380 |
| 70% | 69.4% | 73,501 | 72,894 |
| 60% | 59.5% | 63,001 | 62,526 |
| 50% | 49.4% | 52,501 | 51,898 |
| 40% | 40.1% | 42,001 | 42,065 |
| 30% | 29.7% | 31,500 | 31,233 |
| 20% | 20.2% | 21,000 | 21,199 |
| 10% | 10.0% | 10,500 | 10,466 |
| Active Idle | 0 | 0 | |
| Target Load | Actual Load | ssj_ops | |
|---|---|---|---|
| Target | Actual | ||
| Calibration 1 | 105,414 | ||
| Calibration 2 | 105,327 | ||
| Calibration 3 | 105,584 | ||
| ssj_ops@calibrated=105,456 | |||
| 100% | 100.1% | 105,456 | 105,573 |
| 90% | 90.5% | 94,910 | 95,439 |
| 80% | 80.2% | 84,364 | 84,563 |
| 70% | 69.5% | 73,819 | 73,290 |
| 60% | 59.5% | 63,273 | 62,796 |
| 50% | 50.4% | 52,728 | 53,161 |
| 40% | 40.6% | 42,182 | 42,783 |
| 30% | 30.0% | 31,637 | 31,632 |
| 20% | 20.1% | 21,091 | 21,153 |
| 10% | 9.9% | 10,546 | 10,412 |
| Active Idle | 0 | 0 | |

| Target Load | Actual Load | ssj_ops | |
|---|---|---|---|
| Target | Actual | ||
| Calibration 1 | 101,109 | ||
| Calibration 2 | 100,337 | ||
| Calibration 3 | 100,289 | ||
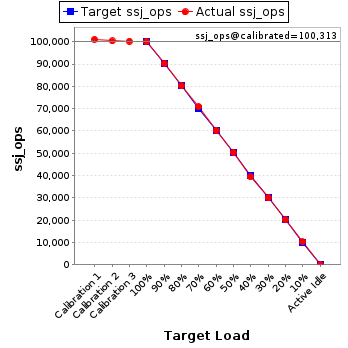
| ssj_ops@calibrated=100,313 | |||
| 100% | 99.9% | 100,313 | 100,198 |
| 90% | 90.1% | 90,281 | 90,380 |
| 80% | 79.9% | 80,250 | 80,163 |
| 70% | 70.7% | 70,219 | 70,942 |
| 60% | 60.1% | 60,188 | 60,318 |
| 50% | 50.3% | 50,156 | 50,471 |
| 40% | 39.3% | 40,125 | 39,397 |
| 30% | 30.0% | 30,094 | 30,076 |
| 20% | 20.0% | 20,063 | 20,087 |
| 10% | 10.2% | 10,031 | 10,199 |
| Active Idle | 0 | 0 | |
| Target Load | Actual Load | ssj_ops | |
|---|---|---|---|
| Target | Actual | ||
| Calibration 1 | 105,886 | ||
| Calibration 2 | 106,125 | ||
| Calibration 3 | 106,618 | ||
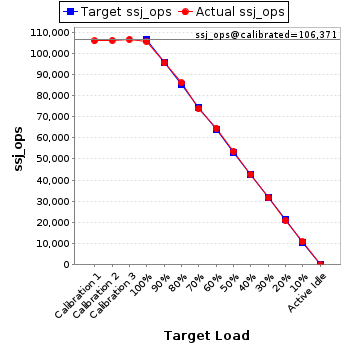
| ssj_ops@calibrated=106,371 | |||
| 100% | 99.3% | 106,371 | 105,656 |
| 90% | 89.7% | 95,734 | 95,464 |
| 80% | 80.9% | 85,097 | 86,006 |
| 70% | 69.4% | 74,460 | 73,829 |
| 60% | 60.7% | 63,823 | 64,616 |
| 50% | 50.5% | 53,186 | 53,720 |
| 40% | 40.1% | 42,549 | 42,691 |
| 30% | 29.7% | 31,911 | 31,584 |
| 20% | 19.8% | 21,274 | 21,041 |
| 10% | 10.2% | 10,637 | 10,862 |
| Active Idle | 0 | 0 | |
| Target Load | Actual Load | ssj_ops | |
|---|---|---|---|
| Target | Actual | ||
| Calibration 1 | 105,829 | ||
| Calibration 2 | 105,149 | ||
| Calibration 3 | 105,120 | ||
| ssj_ops@calibrated=105,135 | |||
| 100% | 99.5% | 105,135 | 104,648 |
| 90% | 89.1% | 94,621 | 93,632 |
| 80% | 79.8% | 84,108 | 83,850 |
| 70% | 70.4% | 73,594 | 74,046 |
| 60% | 59.4% | 63,081 | 62,416 |
| 50% | 49.6% | 52,567 | 52,158 |
| 40% | 39.7% | 42,054 | 41,717 |
| 30% | 30.1% | 31,540 | 31,652 |
| 20% | 20.1% | 21,027 | 21,099 |
| 10% | 9.7% | 10,513 | 10,233 |
| Active Idle | 0 | 0 | |

| Target Load | Actual Load | ssj_ops | |
|---|---|---|---|
| Target | Actual | ||
| Calibration 1 | 102,726 | ||
| Calibration 2 | 101,793 | ||
| Calibration 3 | 102,104 | ||
| ssj_ops@calibrated=101,949 | |||
| 100% | 99.9% | 101,949 | 101,895 |
| 90% | 90.2% | 91,754 | 91,932 |
| 80% | 79.9% | 81,559 | 81,443 |
| 70% | 70.0% | 71,364 | 71,396 |
| 60% | 59.3% | 61,169 | 60,415 |
| 50% | 49.8% | 50,974 | 50,781 |
| 40% | 40.0% | 40,779 | 40,799 |
| 30% | 30.1% | 30,585 | 30,644 |
| 20% | 20.4% | 20,390 | 20,797 |
| 10% | 9.8% | 10,195 | 10,027 |
| Active Idle | 0 | 0 | |

| Target Load | Actual Load | ssj_ops | |
|---|---|---|---|
| Target | Actual | ||
| Calibration 1 | 102,460 | ||
| Calibration 2 | 102,779 | ||
| Calibration 3 | 102,765 | ||
| ssj_ops@calibrated=102,772 | |||
| 100% | 100.0% | 102,772 | 102,821 |
| 90% | 90.3% | 92,495 | 92,776 |
| 80% | 79.0% | 82,217 | 81,235 |
| 70% | 70.8% | 71,940 | 72,728 |
| 60% | 60.0% | 61,663 | 61,684 |
| 50% | 49.7% | 51,386 | 51,128 |
| 40% | 40.6% | 41,109 | 41,726 |
| 30% | 30.0% | 30,832 | 30,784 |
| 20% | 20.4% | 20,554 | 20,995 |
| 10% | 9.9% | 10,277 | 10,204 |
| Active Idle | 0 | 0 | |

| Target Load | Actual Load | ssj_ops | |
|---|---|---|---|
| Target | Actual | ||
| Calibration 1 | 103,336 | ||
| Calibration 2 | 103,307 | ||
| Calibration 3 | 103,546 | ||
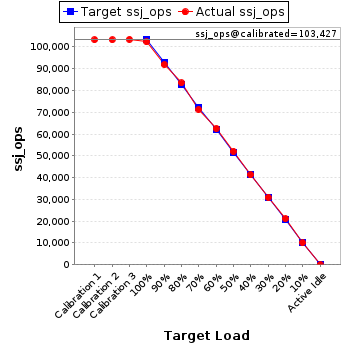
| ssj_ops@calibrated=103,427 | |||
| 100% | 98.9% | 103,427 | 102,335 |
| 90% | 88.9% | 93,084 | 91,984 |
| 80% | 80.7% | 82,741 | 83,503 |
| 70% | 69.0% | 72,399 | 71,355 |
| 60% | 60.5% | 62,056 | 62,623 |
| 50% | 50.4% | 51,713 | 52,162 |
| 40% | 39.9% | 41,371 | 41,261 |
| 30% | 30.0% | 31,028 | 30,985 |
| 20% | 20.5% | 20,685 | 21,232 |
| 10% | 9.8% | 10,343 | 10,158 |
| Active Idle | 0 | 0 | |
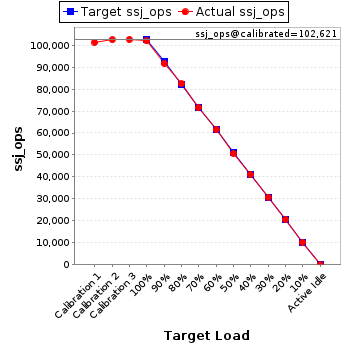
| Target Load | Actual Load | ssj_ops | |
|---|---|---|---|
| Target | Actual | ||
| Calibration 1 | 101,339 | ||
| Calibration 2 | 102,516 | ||
| Calibration 3 | 102,726 | ||
| ssj_ops@calibrated=102,621 | |||
| 100% | 99.3% | 102,621 | 101,950 |
| 90% | 89.4% | 92,359 | 91,792 |
| 80% | 80.5% | 82,097 | 82,590 |
| 70% | 69.9% | 71,834 | 71,701 |
| 60% | 60.1% | 61,572 | 61,708 |
| 50% | 49.5% | 51,310 | 50,750 |
| 40% | 40.1% | 41,048 | 41,162 |
| 30% | 30.0% | 30,786 | 30,802 |
| 20% | 20.2% | 20,524 | 20,730 |
| 10% | 10.0% | 10,262 | 10,287 |
| Active Idle | 0 | 0 | |
| Target Load | Actual Load | ssj_ops | |
|---|---|---|---|
| Target | Actual | ||
| Calibration 1 | 105,491 | ||
| Calibration 2 | 105,738 | ||
| Calibration 3 | 106,087 | ||
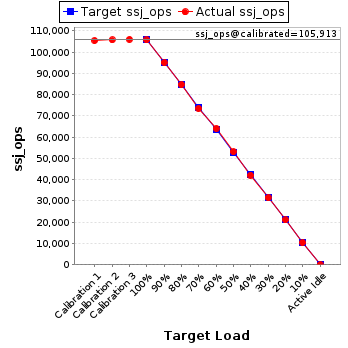
| ssj_ops@calibrated=105,913 | |||
| 100% | 99.9% | 105,913 | 105,765 |
| 90% | 89.9% | 95,322 | 95,185 |
| 80% | 80.0% | 84,730 | 84,755 |
| 70% | 69.5% | 74,139 | 73,584 |
| 60% | 60.6% | 63,548 | 64,174 |
| 50% | 50.2% | 52,956 | 53,211 |
| 40% | 39.8% | 42,365 | 42,125 |
| 30% | 29.8% | 31,774 | 31,516 |
| 20% | 19.9% | 21,183 | 21,045 |
| 10% | 9.9% | 10,591 | 10,479 |
| Active Idle | 0 | 0 | |