SPECpower_ssj2008
Aggregate Performance Report
Copyright © 2007-2021 Standard Performance Evaluation Corporation
| XSLAB V-Raptor SQ | ssj_ops@100% = 1,577,507 ssj_ops@100% per Host = 98,594 ssj_ops@100% per JVM = 98,594 |
||||
| Test Sponsor: | Telecommunications Technology Association | SPEC License #: | 83 | Test Method: | Multi Node |
| Tested By: | Telecommunications Technology Association | Test Location: | TTA, Seongnam-city, Korea | Test Date: | Sep 15, 2021 |
| Hardware Availability: | Jul-2021 | Software Availability: | Sep-2018 | Publication: | Dec 8, 2021 |
| System Source: | Single Supplier | System Designation: | Server | Power Provisioning: | Line-powered |
| Target Load | Actual Load | ssj_ops | |
|---|---|---|---|
| Target | Actual | ||
| Calibration 1 | 1,586,007 | ||
| Calibration 2 | 1,607,020 | ||
| Calibration 3 | 1,591,616 | ||
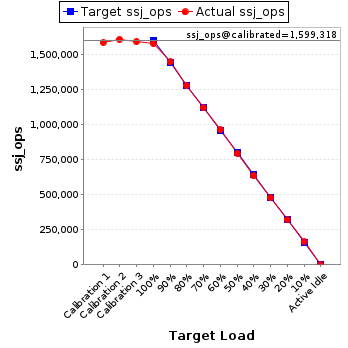
| ssj_ops@calibrated=1,599,318 | |||
| 100% | 98.6% | 1,599,318 | 1,577,507 |
| 90% | 90.3% | 1,439,386 | 1,444,898 |
| 80% | 79.9% | 1,279,454 | 1,278,359 |
| 70% | 69.9% | 1,119,523 | 1,118,360 |
| 60% | 60.2% | 959,591 | 963,401 |
| 50% | 49.8% | 799,659 | 795,783 |
| 40% | 39.9% | 639,727 | 637,679 |
| 30% | 29.9% | 479,795 | 478,239 |
| 20% | 20.0% | 319,864 | 319,338 |
| 10% | 10.2% | 159,932 | 162,818 |
| Active Idle | 0 | 0 | |
| # of Nodes | # of Chips | # of Cores | # of Threads | Total RAM (GB) | # of OS Images | # of JVM Instances |
|---|---|---|---|---|---|---|
| 16 | 384 | 384 | 384 | 256 | 16 | 16 |
| Set Identifier: | sut |
| Set Description: | V-Raptor SQ |
| # of Identical Nodes: | 16 |
| Comment: | None |
| Hardware per Node | |
|---|---|
| Hardware Vendor: | XSLAB |
| Model: | V-Raptor SQ |
| Form Factor: | 2U |
| CPU Name: | ARM Cortex A53(1GHz) 24 Cores: SOCIONEXT SC2A11 ARM SoC |
| CPU Characteristics: | 24 Core, 1GHz |
| CPU Frequency (MHz): | 1000 |
| CPU(s) Enabled: | 24 cores, 24 chips, 1 core/chip |
| Hardware Threads: | 24 (1 / core) |
| CPU(s) Orderable: | 24 chips |
| Primary Cache: | 16 KB I + 16 KB D on chip per core |
| Secondary Cache: | 256 KB I+D on chip per dual core |
| Tertiary Cache: | 4 MB I+D on chip per chip |
| Other Cache: | None |
| Memory Amount (GB): | 16 |
| # and size of DIMM: | 1 x 16 GB |
| Memory Details: | 1 x 16 GB DDR4 ECC SODIMM |
| Power Supply Quantity and Rating (W): | None |
| Power Supply Details: | N/A |
| Disk Drive: | M.2 2280 SATA SSD 250GB |
| Disk Controller: | ASM1062 Serial ATA Controller |
| # and type of Network Interface Cards (NICs) Installed: | 1 x 1Gbps with 2ch IPSec Network Offload Engine |
| NICs Enabled in Firmware / OS / Connected: | 1/1/1 |
| Network Speed (Mbit): | 10000 |
| Keyboard: | None |
| Mouse: | None |
| Monitor: | None |
| Optical Drives: | No |
| Other Hardware: | None |
| Software per Node | |
|---|---|
| Power Management: | Enabled |
| Operating System (OS): | Ubuntu 18.04.5 LTS (Bionic Beaver) |
| OS Version: | Kernel 4.15.0-144-generic |
| Filesystem: | ext4 |
| JVM Vendor: | Oracle Corporation |
| JVM Version: | java version "11.0.11" 2021-04-20 LTS;Java(TM) SE Runtime Environment 18.9 (build 11.0.11+9-LTS-194);Java HotSpot(TM) 64-Bit Server VM 18.9 (build 11.0.11+9-LTS-194, mixed mode) |
| JVM Command-line Options: | -server -Djava.awt.headless=true -Xms5000m -Xmx5000m -Djava.net.preferIPv4Stack=true -XX:ParallelGCThreads=15 -XX:SurvivorRatio=60 -XX:TargetSurvivorRatio=90 -XX:InlineSmallCode=3900 -XX:MaxInlineSize=270 -XX:FreqInlineSize=2500 -XX:AllocatePrefetchDistance=256 -XX:AllocatePrefetchLines=4 -XX:InitialTenuringThreshold=12 -XX:MaxTenuringThreshold=15 -XX:LoopUnrollLimit=45 -XX:+UseParallelGC |
| JVM Affinity: | for each physicalCore { numactl -C physicalCoreId, physicalCoreId + 10 } |
| JVM Instances: | 1 |
| JVM Initial Heap (MB): | 400 |
| JVM Maximum Heap (MB): | 400 |
| JVM Address Bits: | 64 |
| Boot Firmware Version: | None |
| Management Firmware Version: | V1.0.3 |
| Workload Version: | SSJ 1.2.10 |
| Director Location: | Controller |
| Other Software: | None |
| Host | ssj_ops@100% |
|---|---|
| node17 | 99,476 |
| node18 | 96,846 |
| node19 | 97,610 |
| node20 | 97,711 |
| node21 | 98,408 |
| node22 | 96,933 |
| node23 | 96,716 |
| node24 | 99,697 |
| node25 | 99,591 |
| node26 | 99,504 |
| node27 | 101,323 |
| node28 | 97,912 |
| node29 | 97,830 |
| node30 | 99,264 |
| node31 | 100,611 |
| node32 | 98,075 |
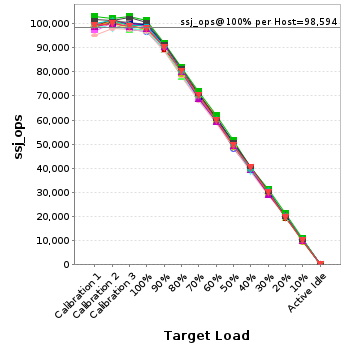
| ssj_ops@100% | 1,577,507 |
| ssj_ops@100% per Host | 98,594 |
| ssj_ops@100% per JVM | 98,594 |
| Target Load | Actual Load | ssj_ops | |
|---|---|---|---|
| Target | Actual | ||
| Calibration 1 | 98,805 | ||
| Calibration 2 | 101,197 | ||
| Calibration 3 | 99,945 | ||
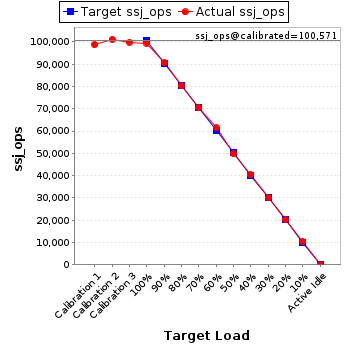
| ssj_ops@calibrated=100,571 | |||
| 100% | 98.9% | 100,571 | 99,476 |
| 90% | 90.2% | 90,514 | 90,756 |
| 80% | 79.9% | 80,457 | 80,347 |
| 70% | 70.2% | 70,400 | 70,628 |
| 60% | 61.2% | 60,343 | 61,574 |
| 50% | 49.7% | 50,286 | 50,012 |
| 40% | 40.2% | 40,228 | 40,454 |
| 30% | 30.0% | 30,171 | 30,143 |
| 20% | 20.1% | 20,114 | 20,207 |
| 10% | 10.4% | 10,057 | 10,473 |
| Active Idle | 0 | 0 | |
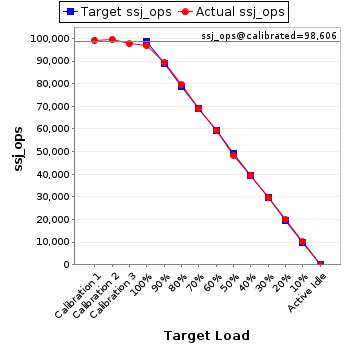
| Target Load | Actual Load | ssj_ops | |
|---|---|---|---|
| Target | Actual | ||
| Calibration 1 | 99,280 | ||
| Calibration 2 | 99,618 | ||
| Calibration 3 | 97,595 | ||
| ssj_ops@calibrated=98,606 | |||
| 100% | 98.2% | 98,606 | 96,846 |
| 90% | 90.6% | 88,746 | 89,352 |
| 80% | 80.6% | 78,885 | 79,430 |
| 70% | 69.8% | 69,024 | 68,826 |
| 60% | 60.2% | 59,164 | 59,388 |
| 50% | 49.1% | 49,303 | 48,377 |
| 40% | 39.9% | 39,443 | 39,351 |
| 30% | 30.1% | 29,582 | 29,634 |
| 20% | 20.4% | 19,721 | 20,099 |
| 10% | 10.2% | 9,861 | 10,080 |
| Active Idle | 0 | 0 | |
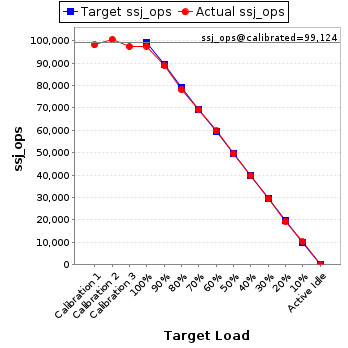
| Target Load | Actual Load | ssj_ops | |
|---|---|---|---|
| Target | Actual | ||
| Calibration 1 | 98,162 | ||
| Calibration 2 | 100,716 | ||
| Calibration 3 | 97,533 | ||
| ssj_ops@calibrated=99,124 | |||
| 100% | 98.5% | 99,124 | 97,610 |
| 90% | 89.9% | 89,212 | 89,160 |
| 80% | 78.9% | 79,300 | 78,257 |
| 70% | 69.9% | 69,387 | 69,290 |
| 60% | 60.3% | 59,475 | 59,723 |
| 50% | 50.1% | 49,562 | 49,683 |
| 40% | 40.0% | 39,650 | 39,656 |
| 30% | 29.7% | 29,737 | 29,413 |
| 20% | 19.7% | 19,825 | 19,479 |
| 10% | 10.4% | 9,912 | 10,262 |
| Active Idle | 0 | 0 | |
| Target Load | Actual Load | ssj_ops | |
|---|---|---|---|
| Target | Actual | ||
| Calibration 1 | 99,117 | ||
| Calibration 2 | 99,392 | ||
| Calibration 3 | 99,046 | ||
| ssj_ops@calibrated=99,219 | |||
| 100% | 98.5% | 99,219 | 97,711 |
| 90% | 90.9% | 89,297 | 90,188 |
| 80% | 80.3% | 79,375 | 79,686 |
| 70% | 70.5% | 69,453 | 69,952 |
| 60% | 60.7% | 59,531 | 60,197 |
| 50% | 49.1% | 49,609 | 48,677 |
| 40% | 40.0% | 39,688 | 39,727 |
| 30% | 30.0% | 29,766 | 29,781 |
| 20% | 19.7% | 19,844 | 19,537 |
| 10% | 10.3% | 9,922 | 10,171 |
| Active Idle | 0 | 0 | |

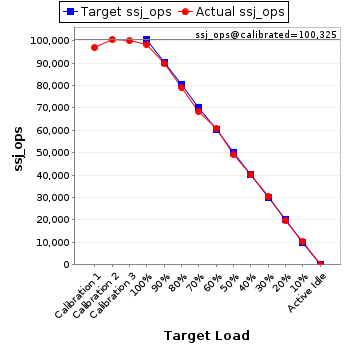
| Target Load | Actual Load | ssj_ops | |
|---|---|---|---|
| Target | Actual | ||
| Calibration 1 | 96,931 | ||
| Calibration 2 | 100,660 | ||
| Calibration 3 | 99,990 | ||
| ssj_ops@calibrated=100,325 | |||
| 100% | 98.1% | 100,325 | 98,408 |
| 90% | 89.7% | 90,292 | 90,002 |
| 80% | 79.0% | 80,260 | 79,301 |
| 70% | 68.2% | 70,227 | 68,462 |
| 60% | 60.7% | 60,195 | 60,901 |
| 50% | 49.2% | 50,162 | 49,366 |
| 40% | 39.9% | 40,130 | 40,051 |
| 30% | 30.2% | 30,097 | 30,326 |
| 20% | 19.9% | 20,065 | 19,937 |
| 10% | 10.2% | 10,032 | 10,200 |
| Active Idle | 0 | 0 | |
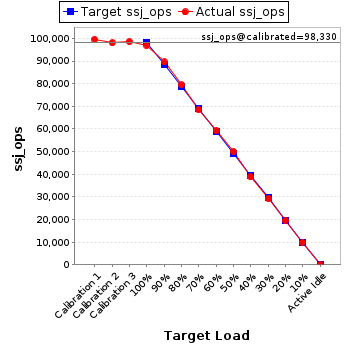
| Target Load | Actual Load | ssj_ops | |
|---|---|---|---|
| Target | Actual | ||
| Calibration 1 | 99,621 | ||
| Calibration 2 | 98,068 | ||
| Calibration 3 | 98,592 | ||
| ssj_ops@calibrated=98,330 | |||
| 100% | 98.6% | 98,330 | 96,933 |
| 90% | 91.1% | 88,497 | 89,584 |
| 80% | 80.8% | 78,664 | 79,474 |
| 70% | 69.8% | 68,831 | 68,661 |
| 60% | 60.4% | 58,998 | 59,420 |
| 50% | 50.9% | 49,165 | 50,026 |
| 40% | 39.5% | 39,332 | 38,802 |
| 30% | 29.9% | 29,499 | 29,397 |
| 20% | 19.9% | 19,666 | 19,582 |
| 10% | 10.1% | 9,833 | 9,882 |
| Active Idle | 0 | 0 | |
| Target Load | Actual Load | ssj_ops | |
|---|---|---|---|
| Target | Actual | ||
| Calibration 1 | 95,202 | ||
| Calibration 2 | 97,965 | ||
| Calibration 3 | 97,472 | ||
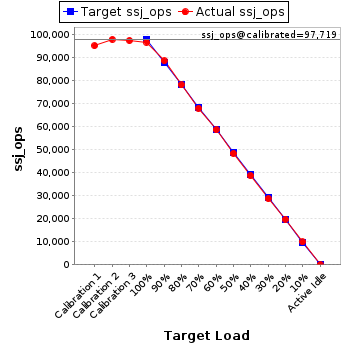
| ssj_ops@calibrated=97,719 | |||
| 100% | 99.0% | 97,719 | 96,716 |
| 90% | 90.7% | 87,947 | 88,635 |
| 80% | 79.9% | 78,175 | 78,112 |
| 70% | 69.6% | 68,403 | 68,053 |
| 60% | 60.1% | 58,631 | 58,693 |
| 50% | 49.6% | 48,859 | 48,422 |
| 40% | 39.6% | 39,087 | 38,665 |
| 30% | 29.5% | 29,316 | 28,785 |
| 20% | 20.3% | 19,544 | 19,814 |
| 10% | 10.1% | 9,772 | 9,872 |
| Active Idle | 0 | 0 | |
| Target Load | Actual Load | ssj_ops | |
|---|---|---|---|
| Target | Actual | ||
| Calibration 1 | 99,810 | ||
| Calibration 2 | 101,410 | ||
| Calibration 3 | 100,356 | ||
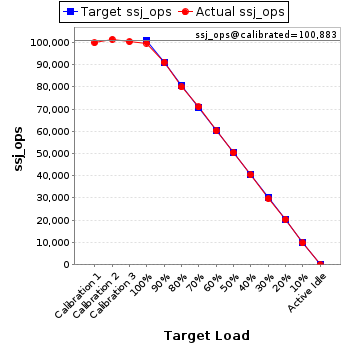
| ssj_ops@calibrated=100,883 | |||
| 100% | 98.8% | 100,883 | 99,697 |
| 90% | 90.3% | 90,795 | 91,078 |
| 80% | 79.2% | 80,706 | 79,938 |
| 70% | 70.3% | 70,618 | 70,958 |
| 60% | 59.8% | 60,530 | 60,285 |
| 50% | 50.0% | 50,442 | 50,428 |
| 40% | 40.1% | 40,353 | 40,416 |
| 30% | 29.5% | 30,265 | 29,775 |
| 20% | 20.2% | 20,177 | 20,418 |
| 10% | 9.7% | 10,088 | 9,829 |
| Active Idle | 0 | 0 | |
| Target Load | Actual Load | ssj_ops | |
|---|---|---|---|
| Target | Actual | ||
| Calibration 1 | 98,717 | ||
| Calibration 2 | 101,572 | ||
| Calibration 3 | 99,293 | ||
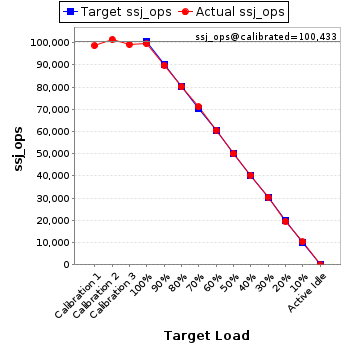
| ssj_ops@calibrated=100,433 | |||
| 100% | 99.2% | 100,433 | 99,591 |
| 90% | 89.5% | 90,389 | 89,854 |
| 80% | 79.9% | 80,346 | 80,209 |
| 70% | 70.9% | 70,303 | 71,167 |
| 60% | 60.4% | 60,260 | 60,654 |
| 50% | 49.8% | 50,216 | 50,017 |
| 40% | 40.2% | 40,173 | 40,377 |
| 30% | 30.3% | 30,130 | 30,478 |
| 20% | 19.6% | 20,087 | 19,648 |
| 10% | 10.3% | 10,043 | 10,339 |
| Active Idle | 0 | 0 | |
| Target Load | Actual Load | ssj_ops | |
|---|---|---|---|
| Target | Actual | ||
| Calibration 1 | 99,033 | ||
| Calibration 2 | 100,676 | ||
| Calibration 3 | 100,245 | ||
| ssj_ops@calibrated=100,461 | |||
| 100% | 99.0% | 100,461 | 99,504 |
| 90% | 90.7% | 90,415 | 91,149 |
| 80% | 80.3% | 80,369 | 80,663 |
| 70% | 69.5% | 70,323 | 69,860 |
| 60% | 60.3% | 60,276 | 60,537 |
| 50% | 50.6% | 50,230 | 50,841 |
| 40% | 40.3% | 40,184 | 40,502 |
| 30% | 29.3% | 30,138 | 29,431 |
| 20% | 19.9% | 20,092 | 19,946 |
| 10% | 10.5% | 10,046 | 10,593 |
| Active Idle | 0 | 0 | |

| Target Load | Actual Load | ssj_ops | |
|---|---|---|---|
| Target | Actual | ||
| Calibration 1 | 102,908 | ||
| Calibration 2 | 101,982 | ||
| Calibration 3 | 103,025 | ||
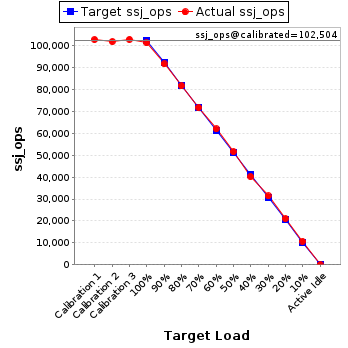
| ssj_ops@calibrated=102,504 | |||
| 100% | 98.8% | 102,504 | 101,323 |
| 90% | 89.5% | 92,253 | 91,747 |
| 80% | 79.7% | 82,003 | 81,738 |
| 70% | 70.1% | 71,753 | 71,870 |
| 60% | 60.5% | 61,502 | 62,049 |
| 50% | 50.4% | 51,252 | 51,698 |
| 40% | 39.3% | 41,001 | 40,264 |
| 30% | 30.6% | 30,751 | 31,399 |
| 20% | 20.6% | 20,501 | 21,113 |
| 10% | 10.5% | 10,250 | 10,720 |
| Active Idle | 0 | 0 | |
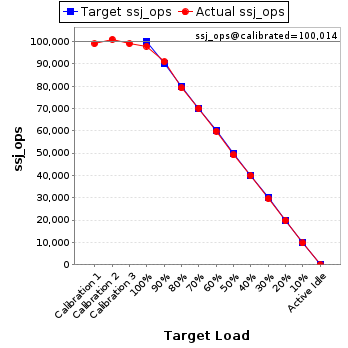
| Target Load | Actual Load | ssj_ops | |
|---|---|---|---|
| Target | Actual | ||
| Calibration 1 | 98,988 | ||
| Calibration 2 | 100,961 | ||
| Calibration 3 | 99,067 | ||
| ssj_ops@calibrated=100,014 | |||
| 100% | 97.9% | 100,014 | 97,912 |
| 90% | 91.0% | 90,013 | 90,979 |
| 80% | 79.2% | 80,011 | 79,179 |
| 70% | 70.1% | 70,010 | 70,098 |
| 60% | 59.8% | 60,008 | 59,811 |
| 50% | 49.1% | 50,007 | 49,151 |
| 40% | 39.9% | 40,006 | 39,863 |
| 30% | 29.6% | 30,004 | 29,641 |
| 20% | 19.9% | 20,003 | 19,868 |
| 10% | 9.7% | 10,001 | 9,746 |
| Active Idle | 0 | 0 | |
| Target Load | Actual Load | ssj_ops | |
|---|---|---|---|
| Target | Actual | ||
| Calibration 1 | 98,653 | ||
| Calibration 2 | 100,285 | ||
| Calibration 3 | 98,699 | ||
| ssj_ops@calibrated=99,492 | |||
| 100% | 98.3% | 99,492 | 97,830 |
| 90% | 90.8% | 89,543 | 90,380 |
| 80% | 80.4% | 79,594 | 79,995 |
| 70% | 69.4% | 69,645 | 69,041 |
| 60% | 59.9% | 59,695 | 59,620 |
| 50% | 49.6% | 49,746 | 49,342 |
| 40% | 39.5% | 39,797 | 39,345 |
| 30% | 29.4% | 29,848 | 29,243 |
| 20% | 20.6% | 19,898 | 20,476 |
| 10% | 9.9% | 9,949 | 9,874 |
| Active Idle | 0 | 0 | |

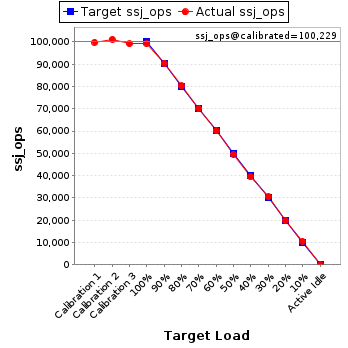
| Target Load | Actual Load | ssj_ops | |
|---|---|---|---|
| Target | Actual | ||
| Calibration 1 | 99,887 | ||
| Calibration 2 | 101,191 | ||
| Calibration 3 | 99,267 | ||
| ssj_ops@calibrated=100,229 | |||
| 100% | 99.0% | 100,229 | 99,264 |
| 90% | 90.3% | 90,206 | 90,518 |
| 80% | 80.0% | 80,183 | 80,217 |
| 70% | 70.1% | 70,160 | 70,242 |
| 60% | 60.0% | 60,137 | 60,144 |
| 50% | 49.6% | 50,114 | 49,673 |
| 40% | 39.4% | 40,092 | 39,521 |
| 30% | 30.5% | 30,069 | 30,599 |
| 20% | 19.9% | 20,046 | 19,909 |
| 10% | 10.5% | 10,023 | 10,489 |
| Active Idle | 0 | 0 | |
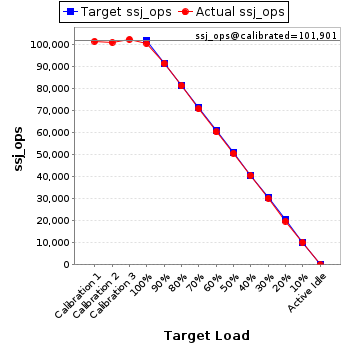
| Target Load | Actual Load | ssj_ops | |
|---|---|---|---|
| Target | Actual | ||
| Calibration 1 | 101,666 | ||
| Calibration 2 | 101,232 | ||
| Calibration 3 | 102,570 | ||
| ssj_ops@calibrated=101,901 | |||
| 100% | 98.7% | 101,901 | 100,611 |
| 90% | 89.8% | 91,711 | 91,539 |
| 80% | 79.9% | 81,521 | 81,466 |
| 70% | 69.7% | 71,331 | 70,982 |
| 60% | 59.3% | 61,141 | 60,415 |
| 50% | 49.8% | 50,951 | 50,707 |
| 40% | 39.8% | 40,761 | 40,543 |
| 30% | 29.7% | 30,570 | 30,290 |
| 20% | 19.5% | 20,380 | 19,846 |
| 10% | 10.0% | 10,190 | 10,227 |
| Active Idle | 0 | 0 | |
| Target Load | Actual Load | ssj_ops | |
|---|---|---|---|
| Target | Actual | ||
| Calibration 1 | 99,224 | ||
| Calibration 2 | 100,095 | ||
| Calibration 3 | 98,918 | ||
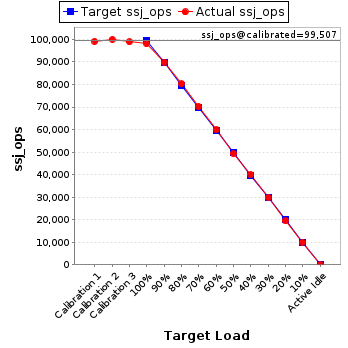
| ssj_ops@calibrated=99,507 | |||
| 100% | 98.6% | 99,507 | 98,075 |
| 90% | 90.4% | 89,556 | 89,978 |
| 80% | 80.7% | 79,605 | 80,348 |
| 70% | 70.6% | 69,655 | 70,271 |
| 60% | 60.3% | 59,704 | 59,989 |
| 50% | 49.6% | 49,753 | 49,363 |
| 40% | 40.3% | 39,803 | 40,143 |
| 30% | 30.1% | 29,852 | 29,904 |
| 20% | 19.6% | 19,901 | 19,459 |
| 10% | 10.1% | 9,951 | 10,061 |
| Active Idle | 0 | 0 | |