
SPECpower_ssj2008
Aggregate Performance Report
Copyright © 2007-2022 Standard Performance Evaluation Corporation
| Hewlett Packard Enterprise Synergy 480 Gen10 Plus Compute Module | ssj_ops@100% = 93,154,613 ssj_ops@100% per Host = 8,468,601 ssj_ops@100% per JVM = 105,858 |
||||
| Test Sponsor: | Hewlett Packard Enterprise | SPEC License #: | 3 | Test Method: | Multi Node |
| Tested By: | Hewlett Packard Enterprise | Test Location: | Houston, TX, USA | Test Date: | Dec 3, 2021 |
| Hardware Availability: | Apr-2021 | Software Availability: | Sep-2021 | Publication: | Feb 3, 2022 |
| System Source: | Single Supplier | System Designation: | Server | Power Provisioning: | Line-powered |
| Target Load | Actual Load | ssj_ops | |
|---|---|---|---|
| Target | Actual | ||
| Calibration 1 | 93,498,750 | ||
| Calibration 2 | 93,387,583 | ||
| Calibration 3 | 93,487,271 | ||
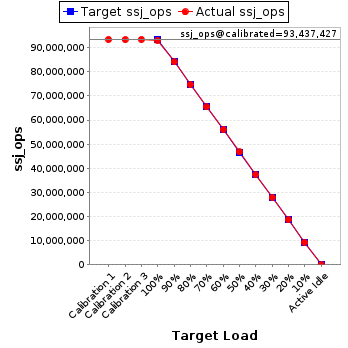
| ssj_ops@calibrated=93,437,427 | |||
| 100% | 99.7% | 93,437,427 | 93,154,613 |
| 90% | 90.0% | 84,093,684 | 84,114,082 |
| 80% | 80.0% | 74,749,942 | 74,749,163 |
| 70% | 70.0% | 65,406,199 | 65,416,363 |
| 60% | 60.0% | 56,062,456 | 56,093,603 |
| 50% | 50.0% | 46,718,714 | 46,741,777 |
| 40% | 40.0% | 37,374,971 | 37,362,101 |
| 30% | 30.0% | 28,031,228 | 28,027,483 |
| 20% | 20.0% | 18,687,485 | 18,687,268 |
| 10% | 10.0% | 9,343,743 | 9,348,514 |
| Active Idle | 0 | 0 | |
| # of Nodes | # of Chips | # of Cores | # of Threads | Total RAM (GB) | # of OS Images | # of JVM Instances |
|---|---|---|---|---|---|---|
| 11 | 22 | 880 | 1,760 | 2,816 | 11 | 880 |
| Set Identifier: | SUT |
| Set Description: | System Under Test |
| # of Identical Nodes: | 11 |
| Comment: | SUT |
| Hardware per Node | |
|---|---|
| Hardware Vendor: | Hewlett Packard Enterprise |
| Model: | Synergy 480 Gen10 Plus Compute Module |
| Form Factor: | Blade |
| CPU Name: | Intel Xeon Platinum 8380 CPU @ 2.30GHz (Intel Turbo Boost Technology up to 3.4GHz) |
| CPU Characteristics: | 40-Core, 2.30 GHz, 60MB L3 Cache |
| CPU Frequency (MHz): | 2300 |
| CPU(s) Enabled: | 80 cores, 2 chips, 40 cores/chip |
| Hardware Threads: | 160 (2 / core) |
| CPU(s) Orderable: | 1,2 chips |
| Primary Cache: | 32 KB I + 48 KB D on chip per core |
| Secondary Cache: | 1280 KB I+D on chip per core |
| Tertiary Cache: | 60 MB I+D on chip per chip |
| Other Cache: | None |
| Memory Amount (GB): | 256 |
| # and size of DIMM: | 16 x 16384 MB |
| Memory Details: | 16 x 16GB 2Rx8 PC4-3200-T; slots 1, 3, 5, 7, 10, 12, 14 & 16 on each socket |
| Power Supply Quantity and Rating (W): | None |
| Power Supply Details: | Shared |
| Disk Drive: | HPE 240GB SATA 6G Read Intensive SFF (P18420-B21) |
| Disk Controller: | Embedded SATA Controller |
| # and type of Network Interface Cards (NICs) Installed: | 1 x HPE Synergy 4820C 10/20/25Gb CNA |
| NICs Enabled in Firmware / OS / Connected: | 2/1/1 |
| Network Speed (Mbit): | 10000 |
| Keyboard: | None |
| Mouse: | None |
| Monitor: | None |
| Optical Drives: | No |
| Other Hardware: | None |
| Software per Node | |
|---|---|
| Power Management: | Enabled (see SUT Notes) |
| Operating System (OS): | Windows Server 2019 Datacenter |
| OS Version: | Version 1809 (Build 17763.2183) |
| Filesystem: | NTFS |
| JVM Vendor: | Oracle Corporation |
| JVM Version: | Oracle Java HotSpot(TM) 64-Bit Server VM 18.9 (build 11.0.11+9-LTS-194, mixed mode) |
| JVM Command-line Options: | -server -Xmn1700m -Xms1950m -Xmx1950m -XX:SurvivorRatio=1 -XX:TargetSurvivorRatio=99 -XX:ParallelGCThreads=2 -XX:AllocatePrefetchDistance=256 -XX:AllocatePrefetchLines=4 -XX:LoopUnrollLimit=45 -XX:InitialTenuringThreshold=12 -XX:MaxTenuringThreshold=15 -XX:InlineSmallCode=3900 -XX:MaxInlineSize=270 -XX:FreqInlineSize=2500 -XX:+UseLargePages -XX:+UseParallelOldGC -XX:UseAVX=0 -XX:-UseAdaptiveSizePolicy -XX:-ThreadLocalHandshakes |
| JVM Affinity: | start /NODE [0,1,2,3] /AFFINITY [3,C,30,C0,300,C00,3000,C000,30000,C0000,300000,C00000,3000000,C000000,30000000,C0000000,300000000,C00000000,3000000000,C000000000] |
| JVM Instances: | 80 |
| JVM Initial Heap (MB): | 1950 |
| JVM Maximum Heap (MB): | 1950 |
| JVM Address Bits: | 64 |
| Boot Firmware Version: | I44 v1.40 (03/05/2021) |
| Management Firmware Version: | 2.40 pass 31 Jan 05 2021 |
| Workload Version: | SSJ 1.2.10 |
| Director Location: | Controller |
| Other Software: | KB5005568 |
| Host | ssj_ops@100% |
|---|---|
| SUT-01 | 8,439,954 |
| SUT-02 | 8,430,499 |
| SUT-03 | 8,466,470 |
| SUT-04 | 8,471,406 |
| SUT-05 | 8,478,681 |
| SUT-06 | 8,493,601 |
| SUT-07 | 8,481,543 |
| SUT-08 | 8,464,137 |
| SUT-09 | 8,485,643 |
| SUT-10 | 8,481,605 |
| SUT-11 | 8,461,073 |
| ssj_ops@100% | 93,154,613 |
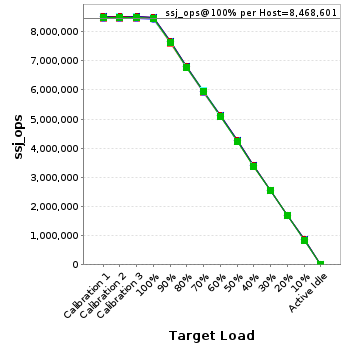
| ssj_ops@100% per Host | 8,468,601 |
| ssj_ops@100% per JVM | 105,858 |
| Target Load | Actual Load | ssj_ops | |
|---|---|---|---|
| Target | Actual | ||
| Calibration 1 | 8,459,680 | ||
| Calibration 2 | 8,457,366 | ||
| Calibration 3 | 8,463,459 | ||
| ssj_ops@calibrated=8,460,412 | |||
| 100% | 99.8% | 8,460,412 | 8,439,954 |
| 90% | 89.9% | 7,614,371 | 7,608,974 |
| 80% | 79.9% | 6,768,330 | 6,763,532 |
| 70% | 70.0% | 5,922,289 | 5,921,204 |
| 60% | 60.0% | 5,076,247 | 5,074,625 |
| 50% | 50.0% | 4,230,206 | 4,233,334 |
| 40% | 40.0% | 3,384,165 | 3,383,697 |
| 30% | 30.1% | 2,538,124 | 2,544,502 |
| 20% | 20.1% | 1,692,082 | 1,696,823 |
| 10% | 10.0% | 846,041 | 845,754 |
| Active Idle | 0 | 0 | |

| Target Load | Actual Load | ssj_ops | |
|---|---|---|---|
| Target | Actual | ||
| Calibration 1 | 8,470,006 | ||
| Calibration 2 | 8,454,205 | ||
| Calibration 3 | 8,468,022 | ||
| ssj_ops@calibrated=8,461,114 | |||
| 100% | 99.6% | 8,461,114 | 8,430,499 |
| 90% | 90.1% | 7,615,002 | 7,622,002 |
| 80% | 80.0% | 6,768,891 | 6,771,395 |
| 70% | 70.0% | 5,922,779 | 5,920,930 |
| 60% | 60.0% | 5,076,668 | 5,079,137 |
| 50% | 50.1% | 4,230,557 | 4,235,997 |
| 40% | 40.1% | 3,384,445 | 3,390,889 |
| 30% | 30.0% | 2,538,334 | 2,540,343 |
| 20% | 20.0% | 1,692,223 | 1,690,779 |
| 10% | 10.0% | 846,111 | 845,811 |
| Active Idle | 0 | 0 | |

| Target Load | Actual Load | ssj_ops | |
|---|---|---|---|
| Target | Actual | ||
| Calibration 1 | 8,481,898 | ||
| Calibration 2 | 8,486,214 | ||
| Calibration 3 | 8,494,624 | ||
| ssj_ops@calibrated=8,490,419 | |||
| 100% | 99.7% | 8,490,419 | 8,466,470 |
| 90% | 90.1% | 7,641,377 | 7,645,879 |
| 80% | 80.0% | 6,792,335 | 6,791,711 |
| 70% | 70.1% | 5,943,293 | 5,949,326 |
| 60% | 60.1% | 5,094,251 | 5,099,488 |
| 50% | 50.0% | 4,245,210 | 4,243,613 |
| 40% | 40.0% | 3,396,168 | 3,393,498 |
| 30% | 30.0% | 2,547,126 | 2,546,151 |
| 20% | 20.0% | 1,698,084 | 1,696,011 |
| 10% | 10.0% | 849,042 | 850,617 |
| Active Idle | 0 | 0 | |

| Target Load | Actual Load | ssj_ops | |
|---|---|---|---|
| Target | Actual | ||
| Calibration 1 | 8,499,639 | ||
| Calibration 2 | 8,484,935 | ||
| Calibration 3 | 8,494,743 | ||
| ssj_ops@calibrated=8,489,839 | |||
| 100% | 99.8% | 8,489,839 | 8,471,406 |
| 90% | 90.0% | 7,640,855 | 7,643,503 |
| 80% | 80.1% | 6,791,871 | 6,799,821 |
| 70% | 70.0% | 5,942,887 | 5,946,914 |
| 60% | 60.1% | 5,093,903 | 5,106,198 |
| 50% | 50.1% | 4,244,919 | 4,250,327 |
| 40% | 40.0% | 3,395,936 | 3,398,972 |
| 30% | 30.0% | 2,546,952 | 2,545,333 |
| 20% | 20.0% | 1,697,968 | 1,698,073 |
| 10% | 10.0% | 848,984 | 852,905 |
| Active Idle | 0 | 0 | |

| Target Load | Actual Load | ssj_ops | |
|---|---|---|---|
| Target | Actual | ||
| Calibration 1 | 8,501,742 | ||
| Calibration 2 | 8,501,022 | ||
| Calibration 3 | 8,510,110 | ||
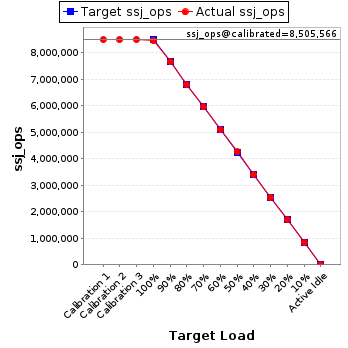
| ssj_ops@calibrated=8,505,566 | |||
| 100% | 99.7% | 8,505,566 | 8,478,681 |
| 90% | 90.0% | 7,655,009 | 7,658,425 |
| 80% | 80.0% | 6,804,453 | 6,800,418 |
| 70% | 70.0% | 5,953,896 | 5,956,750 |
| 60% | 60.0% | 5,103,340 | 5,107,331 |
| 50% | 50.0% | 4,252,783 | 4,256,378 |
| 40% | 40.0% | 3,402,226 | 3,403,516 |
| 30% | 30.0% | 2,551,670 | 2,549,784 |
| 20% | 20.0% | 1,701,113 | 1,704,660 |
| 10% | 10.0% | 850,557 | 849,247 |
| Active Idle | 0 | 0 | |
| Target Load | Actual Load | ssj_ops | |
|---|---|---|---|
| Target | Actual | ||
| Calibration 1 | 8,516,603 | ||
| Calibration 2 | 8,515,284 | ||
| Calibration 3 | 8,526,325 | ||
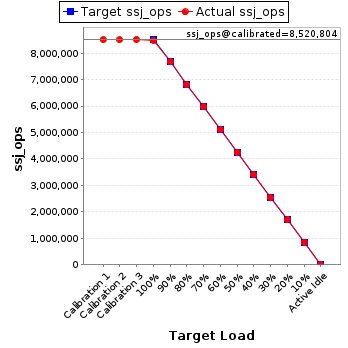
| ssj_ops@calibrated=8,520,804 | |||
| 100% | 99.7% | 8,520,804 | 8,493,601 |
| 90% | 90.0% | 7,668,724 | 7,669,956 |
| 80% | 80.0% | 6,816,643 | 6,815,271 |
| 70% | 70.1% | 5,964,563 | 5,970,734 |
| 60% | 60.1% | 5,112,483 | 5,118,450 |
| 50% | 50.0% | 4,260,402 | 4,260,938 |
| 40% | 40.0% | 3,408,322 | 3,406,111 |
| 30% | 30.0% | 2,556,241 | 2,555,676 |
| 20% | 20.0% | 1,704,161 | 1,703,490 |
| 10% | 10.0% | 852,080 | 850,516 |
| Active Idle | 0 | 0 | |
| Target Load | Actual Load | ssj_ops | |
|---|---|---|---|
| Target | Actual | ||
| Calibration 1 | 8,524,001 | ||
| Calibration 2 | 8,508,847 | ||
| Calibration 3 | 8,514,267 | ||
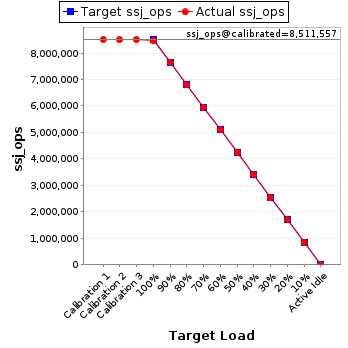
| ssj_ops@calibrated=8,511,557 | |||
| 100% | 99.6% | 8,511,557 | 8,481,543 |
| 90% | 90.0% | 7,660,401 | 7,660,156 |
| 80% | 80.0% | 6,809,246 | 6,805,244 |
| 70% | 70.0% | 5,958,090 | 5,958,199 |
| 60% | 60.0% | 5,106,934 | 5,104,622 |
| 50% | 50.0% | 4,255,778 | 4,255,804 |
| 40% | 40.0% | 3,404,623 | 3,404,649 |
| 30% | 30.0% | 2,553,467 | 2,551,474 |
| 20% | 20.0% | 1,702,311 | 1,700,205 |
| 10% | 10.0% | 851,156 | 853,588 |
| Active Idle | 0 | 0 | |
| Target Load | Actual Load | ssj_ops | |
|---|---|---|---|
| Target | Actual | ||
| Calibration 1 | 8,515,381 | ||
| Calibration 2 | 8,493,903 | ||
| Calibration 3 | 8,503,148 | ||
| ssj_ops@calibrated=8,498,525 | |||
| 100% | 99.6% | 8,498,525 | 8,464,137 |
| 90% | 90.0% | 7,648,673 | 7,649,660 |
| 80% | 80.0% | 6,798,820 | 6,795,479 |
| 70% | 69.9% | 5,948,968 | 5,943,657 |
| 60% | 60.0% | 5,099,115 | 5,101,543 |
| 50% | 50.0% | 4,249,263 | 4,248,487 |
| 40% | 40.0% | 3,399,410 | 3,400,765 |
| 30% | 29.9% | 2,549,558 | 2,544,040 |
| 20% | 20.0% | 1,699,705 | 1,702,086 |
| 10% | 10.0% | 849,853 | 849,177 |
| Active Idle | 0 | 0 | |

| Target Load | Actual Load | ssj_ops | |
|---|---|---|---|
| Target | Actual | ||
| Calibration 1 | 8,517,920 | ||
| Calibration 2 | 8,507,370 | ||
| Calibration 3 | 8,516,967 | ||
| ssj_ops@calibrated=8,512,168 | |||
| 100% | 99.7% | 8,512,168 | 8,485,643 |
| 90% | 90.1% | 7,660,951 | 7,668,381 |
| 80% | 80.1% | 6,809,735 | 6,814,399 |
| 70% | 70.0% | 5,958,518 | 5,954,482 |
| 60% | 60.0% | 5,107,301 | 5,106,443 |
| 50% | 50.1% | 4,256,084 | 4,262,291 |
| 40% | 40.0% | 3,404,867 | 3,404,059 |
| 30% | 30.0% | 2,553,650 | 2,552,557 |
| 20% | 20.0% | 1,702,434 | 1,701,374 |
| 10% | 10.0% | 851,217 | 853,533 |
| Active Idle | 0 | 0 | |

| Target Load | Actual Load | ssj_ops | |
|---|---|---|---|
| Target | Actual | ||
| Calibration 1 | 8,521,146 | ||
| Calibration 2 | 8,499,078 | ||
| Calibration 3 | 8,509,673 | ||
| ssj_ops@calibrated=8,504,375 | |||
| 100% | 99.7% | 8,504,375 | 8,481,605 |
| 90% | 90.0% | 7,653,938 | 7,653,088 |
| 80% | 80.1% | 6,803,500 | 6,808,411 |
| 70% | 70.1% | 5,953,063 | 5,957,580 |
| 60% | 60.1% | 5,102,625 | 5,111,772 |
| 50% | 50.0% | 4,252,188 | 4,255,077 |
| 40% | 39.9% | 3,401,750 | 3,394,227 |
| 30% | 30.0% | 2,551,313 | 2,551,309 |
| 20% | 20.0% | 1,700,875 | 1,699,576 |
| 10% | 10.0% | 850,438 | 851,899 |
| Active Idle | 0 | 0 | |

| Target Load | Actual Load | ssj_ops | |
|---|---|---|---|
| Target | Actual | ||
| Calibration 1 | 8,490,734 | ||
| Calibration 2 | 8,479,360 | ||
| Calibration 3 | 8,485,934 | ||
| ssj_ops@calibrated=8,482,647 | |||
| 100% | 99.7% | 8,482,647 | 8,461,073 |
| 90% | 90.0% | 7,634,382 | 7,634,058 |
| 80% | 80.0% | 6,786,118 | 6,783,482 |
| 70% | 70.0% | 5,937,853 | 5,936,587 |
| 60% | 59.9% | 5,089,588 | 5,083,994 |
| 50% | 50.0% | 4,241,323 | 4,239,531 |
| 40% | 39.9% | 3,393,059 | 3,381,719 |
| 30% | 30.0% | 2,544,794 | 2,546,313 |
| 20% | 20.0% | 1,696,529 | 1,694,190 |
| 10% | 10.0% | 848,265 | 845,467 |
| Active Idle | 0 | 0 | |
