
SPECpower_ssj2008
Aggregate Performance Report
Copyright © 2007-2022 Standard Performance Evaluation Corporation
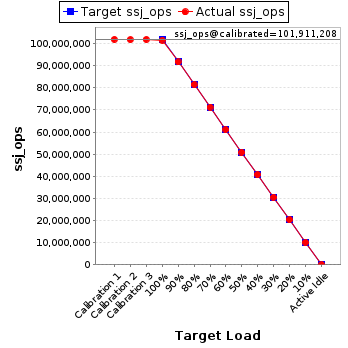
| Hewlett Packard Enterprise Synergy 480 Gen10 Plus Compute Module | ssj_ops@100% = 101,627,781 ssj_ops@100% per Host = 8,468,982 ssj_ops@100% per JVM = 105,862 |
||||
| Test Sponsor: | Hewlett Packard Enterprise | SPEC License #: | 3 | Test Method: | Multi Node |
| Tested By: | Hewlett Packard Enterprise | Test Location: | Houston, TX, USA | Test Date: | Nov 24, 2021 |
| Hardware Availability: | Apr-2021 | Software Availability: | Sep-2021 | Publication: | Feb 3, 2022 |
| System Source: | Single Supplier | System Designation: | Server | Power Provisioning: | Line-powered |
| Target Load | Actual Load | ssj_ops | |
|---|---|---|---|
| Target | Actual | ||
| Calibration 1 | 102,004,589 | ||
| Calibration 2 | 101,859,522 | ||
| Calibration 3 | 101,962,893 | ||
| ssj_ops@calibrated=101,911,208 | |||
| 100% | 99.7% | 101,911,208 | 101,627,781 |
| 90% | 90.0% | 91,720,087 | 91,718,789 |
| 80% | 80.0% | 81,528,966 | 81,503,636 |
| 70% | 70.0% | 71,337,846 | 71,330,585 |
| 60% | 60.0% | 61,146,725 | 61,163,550 |
| 50% | 50.0% | 50,955,604 | 50,962,963 |
| 40% | 40.0% | 40,764,483 | 40,772,240 |
| 30% | 30.0% | 30,573,362 | 30,571,249 |
| 20% | 20.0% | 20,382,242 | 20,368,613 |
| 10% | 10.0% | 10,191,121 | 10,182,830 |
| Active Idle | 0 | 0 | |
| # of Nodes | # of Chips | # of Cores | # of Threads | Total RAM (GB) | # of OS Images | # of JVM Instances |
|---|---|---|---|---|---|---|
| 12 | 24 | 960 | 1,920 | 3,072 | 12 | 960 |
| Set Identifier: | SUT |
| Set Description: | System Under Test |
| # of Identical Nodes: | 12 |
| Comment: | SUT |
| Hardware per Node | |
|---|---|
| Hardware Vendor: | Hewlett Packard Enterprise |
| Model: | Synergy 480 Gen10 Plus Compute Module |
| Form Factor: | Blade |
| CPU Name: | Intel Xeon Platinum 8380 CPU @ 2.30GHz (Intel Turbo Boost Technology up to 3.4GHz) |
| CPU Characteristics: | 40-Core, 2.30 GHz, 60MB L3 Cache |
| CPU Frequency (MHz): | 2300 |
| CPU(s) Enabled: | 80 cores, 2 chips, 40 cores/chip |
| Hardware Threads: | 160 (2 / core) |
| CPU(s) Orderable: | 1,2 chips |
| Primary Cache: | 32 KB I + 48 KB D on chip per core |
| Secondary Cache: | 1280 KB I+D on chip per core |
| Tertiary Cache: | 60 MB I+D on chip per chip |
| Other Cache: | None |
| Memory Amount (GB): | 256 |
| # and size of DIMM: | 16 x 16384 MB |
| Memory Details: | 16 x 16GB 2Rx8 PC4-3200-T; slots 1, 3, 5, 7, 10, 12, 14 & 16 on each socket |
| Power Supply Quantity and Rating (W): | None |
| Power Supply Details: | Shared |
| Disk Drive: | HPE 240GB SATA 6G Read Intensive SFF (P18420-B21) |
| Disk Controller: | Embedded SATA Controller |
| # and type of Network Interface Cards (NICs) Installed: | 1 x HPE Synergy 4820C 10/20/25Gb CNA |
| NICs Enabled in Firmware / OS / Connected: | 2/1/1 |
| Network Speed (Mbit): | 10000 |
| Keyboard: | None |
| Mouse: | None |
| Monitor: | None |
| Optical Drives: | No |
| Other Hardware: | None |
| Software per Node | |
|---|---|
| Power Management: | Enabled (see SUT Notes) |
| Operating System (OS): | Windows Server 2019 Datacenter |
| OS Version: | Version 1809 (Build 17763.2183) |
| Filesystem: | NTFS |
| JVM Vendor: | Oracle Corporation |
| JVM Version: | Oracle Java HotSpot(TM) 64-Bit Server VM 18.9 (build 11.0.11+9-LTS-194, mixed mode) |
| JVM Command-line Options: | -server -Xmn1700m -Xms1950m -Xmx1950m -XX:SurvivorRatio=1 -XX:TargetSurvivorRatio=99 -XX:ParallelGCThreads=2 -XX:AllocatePrefetchDistance=256 -XX:AllocatePrefetchLines=4 -XX:LoopUnrollLimit=45 -XX:InitialTenuringThreshold=12 -XX:MaxTenuringThreshold=15 -XX:InlineSmallCode=3900 -XX:MaxInlineSize=270 -XX:FreqInlineSize=2500 -XX:+UseLargePages -XX:+UseParallelOldGC -XX:UseAVX=0 -XX:-UseAdaptiveSizePolicy -XX:-ThreadLocalHandshakes |
| JVM Affinity: | start /NODE [0,1,2,3] /AFFINITY [3,C,30,C0,300,C00,3000,C000,30000,C0000,300000,C00000,3000000,C000000,30000000,C0000000,300000000,C00000000,3000000000,C000000000] |
| JVM Instances: | 80 |
| JVM Initial Heap (MB): | 1950 |
| JVM Maximum Heap (MB): | 1950 |
| JVM Address Bits: | 64 |
| Boot Firmware Version: | I44 v1.40 (03/05/2021) |
| Management Firmware Version: | 2.40 pass 31 Jan 05 2021 |
| Workload Version: | SSJ 1.2.10 |
| Director Location: | Controller |
| Other Software: | KB5005568 |
| Host | ssj_ops@100% |
|---|---|
| SUT-01 | 8,457,739 |
| SUT-02 | 8,459,706 |
| SUT-03 | 8,474,579 |
| SUT-04 | 8,498,333 |
| SUT-05 | 8,459,794 |
| SUT-06 | 8,446,534 |
| SUT-07 | 8,478,018 |
| SUT-08 | 8,435,913 |
| SUT-09 | 8,508,922 |
| SUT-10 | 8,479,304 |
| SUT-11 | 8,442,546 |
| SUT-12 | 8,486,393 |
| ssj_ops@100% | 101,627,781 |
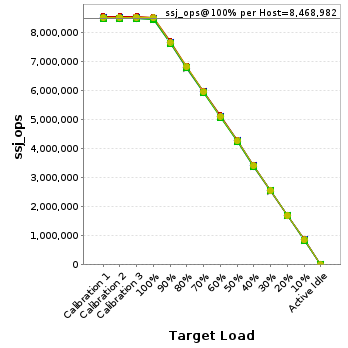
| ssj_ops@100% per Host | 8,468,982 |
| ssj_ops@100% per JVM | 105,862 |
| Target Load | Actual Load | ssj_ops | |
|---|---|---|---|
| Target | Actual | ||
| Calibration 1 | 8,472,215 | ||
| Calibration 2 | 8,477,507 | ||
| Calibration 3 | 8,489,186 | ||
| ssj_ops@calibrated=8,483,347 | |||
| 100% | 99.7% | 8,483,347 | 8,457,739 |
| 90% | 90.0% | 7,635,012 | 7,638,923 |
| 80% | 80.0% | 6,786,677 | 6,788,477 |
| 70% | 70.0% | 5,938,343 | 5,941,685 |
| 60% | 60.1% | 5,090,008 | 5,095,560 |
| 50% | 50.0% | 4,241,673 | 4,244,998 |
| 40% | 40.0% | 3,393,339 | 3,391,336 |
| 30% | 30.0% | 2,545,004 | 2,547,197 |
| 20% | 19.9% | 1,696,669 | 1,691,231 |
| 10% | 10.0% | 848,335 | 847,006 |
| Active Idle | 0 | 0 | |

| Target Load | Actual Load | ssj_ops | |
|---|---|---|---|
| Target | Actual | ||
| Calibration 1 | 8,491,030 | ||
| Calibration 2 | 8,473,023 | ||
| Calibration 3 | 8,479,484 | ||
| ssj_ops@calibrated=8,476,253 | |||
| 100% | 99.8% | 8,476,253 | 8,459,706 |
| 90% | 89.9% | 7,628,628 | 7,623,209 |
| 80% | 80.0% | 6,781,002 | 6,785,004 |
| 70% | 70.0% | 5,933,377 | 5,937,092 |
| 60% | 60.0% | 5,085,752 | 5,084,835 |
| 50% | 50.0% | 4,238,127 | 4,235,631 |
| 40% | 40.0% | 3,390,501 | 3,388,424 |
| 30% | 30.0% | 2,542,876 | 2,542,867 |
| 20% | 20.0% | 1,695,251 | 1,693,072 |
| 10% | 10.0% | 847,625 | 844,776 |
| Active Idle | 0 | 0 | |

| Target Load | Actual Load | ssj_ops | |
|---|---|---|---|
| Target | Actual | ||
| Calibration 1 | 8,497,163 | ||
| Calibration 2 | 8,492,338 | ||
| Calibration 3 | 8,502,714 | ||
| ssj_ops@calibrated=8,497,526 | |||
| 100% | 99.7% | 8,497,526 | 8,474,579 |
| 90% | 90.1% | 7,647,774 | 7,652,437 |
| 80% | 80.0% | 6,798,021 | 6,793,978 |
| 70% | 70.0% | 5,948,268 | 5,947,034 |
| 60% | 60.0% | 5,098,516 | 5,101,444 |
| 50% | 50.0% | 4,248,763 | 4,247,345 |
| 40% | 40.0% | 3,399,010 | 3,397,684 |
| 30% | 30.0% | 2,549,258 | 2,548,315 |
| 20% | 20.0% | 1,699,505 | 1,699,261 |
| 10% | 10.0% | 849,753 | 846,116 |
| Active Idle | 0 | 0 | |

| Target Load | Actual Load | ssj_ops | |
|---|---|---|---|
| Target | Actual | ||
| Calibration 1 | 8,536,259 | ||
| Calibration 2 | 8,518,009 | ||
| Calibration 3 | 8,525,185 | ||
| ssj_ops@calibrated=8,521,597 | |||
| 100% | 99.7% | 8,521,597 | 8,498,333 |
| 90% | 90.1% | 7,669,437 | 7,673,918 |
| 80% | 80.0% | 6,817,277 | 6,814,232 |
| 70% | 70.0% | 5,965,118 | 5,964,828 |
| 60% | 60.0% | 5,112,958 | 5,114,805 |
| 50% | 50.0% | 4,260,798 | 4,257,218 |
| 40% | 40.0% | 3,408,639 | 3,411,614 |
| 30% | 30.1% | 2,556,479 | 2,561,366 |
| 20% | 20.0% | 1,704,319 | 1,702,052 |
| 10% | 10.0% | 852,160 | 850,837 |
| Active Idle | 0 | 0 | |

| Target Load | Actual Load | ssj_ops | |
|---|---|---|---|
| Target | Actual | ||
| Calibration 1 | 8,490,369 | ||
| Calibration 2 | 8,482,620 | ||
| Calibration 3 | 8,485,791 | ||
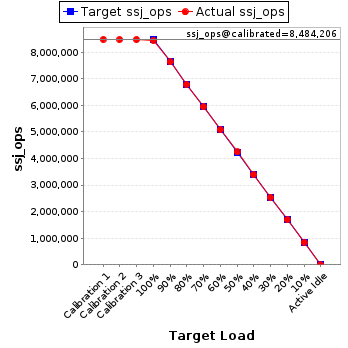
| ssj_ops@calibrated=8,484,206 | |||
| 100% | 99.7% | 8,484,206 | 8,459,794 |
| 90% | 90.0% | 7,635,785 | 7,638,461 |
| 80% | 80.1% | 6,787,364 | 6,794,475 |
| 70% | 70.1% | 5,938,944 | 5,945,268 |
| 60% | 60.0% | 5,090,523 | 5,086,760 |
| 50% | 50.0% | 4,242,103 | 4,243,905 |
| 40% | 40.0% | 3,393,682 | 3,393,735 |
| 30% | 30.0% | 2,545,262 | 2,547,884 |
| 20% | 20.0% | 1,696,841 | 1,698,334 |
| 10% | 10.0% | 848,421 | 845,576 |
| Active Idle | 0 | 0 | |
| Target Load | Actual Load | ssj_ops | |
|---|---|---|---|
| Target | Actual | ||
| Calibration 1 | 8,487,369 | ||
| Calibration 2 | 8,467,582 | ||
| Calibration 3 | 8,476,111 | ||
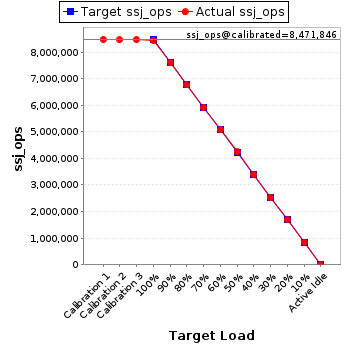
| ssj_ops@calibrated=8,471,846 | |||
| 100% | 99.7% | 8,471,846 | 8,446,534 |
| 90% | 90.0% | 7,624,662 | 7,626,431 |
| 80% | 79.9% | 6,777,477 | 6,765,151 |
| 70% | 70.0% | 5,930,292 | 5,931,933 |
| 60% | 60.0% | 5,083,108 | 5,079,700 |
| 50% | 50.1% | 4,235,923 | 4,244,556 |
| 40% | 40.0% | 3,388,739 | 3,389,857 |
| 30% | 30.0% | 2,541,554 | 2,540,623 |
| 20% | 20.0% | 1,694,369 | 1,691,040 |
| 10% | 10.0% | 847,185 | 848,742 |
| Active Idle | 0 | 0 | |
| Target Load | Actual Load | ssj_ops | |
|---|---|---|---|
| Target | Actual | ||
| Calibration 1 | 8,505,955 | ||
| Calibration 2 | 8,498,327 | ||
| Calibration 3 | 8,504,771 | ||
| ssj_ops@calibrated=8,501,549 | |||
| 100% | 99.7% | 8,501,549 | 8,478,018 |
| 90% | 89.9% | 7,651,394 | 7,646,637 |
| 80% | 80.0% | 6,801,239 | 6,799,548 |
| 70% | 69.9% | 5,951,084 | 5,946,510 |
| 60% | 60.1% | 5,100,929 | 5,108,835 |
| 50% | 49.9% | 4,250,774 | 4,246,238 |
| 40% | 40.0% | 3,400,620 | 3,402,021 |
| 30% | 30.0% | 2,550,465 | 2,551,649 |
| 20% | 20.0% | 1,700,310 | 1,697,060 |
| 10% | 10.0% | 850,155 | 848,761 |
| Active Idle | 0 | 0 | |

| Target Load | Actual Load | ssj_ops | |
|---|---|---|---|
| Target | Actual | ||
| Calibration 1 | 8,488,711 | ||
| Calibration 2 | 8,465,531 | ||
| Calibration 3 | 8,473,700 | ||
| ssj_ops@calibrated=8,469,616 | |||
| 100% | 99.6% | 8,469,616 | 8,435,913 |
| 90% | 89.9% | 7,622,654 | 7,615,372 |
| 80% | 79.9% | 6,775,693 | 6,764,832 |
| 70% | 70.1% | 5,928,731 | 5,936,435 |
| 60% | 60.1% | 5,081,769 | 5,088,559 |
| 50% | 50.0% | 4,234,808 | 4,236,008 |
| 40% | 40.0% | 3,387,846 | 3,386,115 |
| 30% | 29.9% | 2,540,885 | 2,532,259 |
| 20% | 20.0% | 1,693,923 | 1,697,263 |
| 10% | 10.0% | 846,962 | 844,319 |
| Active Idle | 0 | 0 | |

| Target Load | Actual Load | ssj_ops | |
|---|---|---|---|
| Target | Actual | ||
| Calibration 1 | 8,539,506 | ||
| Calibration 2 | 8,530,251 | ||
| Calibration 3 | 8,536,380 | ||
| ssj_ops@calibrated=8,533,316 | |||
| 100% | 99.7% | 8,533,316 | 8,508,922 |
| 90% | 90.0% | 7,679,984 | 7,680,895 |
| 80% | 79.9% | 6,826,653 | 6,820,819 |
| 70% | 69.9% | 5,973,321 | 5,967,090 |
| 60% | 60.0% | 5,119,989 | 5,119,699 |
| 50% | 49.9% | 4,266,658 | 4,258,217 |
| 40% | 40.0% | 3,413,326 | 3,411,404 |
| 30% | 30.0% | 2,559,995 | 2,556,147 |
| 20% | 20.0% | 1,706,663 | 1,705,496 |
| 10% | 10.0% | 853,332 | 852,903 |
| Active Idle | 0 | 0 | |

| Target Load | Actual Load | ssj_ops | |
|---|---|---|---|
| Target | Actual | ||
| Calibration 1 | 8,510,205 | ||
| Calibration 2 | 8,492,156 | ||
| Calibration 3 | 8,505,120 | ||
| ssj_ops@calibrated=8,498,638 | |||
| 100% | 99.8% | 8,498,638 | 8,479,304 |
| 90% | 90.1% | 7,648,774 | 7,653,361 |
| 80% | 80.0% | 6,798,910 | 6,797,911 |
| 70% | 69.9% | 5,949,047 | 5,939,942 |
| 60% | 60.0% | 5,099,183 | 5,100,709 |
| 50% | 50.1% | 4,249,319 | 4,254,625 |
| 40% | 40.0% | 3,399,455 | 3,402,730 |
| 30% | 30.0% | 2,549,591 | 2,547,260 |
| 20% | 20.0% | 1,699,728 | 1,701,188 |
| 10% | 10.0% | 849,864 | 852,564 |
| Active Idle | 0 | 0 | |

| Target Load | Actual Load | ssj_ops | |
|---|---|---|---|
| Target | Actual | ||
| Calibration 1 | 8,481,018 | ||
| Calibration 2 | 8,458,288 | ||
| Calibration 3 | 8,469,135 | ||
| ssj_ops@calibrated=8,463,712 | |||
| 100% | 99.7% | 8,463,712 | 8,442,546 |
| 90% | 90.0% | 7,617,341 | 7,616,095 |
| 80% | 80.0% | 6,770,969 | 6,771,437 |
| 70% | 70.0% | 5,924,598 | 5,927,886 |
| 60% | 60.0% | 5,078,227 | 5,075,331 |
| 50% | 50.0% | 4,231,856 | 4,235,776 |
| 40% | 40.1% | 3,385,485 | 3,390,442 |
| 30% | 30.0% | 2,539,114 | 2,538,423 |
| 20% | 20.0% | 1,692,742 | 1,696,339 |
| 10% | 10.0% | 846,371 | 847,604 |
| Active Idle | 0 | 0 | |

| Target Load | Actual Load | ssj_ops | |
|---|---|---|---|
| Target | Actual | ||
| Calibration 1 | 8,504,789 | ||
| Calibration 2 | 8,503,890 | ||
| Calibration 3 | 8,515,316 | ||
| ssj_ops@calibrated=8,509,603 | |||
| 100% | 99.7% | 8,509,603 | 8,486,393 |
| 90% | 89.9% | 7,658,643 | 7,653,050 |
| 80% | 80.0% | 6,807,682 | 6,807,771 |
| 70% | 69.9% | 5,956,722 | 5,944,883 |
| 60% | 60.0% | 5,105,762 | 5,107,314 |
| 50% | 50.0% | 4,254,802 | 4,258,445 |
| 40% | 40.0% | 3,403,841 | 3,406,877 |
| 30% | 30.1% | 2,552,881 | 2,557,258 |
| 20% | 19.9% | 1,701,921 | 1,696,278 |
| 10% | 10.0% | 850,960 | 853,627 |
| Active Idle | 0 | 0 | |
