SPECpower_ssj2008
Host 'test01' Performance Report
Copyright © 2007-2022 Standard Performance Evaluation Corporation
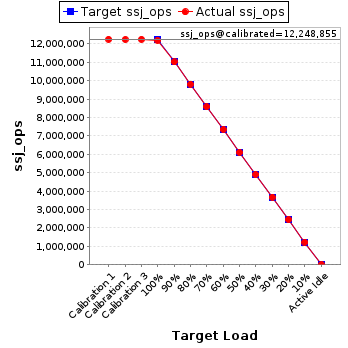
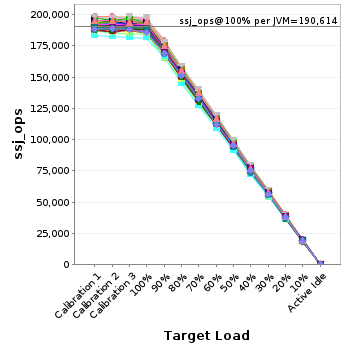
| ASUSTeK Computer Inc. RS700A-E11-RS4U | ssj_ops@100% = 12,199,307 ssj_ops@100% per JVM = 190,614 |
||||
| Test Sponsor: | ASUSTeK Computer Inc. | SPEC License #: | 9016 | Test Method: | Single Node |
| Tested By: | ASUSTeK Computer Inc. | Test Location: | Taipei, Taiwan. | Test Date: | Jun 14, 2022 |
| Hardware Availability: | May-2022 | Software Availability: | May-2022 | Publication: | Jul 13, 2022 |
| System Source: | Single Supplier | System Designation: | Server | Power Provisioning: | Line-powered |
| Target Load | Actual Load | ssj_ops | |
|---|---|---|---|
| Target | Actual | ||
| Calibration 1 | 12,255,512 | ||
| Calibration 2 | 12,243,364 | ||
| Calibration 3 | 12,254,346 | ||
| ssj_ops@calibrated=12,248,855 | |||
| 100% | 99.6% | 12,248,855 | 12,199,307 |
| 90% | 90.0% | 11,023,969 | 11,018,688 |
| 80% | 80.2% | 9,799,084 | 9,819,334 |
| 70% | 70.1% | 8,574,198 | 8,582,083 |
| 60% | 60.0% | 7,349,313 | 7,353,001 |
| 50% | 49.9% | 6,124,427 | 6,115,354 |
| 40% | 40.0% | 4,899,542 | 4,895,316 |
| 30% | 30.0% | 3,674,656 | 3,673,080 |
| 20% | 20.0% | 2,449,771 | 2,450,649 |
| 10% | 10.0% | 1,224,885 | 1,227,318 |
| Active Idle | 0 | 0 | |
| Set Identifier: | RS700A-E11-RS4U |
| Set Description: | System Under Test |
| # of Identical Nodes: | 1 |
| Comment: | 'SUT' |
| Hardware | |
|---|---|
| Hardware Vendor: | ASUSTeK Computer Inc. |
| Model: | RS700A-E11-RS4U |
| Form Factor: | 1U |
| CPU Name: | AMD EPYC 7763 |
| CPU Characteristics: | 64-Core, 2.45GHz, 256MB L3 Cache |
| CPU Frequency (MHz): | 2450 |
| CPU(s) Enabled: | 128 cores, 2 chips, 64 cores/chip |
| Hardware Threads: | 256 (2 / core) |
| CPU(s) Orderable: | 1,2 chips |
| Primary Cache: | 32 KB I + 32 KB D on chip per core |
| Secondary Cache: | 512 KB I+D on chip per core |
| Tertiary Cache: | 256 MB I+D on chip per chip |
| Other Cache: | None |
| Memory Amount (GB): | 256 |
| # and size of DIMM: | 16 x 16 GB |
| Memory Details: | 16 x 16GB 2Rx8 PC4-3200AA-R ECC RDIMM; slots DIMM_A2, DIMM_B2, DIMM_C2, DIMM_D2, DIMM_E2, DIMM_F2, DIMM_G2, DIMM_H2, DIMM_I2, DIMM_J2, DIMM_K2, DIMM_L2, DIMM_M2, DIMM_N2, DIMM_O2, DIMM_P2 populated |
| Power Supply Quantity and Rating (W): | 1 x 1600 |
| Power Supply Details: | CHICONY R18-1K6P1WA REV:01 P/N: 0A100-00250800 |
| Disk Drive: | 1 x 256GB Samsung P4X4 M.2 PCIE SSD P/N: 03B03-00420800 |
| Disk Controller: | Integrated PCIE controller |
| # and type of Network Interface Cards (NICs) Installed: | 1 x Quad-port Intel I350 Gigabit Ethernet controller |
| NICs Enabled in Firmware / OS / Connected: | 4/4/2 |
| Network Speed (Mbit): | 1000 |
| Keyboard: | None |
| Mouse: | None |
| Monitor: | None |
| Optical Drives: | No |
| Other Hardware: | None |
| Software | |
|---|---|
| Power Management: | Enabled (See SUT Notes) |
| Operating System (OS): | SUSE Linux Enterprise Server 15 SP2 |
| OS Version: | 5.3.18-22-default |
| Filesystem: | xfs |
| JVM Vendor: | Oracle Corporation |
| JVM Version: | Oracle Java HotSpot(TM) 64-Bit Server VM 18.9 (build 11.0.15.1+2-LTS-10, mixed mode), version 11.0.15.1 |
| JVM Command-line Options: | -server -Xmn1825m -Xms1995m -Xmx1995m -XX:SurvivorRatio=1 -XX:TargetSurvivorRatio=99 -XX:ParallelGCThreads=2 -XX:AllocatePrefetchDistance=256 -XX:AllocatePrefetchLines=4 -XX:LoopUnrollLimit=45 -XX:InitialTenuringThreshold=12 -XX:MaxTenuringThreshold=15 -XX:InlineSmallCode=3900 -XX:MaxInlineSize=270 -XX:FreqInlineSize=2500 -XX:+UseLargePages -XX:+UseParallelOldGC -XX:+UseHugeTLBFS -XX:+UseTransparentHugePages -XX:UseAVX=1 -XX:BiasedLockingStartupDelay=30000 -XX:-ThreadLocalHandshakes |
| JVM Affinity: | for each even physicalCoreId { numactl -C physicalCoreId, physicalCoreId+1, physicalCoreId + 128, physicalCoreId + 129 --membind=0,1,2,3,4,5,6,7,8,9,10,11,12,13,14,15 } |
| JVM Instances: | 64 |
| JVM Initial Heap (MB): | 1995 |
| JVM Maximum Heap (MB): | 1995 |
| JVM Address Bits: | 64 |
| Boot Firmware Version: | 1001 |
| Management Firmware Version: | 1.2.10 |
| Workload Version: | SSJ 1.2.10 |
| Director Location: | Controller |
| Other Software: | ASUS Control Center V1.4.3.5 |
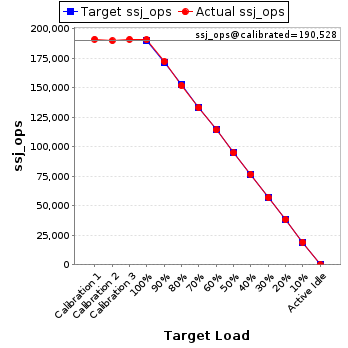
| Target Load | Actual Load | ssj_ops | |
|---|---|---|---|
| Target | Actual | ||
| Calibration 1 | 191,222 | ||
| Calibration 2 | 189,963 | ||
| Calibration 3 | 191,092 | ||
| ssj_ops@calibrated=190,528 | |||
| 100% | 100.2% | 190,528 | 190,946 |
| 90% | 90.4% | 171,475 | 172,319 |
| 80% | 79.7% | 152,422 | 151,790 |
| 70% | 69.9% | 133,369 | 133,116 |
| 60% | 60.0% | 114,317 | 114,245 |
| 50% | 49.7% | 95,264 | 94,750 |
| 40% | 40.2% | 76,211 | 76,616 |
| 30% | 29.9% | 57,158 | 56,887 |
| 20% | 20.1% | 38,106 | 38,242 |
| 10% | 10.0% | 19,053 | 19,144 |
| Active Idle | 0 | 0 | |
| Target Load | Actual Load | ssj_ops | |
|---|---|---|---|
| Target | Actual | ||
| Calibration 1 | 194,273 | ||
| Calibration 2 | 197,095 | ||
| Calibration 3 | 195,774 | ||
| ssj_ops@calibrated=196,434 | |||
| 100% | 99.2% | 196,434 | 194,958 |
| 90% | 90.4% | 176,791 | 177,666 |
| 80% | 80.3% | 157,147 | 157,750 |
| 70% | 70.1% | 137,504 | 137,613 |
| 60% | 59.8% | 117,861 | 117,476 |
| 50% | 49.9% | 98,217 | 97,978 |
| 40% | 39.8% | 78,574 | 78,130 |
| 30% | 30.3% | 58,930 | 59,605 |
| 20% | 20.1% | 39,287 | 39,494 |
| 10% | 10.1% | 19,643 | 19,775 |
| Active Idle | 0 | 0 | |

| Target Load | Actual Load | ssj_ops | |
|---|---|---|---|
| Target | Actual | ||
| Calibration 1 | 189,961 | ||
| Calibration 2 | 189,940 | ||
| Calibration 3 | 187,810 | ||
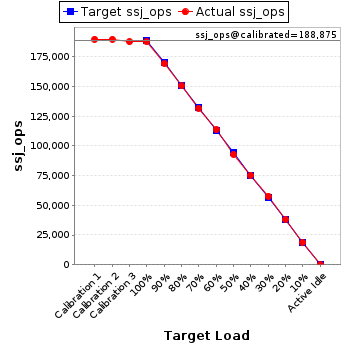
| ssj_ops@calibrated=188,875 | |||
| 100% | 99.5% | 188,875 | 187,891 |
| 90% | 89.7% | 169,987 | 169,490 |
| 80% | 79.7% | 151,100 | 150,608 |
| 70% | 69.8% | 132,212 | 131,906 |
| 60% | 60.3% | 113,325 | 113,914 |
| 50% | 49.3% | 94,437 | 93,081 |
| 40% | 39.9% | 75,550 | 75,396 |
| 30% | 30.5% | 56,662 | 57,660 |
| 20% | 20.2% | 37,775 | 38,192 |
| 10% | 10.0% | 18,887 | 18,846 |
| Active Idle | 0 | 0 | |
| Target Load | Actual Load | ssj_ops | |
|---|---|---|---|
| Target | Actual | ||
| Calibration 1 | 189,624 | ||
| Calibration 2 | 188,039 | ||
| Calibration 3 | 189,257 | ||
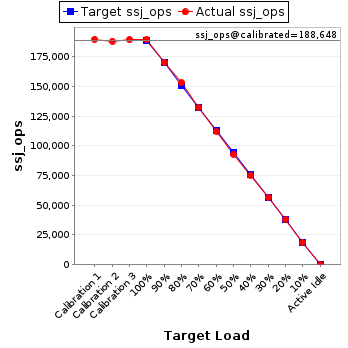
| ssj_ops@calibrated=188,648 | |||
| 100% | 100.4% | 188,648 | 189,431 |
| 90% | 90.2% | 169,783 | 170,131 |
| 80% | 81.1% | 150,918 | 152,998 |
| 70% | 70.1% | 132,054 | 132,325 |
| 60% | 59.5% | 113,189 | 112,168 |
| 50% | 49.3% | 94,324 | 93,050 |
| 40% | 39.9% | 75,459 | 75,257 |
| 30% | 29.9% | 56,594 | 56,456 |
| 20% | 20.1% | 37,730 | 37,895 |
| 10% | 9.9% | 18,865 | 18,642 |
| Active Idle | 0 | 0 | |
| Target Load | Actual Load | ssj_ops | |
|---|---|---|---|
| Target | Actual | ||
| Calibration 1 | 196,822 | ||
| Calibration 2 | 192,111 | ||
| Calibration 3 | 198,249 | ||
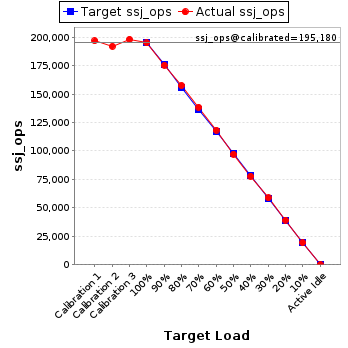
| ssj_ops@calibrated=195,180 | |||
| 100% | 99.9% | 195,180 | 194,988 |
| 90% | 89.9% | 175,662 | 175,381 |
| 80% | 80.7% | 156,144 | 157,536 |
| 70% | 70.9% | 136,626 | 138,439 |
| 60% | 60.6% | 117,108 | 118,308 |
| 50% | 49.8% | 97,590 | 97,241 |
| 40% | 39.9% | 78,072 | 77,802 |
| 30% | 30.1% | 58,554 | 58,708 |
| 20% | 20.1% | 39,036 | 39,272 |
| 10% | 9.9% | 19,518 | 19,389 |
| Active Idle | 0 | 0 | |
| Target Load | Actual Load | ssj_ops | |
|---|---|---|---|
| Target | Actual | ||
| Calibration 1 | 193,011 | ||
| Calibration 2 | 195,745 | ||
| Calibration 3 | 190,540 | ||
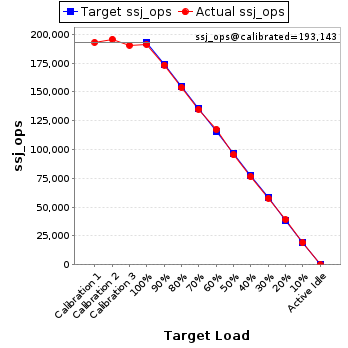
| ssj_ops@calibrated=193,143 | |||
| 100% | 99.0% | 193,143 | 191,165 |
| 90% | 89.7% | 173,828 | 173,316 |
| 80% | 79.6% | 154,514 | 153,822 |
| 70% | 69.8% | 135,200 | 134,861 |
| 60% | 60.8% | 115,886 | 117,513 |
| 50% | 49.3% | 96,571 | 95,314 |
| 40% | 39.5% | 77,257 | 76,380 |
| 30% | 29.9% | 57,943 | 57,688 |
| 20% | 20.3% | 38,629 | 39,202 |
| 10% | 10.0% | 19,314 | 19,244 |
| Active Idle | 0 | 0 | |
| Target Load | Actual Load | ssj_ops | |
|---|---|---|---|
| Target | Actual | ||
| Calibration 1 | 188,840 | ||
| Calibration 2 | 190,750 | ||
| Calibration 3 | 190,031 | ||
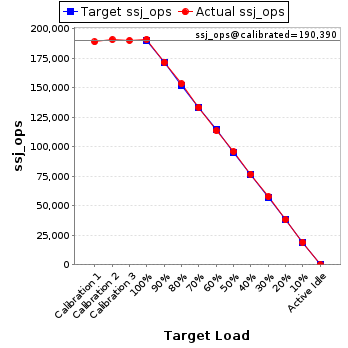
| ssj_ops@calibrated=190,390 | |||
| 100% | 100.4% | 190,390 | 191,117 |
| 90% | 90.1% | 171,351 | 171,557 |
| 80% | 80.6% | 152,312 | 153,398 |
| 70% | 70.0% | 133,273 | 133,331 |
| 60% | 59.6% | 114,234 | 113,516 |
| 50% | 50.3% | 95,195 | 95,788 |
| 40% | 40.3% | 76,156 | 76,729 |
| 30% | 30.3% | 57,117 | 57,602 |
| 20% | 20.0% | 38,078 | 38,055 |
| 10% | 10.0% | 19,039 | 19,089 |
| Active Idle | 0 | 0 | |
| Target Load | Actual Load | ssj_ops | |
|---|---|---|---|
| Target | Actual | ||
| Calibration 1 | 189,893 | ||
| Calibration 2 | 189,783 | ||
| Calibration 3 | 190,022 | ||
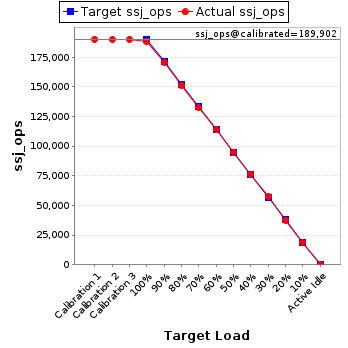
| ssj_ops@calibrated=189,902 | |||
| 100% | 99.0% | 189,902 | 187,917 |
| 90% | 89.9% | 170,912 | 170,711 |
| 80% | 79.5% | 151,922 | 150,938 |
| 70% | 69.6% | 132,932 | 132,201 |
| 60% | 59.9% | 113,941 | 113,800 |
| 50% | 50.0% | 94,951 | 94,868 |
| 40% | 40.1% | 75,961 | 76,215 |
| 30% | 30.2% | 56,971 | 57,315 |
| 20% | 19.8% | 37,980 | 37,549 |
| 10% | 10.0% | 18,990 | 18,979 |
| Active Idle | 0 | 0 | |
| Target Load | Actual Load | ssj_ops | |
|---|---|---|---|
| Target | Actual | ||
| Calibration 1 | 187,288 | ||
| Calibration 2 | 188,368 | ||
| Calibration 3 | 188,145 | ||
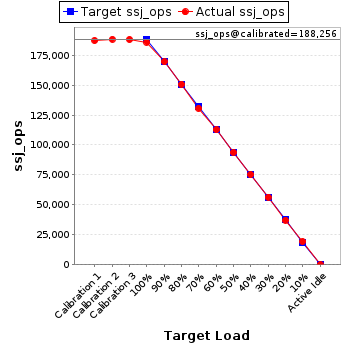
| ssj_ops@calibrated=188,256 | |||
| 100% | 98.7% | 188,256 | 185,877 |
| 90% | 90.1% | 169,431 | 169,544 |
| 80% | 80.1% | 150,605 | 150,783 |
| 70% | 69.4% | 131,779 | 130,607 |
| 60% | 59.9% | 112,954 | 112,807 |
| 50% | 49.9% | 94,128 | 93,991 |
| 40% | 40.0% | 75,303 | 75,240 |
| 30% | 30.0% | 56,477 | 56,445 |
| 20% | 19.8% | 37,651 | 37,208 |
| 10% | 10.3% | 18,826 | 19,349 |
| Active Idle | 0 | 0 | |
| Target Load | Actual Load | ssj_ops | |
|---|---|---|---|
| Target | Actual | ||
| Calibration 1 | 191,322 | ||
| Calibration 2 | 189,514 | ||
| Calibration 3 | 190,683 | ||
| ssj_ops@calibrated=190,098 | |||
| 100% | 99.6% | 190,098 | 189,268 |
| 90% | 90.7% | 171,088 | 172,458 |
| 80% | 79.9% | 152,079 | 151,796 |
| 70% | 69.6% | 133,069 | 132,267 |
| 60% | 59.6% | 114,059 | 113,256 |
| 50% | 50.1% | 95,049 | 95,316 |
| 40% | 40.0% | 76,039 | 76,107 |
| 30% | 29.9% | 57,029 | 56,875 |
| 20% | 19.9% | 38,020 | 37,765 |
| 10% | 10.3% | 19,010 | 19,648 |
| Active Idle | 0 | 0 | |

| Target Load | Actual Load | ssj_ops | |
|---|---|---|---|
| Target | Actual | ||
| Calibration 1 | 191,605 | ||
| Calibration 2 | 191,159 | ||
| Calibration 3 | 190,684 | ||
| ssj_ops@calibrated=190,921 | |||
| 100% | 99.4% | 190,921 | 189,741 |
| 90% | 89.7% | 171,829 | 171,224 |
| 80% | 80.3% | 152,737 | 153,399 |
| 70% | 70.6% | 133,645 | 134,860 |
| 60% | 59.9% | 114,553 | 114,446 |
| 50% | 50.0% | 95,461 | 95,430 |
| 40% | 40.2% | 76,369 | 76,716 |
| 30% | 29.6% | 57,276 | 56,440 |
| 20% | 20.2% | 38,184 | 38,592 |
| 10% | 10.1% | 19,092 | 19,350 |
| Active Idle | 0 | 0 | |

| Target Load | Actual Load | ssj_ops | |
|---|---|---|---|
| Target | Actual | ||
| Calibration 1 | 192,190 | ||
| Calibration 2 | 193,049 | ||
| Calibration 3 | 194,046 | ||
| ssj_ops@calibrated=193,547 | |||
| 100% | 100.0% | 193,547 | 193,597 |
| 90% | 89.2% | 174,192 | 172,682 |
| 80% | 80.8% | 154,838 | 156,411 |
| 70% | 70.3% | 135,483 | 136,152 |
| 60% | 59.6% | 116,128 | 115,262 |
| 50% | 49.5% | 96,774 | 95,861 |
| 40% | 39.9% | 77,419 | 77,246 |
| 30% | 30.3% | 58,064 | 58,651 |
| 20% | 20.3% | 38,709 | 39,243 |
| 10% | 10.0% | 19,355 | 19,442 |
| Active Idle | 0 | 0 | |

| Target Load | Actual Load | ssj_ops | |
|---|---|---|---|
| Target | Actual | ||
| Calibration 1 | 190,318 | ||
| Calibration 2 | 190,961 | ||
| Calibration 3 | 190,819 | ||
| ssj_ops@calibrated=190,890 | |||
| 100% | 99.6% | 190,890 | 190,094 |
| 90% | 89.7% | 171,801 | 171,193 |
| 80% | 80.1% | 152,712 | 152,912 |
| 70% | 70.1% | 133,623 | 133,870 |
| 60% | 59.9% | 114,534 | 114,359 |
| 50% | 50.2% | 95,445 | 95,862 |
| 40% | 40.1% | 76,356 | 76,524 |
| 30% | 30.2% | 57,267 | 57,709 |
| 20% | 19.9% | 38,178 | 38,056 |
| 10% | 9.9% | 19,089 | 18,958 |
| Active Idle | 0 | 0 | |

| Target Load | Actual Load | ssj_ops | |
|---|---|---|---|
| Target | Actual | ||
| Calibration 1 | 194,623 | ||
| Calibration 2 | 193,953 | ||
| Calibration 3 | 195,421 | ||
| ssj_ops@calibrated=194,687 | |||
| 100% | 99.5% | 194,687 | 193,726 |
| 90% | 90.1% | 175,218 | 175,339 |
| 80% | 79.8% | 155,750 | 155,369 |
| 70% | 70.3% | 136,281 | 136,805 |
| 60% | 60.3% | 116,812 | 117,415 |
| 50% | 49.6% | 97,343 | 96,472 |
| 40% | 39.7% | 77,875 | 77,232 |
| 30% | 30.3% | 58,406 | 58,985 |
| 20% | 19.9% | 38,937 | 38,709 |
| 10% | 10.1% | 19,469 | 19,638 |
| Active Idle | 0 | 0 | |

| Target Load | Actual Load | ssj_ops | |
|---|---|---|---|
| Target | Actual | ||
| Calibration 1 | 191,775 | ||
| Calibration 2 | 191,980 | ||
| Calibration 3 | 192,241 | ||
| ssj_ops@calibrated=192,111 | |||
| 100% | 99.4% | 192,111 | 190,973 |
| 90% | 90.4% | 172,900 | 173,696 |
| 80% | 80.4% | 153,689 | 154,384 |
| 70% | 70.2% | 134,477 | 134,770 |
| 60% | 59.9% | 115,266 | 115,161 |
| 50% | 49.7% | 96,055 | 95,461 |
| 40% | 40.1% | 76,844 | 76,992 |
| 30% | 30.0% | 57,633 | 57,563 |
| 20% | 19.9% | 38,422 | 38,301 |
| 10% | 10.1% | 19,211 | 19,367 |
| Active Idle | 0 | 0 | |

| Target Load | Actual Load | ssj_ops | |
|---|---|---|---|
| Target | Actual | ||
| Calibration 1 | 195,287 | ||
| Calibration 2 | 193,086 | ||
| Calibration 3 | 192,814 | ||
| ssj_ops@calibrated=192,950 | |||
| 100% | 99.9% | 192,950 | 192,767 |
| 90% | 90.1% | 173,655 | 173,819 |
| 80% | 80.2% | 154,360 | 154,735 |
| 70% | 70.5% | 135,065 | 136,061 |
| 60% | 59.9% | 115,770 | 115,519 |
| 50% | 49.6% | 96,475 | 95,727 |
| 40% | 39.3% | 77,180 | 75,801 |
| 30% | 30.0% | 57,885 | 57,901 |
| 20% | 20.1% | 38,590 | 38,689 |
| 10% | 10.0% | 19,295 | 19,255 |
| Active Idle | 0 | 0 | |

| Target Load | Actual Load | ssj_ops | |
|---|---|---|---|
| Target | Actual | ||
| Calibration 1 | 190,578 | ||
| Calibration 2 | 191,377 | ||
| Calibration 3 | 192,676 | ||
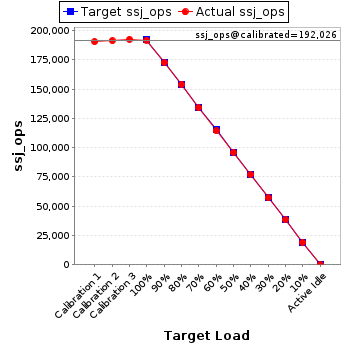
| ssj_ops@calibrated=192,026 | |||
| 100% | 99.9% | 192,026 | 191,880 |
| 90% | 89.9% | 172,824 | 172,691 |
| 80% | 80.2% | 153,621 | 154,100 |
| 70% | 69.8% | 134,419 | 134,100 |
| 60% | 59.5% | 115,216 | 114,312 |
| 50% | 50.0% | 96,013 | 95,937 |
| 40% | 40.1% | 76,811 | 77,047 |
| 30% | 29.8% | 57,608 | 57,129 |
| 20% | 19.9% | 38,405 | 38,246 |
| 10% | 9.9% | 19,203 | 19,090 |
| Active Idle | 0 | 0 | |
| Target Load | Actual Load | ssj_ops | |
|---|---|---|---|
| Target | Actual | ||
| Calibration 1 | 187,924 | ||
| Calibration 2 | 187,656 | ||
| Calibration 3 | 187,559 | ||
| ssj_ops@calibrated=187,608 | |||
| 100% | 99.6% | 187,608 | 186,831 |
| 90% | 90.3% | 168,847 | 169,378 |
| 80% | 80.7% | 150,086 | 151,486 |
| 70% | 69.5% | 131,325 | 130,304 |
| 60% | 60.6% | 112,565 | 113,775 |
| 50% | 49.9% | 93,804 | 93,669 |
| 40% | 40.3% | 75,043 | 75,590 |
| 30% | 30.2% | 56,282 | 56,651 |
| 20% | 20.2% | 37,522 | 37,906 |
| 10% | 10.0% | 18,761 | 18,796 |
| Active Idle | 0 | 0 | |

| Target Load | Actual Load | ssj_ops | |
|---|---|---|---|
| Target | Actual | ||
| Calibration 1 | 196,509 | ||
| Calibration 2 | 195,762 | ||
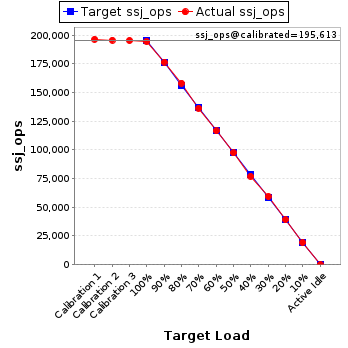
| Calibration 3 | 195,464 | ||
| ssj_ops@calibrated=195,613 | |||
| 100% | 99.4% | 195,613 | 194,484 |
| 90% | 90.3% | 176,051 | 176,668 |
| 80% | 80.9% | 156,490 | 158,319 |
| 70% | 69.7% | 136,929 | 136,439 |
| 60% | 59.6% | 117,368 | 116,601 |
| 50% | 49.8% | 97,806 | 97,410 |
| 40% | 39.4% | 78,245 | 77,011 |
| 30% | 30.4% | 58,684 | 59,442 |
| 20% | 20.0% | 39,123 | 39,188 |
| 10% | 9.9% | 19,561 | 19,413 |
| Active Idle | 0 | 0 | |
| Target Load | Actual Load | ssj_ops | |
|---|---|---|---|
| Target | Actual | ||
| Calibration 1 | 187,957 | ||
| Calibration 2 | 186,429 | ||
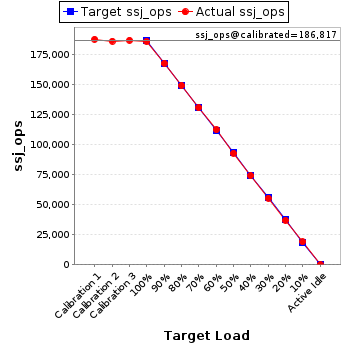
| Calibration 3 | 187,206 | ||
| ssj_ops@calibrated=186,817 | |||
| 100% | 99.6% | 186,817 | 186,113 |
| 90% | 89.9% | 168,136 | 167,875 |
| 80% | 80.0% | 149,454 | 149,391 |
| 70% | 70.1% | 130,772 | 130,884 |
| 60% | 60.3% | 112,090 | 112,601 |
| 50% | 49.8% | 93,409 | 92,985 |
| 40% | 39.7% | 74,727 | 74,104 |
| 30% | 29.7% | 56,045 | 55,543 |
| 20% | 19.8% | 37,363 | 37,008 |
| 10% | 10.1% | 18,682 | 18,950 |
| Active Idle | 0 | 0 | |
| Target Load | Actual Load | ssj_ops | |
|---|---|---|---|
| Target | Actual | ||
| Calibration 1 | 186,981 | ||
| Calibration 2 | 188,599 | ||
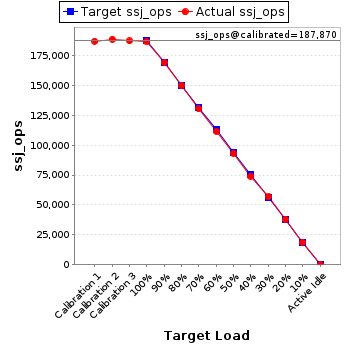
| Calibration 3 | 187,142 | ||
| ssj_ops@calibrated=187,870 | |||
| 100% | 99.3% | 187,870 | 186,620 |
| 90% | 90.0% | 169,083 | 169,042 |
| 80% | 79.7% | 150,296 | 149,673 |
| 70% | 69.4% | 131,509 | 130,447 |
| 60% | 59.4% | 112,722 | 111,571 |
| 50% | 49.7% | 93,935 | 93,281 |
| 40% | 39.4% | 75,148 | 74,054 |
| 30% | 30.2% | 56,361 | 56,734 |
| 20% | 20.2% | 37,574 | 37,985 |
| 10% | 9.9% | 18,787 | 18,577 |
| Active Idle | 0 | 0 | |
| Target Load | Actual Load | ssj_ops | |
|---|---|---|---|
| Target | Actual | ||
| Calibration 1 | 196,409 | ||
| Calibration 2 | 195,373 | ||
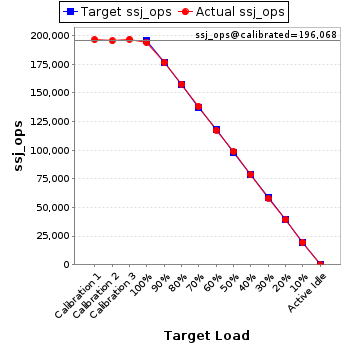
| Calibration 3 | 196,763 | ||
| ssj_ops@calibrated=196,068 | |||
| 100% | 98.8% | 196,068 | 193,780 |
| 90% | 90.1% | 176,462 | 176,569 |
| 80% | 80.4% | 156,855 | 157,681 |
| 70% | 70.4% | 137,248 | 138,119 |
| 60% | 59.9% | 117,641 | 117,438 |
| 50% | 50.4% | 98,034 | 98,869 |
| 40% | 40.1% | 78,427 | 78,669 |
| 30% | 29.6% | 58,821 | 58,118 |
| 20% | 19.9% | 39,214 | 39,053 |
| 10% | 10.0% | 19,607 | 19,591 |
| Active Idle | 0 | 0 | |
| Target Load | Actual Load | ssj_ops | |
|---|---|---|---|
| Target | Actual | ||
| Calibration 1 | 193,740 | ||
| Calibration 2 | 192,019 | ||
| Calibration 3 | 192,537 | ||
| ssj_ops@calibrated=192,278 | |||
| 100% | 99.0% | 192,278 | 190,371 |
| 90% | 89.5% | 173,050 | 172,034 |
| 80% | 80.4% | 153,823 | 154,645 |
| 70% | 70.8% | 134,595 | 136,176 |
| 60% | 60.2% | 115,367 | 115,673 |
| 50% | 50.0% | 96,139 | 96,103 |
| 40% | 40.2% | 76,911 | 77,362 |
| 30% | 30.1% | 57,683 | 57,963 |
| 20% | 20.2% | 38,456 | 38,865 |
| 10% | 10.0% | 19,228 | 19,279 |
| Active Idle | 0 | 0 | |

| Target Load | Actual Load | ssj_ops | |
|---|---|---|---|
| Target | Actual | ||
| Calibration 1 | 191,378 | ||
| Calibration 2 | 189,641 | ||
| Calibration 3 | 190,152 | ||
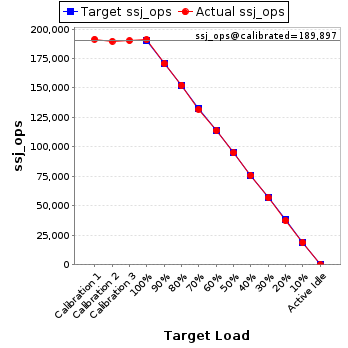
| ssj_ops@calibrated=189,897 | |||
| 100% | 100.6% | 189,897 | 191,100 |
| 90% | 89.8% | 170,907 | 170,617 |
| 80% | 80.3% | 151,917 | 152,405 |
| 70% | 69.4% | 132,928 | 131,862 |
| 60% | 59.9% | 113,938 | 113,797 |
| 50% | 50.0% | 94,948 | 94,860 |
| 40% | 39.9% | 75,959 | 75,807 |
| 30% | 29.9% | 56,969 | 56,725 |
| 20% | 19.6% | 37,979 | 37,279 |
| 10% | 9.9% | 18,990 | 18,883 |
| Active Idle | 0 | 0 | |
| Target Load | Actual Load | ssj_ops | |
|---|---|---|---|
| Target | Actual | ||
| Calibration 1 | 191,083 | ||
| Calibration 2 | 191,526 | ||
| Calibration 3 | 191,935 | ||
| ssj_ops@calibrated=191,731 | |||
| 100% | 99.4% | 191,731 | 190,676 |
| 90% | 90.1% | 172,558 | 172,789 |
| 80% | 80.5% | 153,385 | 154,359 |
| 70% | 69.9% | 134,212 | 134,000 |
| 60% | 59.9% | 115,039 | 114,792 |
| 50% | 50.2% | 95,865 | 96,165 |
| 40% | 40.6% | 76,692 | 77,827 |
| 30% | 29.6% | 57,519 | 56,817 |
| 20% | 19.7% | 38,346 | 37,803 |
| 10% | 9.9% | 19,173 | 18,964 |
| Active Idle | 0 | 0 | |

| Target Load | Actual Load | ssj_ops | |
|---|---|---|---|
| Target | Actual | ||
| Calibration 1 | 187,215 | ||
| Calibration 2 | 185,703 | ||
| Calibration 3 | 187,364 | ||
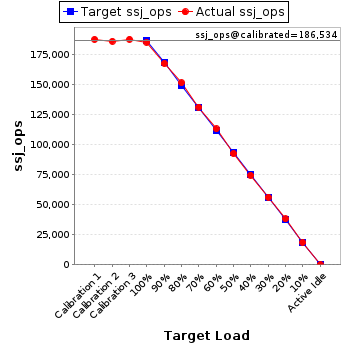
| ssj_ops@calibrated=186,534 | |||
| 100% | 99.1% | 186,534 | 184,766 |
| 90% | 89.6% | 167,880 | 167,167 |
| 80% | 81.0% | 149,227 | 151,111 |
| 70% | 70.2% | 130,574 | 130,975 |
| 60% | 60.5% | 111,920 | 112,876 |
| 50% | 49.5% | 93,267 | 92,289 |
| 40% | 39.8% | 74,613 | 74,181 |
| 30% | 30.1% | 55,960 | 56,095 |
| 20% | 20.4% | 37,307 | 38,002 |
| 10% | 10.0% | 18,653 | 18,611 |
| Active Idle | 0 | 0 | |
| Target Load | Actual Load | ssj_ops | |
|---|---|---|---|
| Target | Actual | ||
| Calibration 1 | 188,207 | ||
| Calibration 2 | 190,499 | ||
| Calibration 3 | 191,325 | ||
| ssj_ops@calibrated=190,912 | |||
| 100% | 100.2% | 190,912 | 191,368 |
| 90% | 90.4% | 171,821 | 172,590 |
| 80% | 80.4% | 152,730 | 153,555 |
| 70% | 69.7% | 133,638 | 133,092 |
| 60% | 59.9% | 114,547 | 114,369 |
| 50% | 50.1% | 95,456 | 95,649 |
| 40% | 40.0% | 76,365 | 76,362 |
| 30% | 29.7% | 57,274 | 56,651 |
| 20% | 20.1% | 38,182 | 38,373 |
| 10% | 10.2% | 19,091 | 19,533 |
| Active Idle | 0 | 0 | |

| Target Load | Actual Load | ssj_ops | |
|---|---|---|---|
| Target | Actual | ||
| Calibration 1 | 188,302 | ||
| Calibration 2 | 189,211 | ||
| Calibration 3 | 187,530 | ||
| ssj_ops@calibrated=188,371 | |||
| 100% | 100.1% | 188,371 | 188,578 |
| 90% | 89.4% | 169,534 | 168,413 |
| 80% | 81.0% | 150,697 | 152,614 |
| 70% | 70.3% | 131,860 | 132,398 |
| 60% | 60.2% | 113,022 | 113,314 |
| 50% | 49.9% | 94,185 | 93,941 |
| 40% | 40.1% | 75,348 | 75,631 |
| 30% | 30.2% | 56,511 | 56,892 |
| 20% | 20.4% | 37,674 | 38,346 |
| 10% | 10.1% | 18,837 | 18,985 |
| Active Idle | 0 | 0 | |

| Target Load | Actual Load | ssj_ops | |
|---|---|---|---|
| Target | Actual | ||
| Calibration 1 | 198,511 | ||
| Calibration 2 | 198,059 | ||
| Calibration 3 | 197,656 | ||
| ssj_ops@calibrated=197,858 | |||
| 100% | 99.5% | 197,858 | 196,875 |
| 90% | 90.4% | 178,072 | 178,908 |
| 80% | 79.7% | 158,286 | 157,714 |
| 70% | 69.7% | 138,500 | 137,969 |
| 60% | 59.7% | 118,715 | 118,216 |
| 50% | 50.1% | 98,929 | 99,079 |
| 40% | 39.9% | 79,143 | 79,011 |
| 30% | 30.0% | 59,357 | 59,336 |
| 20% | 20.2% | 39,572 | 39,897 |
| 10% | 9.8% | 19,786 | 19,367 |
| Active Idle | 0 | 0 | |

| Target Load | Actual Load | ssj_ops | |
|---|---|---|---|
| Target | Actual | ||
| Calibration 1 | 192,442 | ||
| Calibration 2 | 192,915 | ||
| Calibration 3 | 194,969 | ||
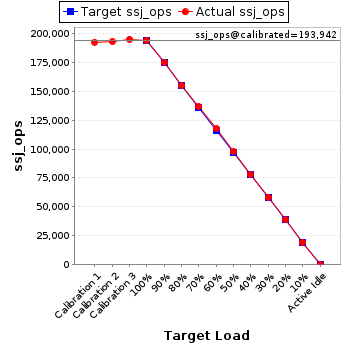
| ssj_ops@calibrated=193,942 | |||
| 100% | 100.0% | 193,942 | 193,941 |
| 90% | 90.2% | 174,548 | 175,023 |
| 80% | 79.9% | 155,154 | 154,884 |
| 70% | 70.5% | 135,759 | 136,721 |
| 60% | 60.6% | 116,365 | 117,605 |
| 50% | 50.4% | 96,971 | 97,757 |
| 40% | 40.2% | 77,577 | 77,950 |
| 30% | 30.1% | 58,183 | 58,318 |
| 20% | 20.0% | 38,788 | 38,837 |
| 10% | 10.0% | 19,394 | 19,300 |
| Active Idle | 0 | 0 | |
| Target Load | Actual Load | ssj_ops | |
|---|---|---|---|
| Target | Actual | ||
| Calibration 1 | 187,296 | ||
| Calibration 2 | 184,526 | ||
| Calibration 3 | 185,067 | ||
| ssj_ops@calibrated=184,796 | |||
| 100% | 99.4% | 184,796 | 183,661 |
| 90% | 89.6% | 166,317 | 165,511 |
| 80% | 79.7% | 147,837 | 147,315 |
| 70% | 69.5% | 129,358 | 128,415 |
| 60% | 60.4% | 110,878 | 111,604 |
| 50% | 49.6% | 92,398 | 91,734 |
| 40% | 39.5% | 73,919 | 72,945 |
| 30% | 29.6% | 55,439 | 54,618 |
| 20% | 19.8% | 36,959 | 36,569 |
| 10% | 10.2% | 18,480 | 18,798 |
| Active Idle | 0 | 0 | |

| Target Load | Actual Load | ssj_ops | |
|---|---|---|---|
| Target | Actual | ||
| Calibration 1 | 190,777 | ||
| Calibration 2 | 190,322 | ||
| Calibration 3 | 188,907 | ||
| ssj_ops@calibrated=189,615 | |||
| 100% | 99.3% | 189,615 | 188,220 |
| 90% | 89.9% | 170,653 | 170,496 |
| 80% | 79.6% | 151,692 | 150,943 |
| 70% | 70.3% | 132,730 | 133,323 |
| 60% | 59.7% | 113,769 | 113,134 |
| 50% | 49.7% | 94,807 | 94,315 |
| 40% | 39.9% | 75,846 | 75,601 |
| 30% | 29.8% | 56,884 | 56,482 |
| 20% | 19.8% | 37,923 | 37,625 |
| 10% | 10.1% | 18,961 | 19,099 |
| Active Idle | 0 | 0 | |

| Target Load | Actual Load | ssj_ops | |
|---|---|---|---|
| Target | Actual | ||
| Calibration 1 | 189,489 | ||
| Calibration 2 | 193,338 | ||
| Calibration 3 | 192,782 | ||
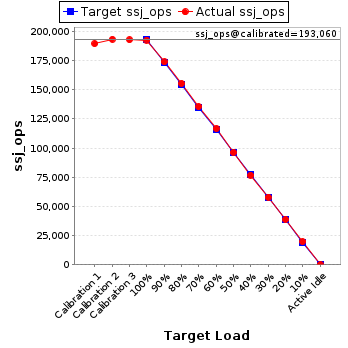
| ssj_ops@calibrated=193,060 | |||
| 100% | 99.8% | 193,060 | 192,657 |
| 90% | 90.0% | 173,754 | 173,838 |
| 80% | 80.6% | 154,448 | 155,517 |
| 70% | 70.2% | 135,142 | 135,601 |
| 60% | 60.5% | 115,836 | 116,765 |
| 50% | 49.9% | 96,530 | 96,432 |
| 40% | 39.7% | 77,224 | 76,694 |
| 30% | 30.0% | 57,918 | 57,909 |
| 20% | 20.1% | 38,612 | 38,837 |
| 10% | 10.2% | 19,306 | 19,700 |
| Active Idle | 0 | 0 | |
| Target Load | Actual Load | ssj_ops | |
|---|---|---|---|
| Target | Actual | ||
| Calibration 1 | 190,732 | ||
| Calibration 2 | 190,941 | ||
| Calibration 3 | 190,359 | ||
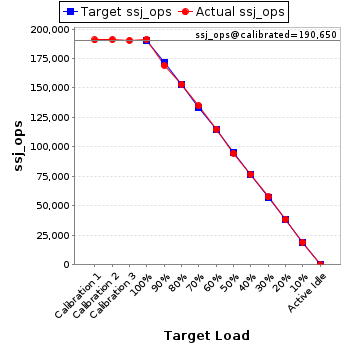
| ssj_ops@calibrated=190,650 | |||
| 100% | 100.4% | 190,650 | 191,361 |
| 90% | 88.8% | 171,585 | 169,227 |
| 80% | 80.4% | 152,520 | 153,190 |
| 70% | 70.7% | 133,455 | 134,704 |
| 60% | 60.4% | 114,390 | 115,090 |
| 50% | 49.7% | 95,325 | 94,706 |
| 40% | 40.3% | 76,260 | 76,774 |
| 30% | 30.1% | 57,195 | 57,465 |
| 20% | 20.2% | 38,130 | 38,551 |
| 10% | 10.0% | 19,065 | 19,052 |
| Active Idle | 0 | 0 | |
| Target Load | Actual Load | ssj_ops | |
|---|---|---|---|
| Target | Actual | ||
| Calibration 1 | 189,936 | ||
| Calibration 2 | 189,513 | ||
| Calibration 3 | 191,538 | ||
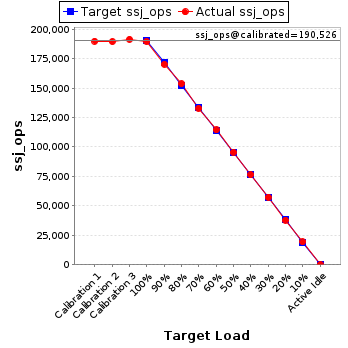
| ssj_ops@calibrated=190,526 | |||
| 100% | 99.5% | 190,526 | 189,539 |
| 90% | 89.4% | 171,473 | 170,323 |
| 80% | 80.7% | 152,421 | 153,732 |
| 70% | 69.8% | 133,368 | 132,906 |
| 60% | 60.1% | 114,315 | 114,525 |
| 50% | 50.2% | 95,263 | 95,683 |
| 40% | 40.1% | 76,210 | 76,307 |
| 30% | 30.1% | 57,158 | 57,287 |
| 20% | 19.9% | 38,105 | 37,891 |
| 10% | 10.1% | 19,053 | 19,270 |
| Active Idle | 0 | 0 | |
| Target Load | Actual Load | ssj_ops | |
|---|---|---|---|
| Target | Actual | ||
| Calibration 1 | 197,248 | ||
| Calibration 2 | 195,341 | ||
| Calibration 3 | 194,067 | ||
| ssj_ops@calibrated=194,704 | |||
| 100% | 99.6% | 194,704 | 193,996 |
| 90% | 89.6% | 175,233 | 174,519 |
| 80% | 79.5% | 155,763 | 154,816 |
| 70% | 70.1% | 136,293 | 136,463 |
| 60% | 60.7% | 116,822 | 118,229 |
| 50% | 49.8% | 97,352 | 97,051 |
| 40% | 39.9% | 77,882 | 77,753 |
| 30% | 30.2% | 58,411 | 58,879 |
| 20% | 19.9% | 38,941 | 38,799 |
| 10% | 10.0% | 19,470 | 19,482 |
| Active Idle | 0 | 0 | |

| Target Load | Actual Load | ssj_ops | |
|---|---|---|---|
| Target | Actual | ||
| Calibration 1 | 193,625 | ||
| Calibration 2 | 194,158 | ||
| Calibration 3 | 194,431 | ||
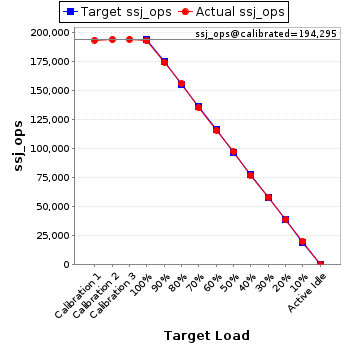
| ssj_ops@calibrated=194,295 | |||
| 100% | 99.4% | 194,295 | 193,048 |
| 90% | 90.0% | 174,865 | 174,789 |
| 80% | 80.4% | 155,436 | 156,230 |
| 70% | 69.8% | 136,006 | 135,557 |
| 60% | 59.7% | 116,577 | 116,024 |
| 50% | 50.2% | 97,147 | 97,596 |
| 40% | 39.7% | 77,718 | 77,104 |
| 30% | 29.9% | 58,288 | 58,149 |
| 20% | 20.0% | 38,859 | 38,787 |
| 10% | 10.3% | 19,429 | 20,044 |
| Active Idle | 0 | 0 | |
| Target Load | Actual Load | ssj_ops | |
|---|---|---|---|
| Target | Actual | ||
| Calibration 1 | 188,753 | ||
| Calibration 2 | 186,268 | ||
| Calibration 3 | 187,370 | ||
| ssj_ops@calibrated=186,819 | |||
| 100% | 100.5% | 186,819 | 187,666 |
| 90% | 89.1% | 168,137 | 166,464 |
| 80% | 79.5% | 149,455 | 148,468 |
| 70% | 70.0% | 130,773 | 130,747 |
| 60% | 60.8% | 112,091 | 113,522 |
| 50% | 49.7% | 93,410 | 92,857 |
| 40% | 39.9% | 74,728 | 74,607 |
| 30% | 30.4% | 56,046 | 56,874 |
| 20% | 20.1% | 37,364 | 37,517 |
| 10% | 9.8% | 18,682 | 18,377 |
| Active Idle | 0 | 0 | |

| Target Load | Actual Load | ssj_ops | |
|---|---|---|---|
| Target | Actual | ||
| Calibration 1 | 190,394 | ||
| Calibration 2 | 193,329 | ||
| Calibration 3 | 193,107 | ||
| ssj_ops@calibrated=193,218 | |||
| 100% | 99.6% | 193,218 | 192,361 |
| 90% | 90.0% | 173,897 | 173,900 |
| 80% | 80.0% | 154,575 | 154,550 |
| 70% | 69.9% | 135,253 | 135,050 |
| 60% | 60.6% | 115,931 | 117,131 |
| 50% | 50.2% | 96,609 | 97,069 |
| 40% | 40.0% | 77,287 | 77,331 |
| 30% | 30.0% | 57,966 | 57,907 |
| 20% | 20.0% | 38,644 | 38,621 |
| 10% | 10.0% | 19,322 | 19,271 |
| Active Idle | 0 | 0 | |

| Target Load | Actual Load | ssj_ops | |
|---|---|---|---|
| Target | Actual | ||
| Calibration 1 | 194,877 | ||
| Calibration 2 | 192,487 | ||
| Calibration 3 | 192,960 | ||
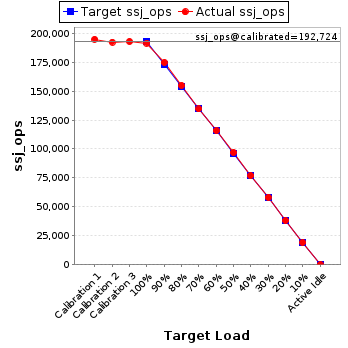
| ssj_ops@calibrated=192,724 | |||
| 100% | 99.4% | 192,724 | 191,565 |
| 90% | 90.7% | 173,451 | 174,777 |
| 80% | 80.4% | 154,179 | 155,030 |
| 70% | 69.8% | 134,906 | 134,592 |
| 60% | 60.1% | 115,634 | 115,866 |
| 50% | 50.3% | 96,362 | 96,988 |
| 40% | 39.9% | 77,089 | 76,866 |
| 30% | 30.2% | 57,817 | 58,207 |
| 20% | 19.8% | 38,545 | 38,222 |
| 10% | 10.0% | 19,272 | 19,300 |
| Active Idle | 0 | 0 | |
| Target Load | Actual Load | ssj_ops | |
|---|---|---|---|
| Target | Actual | ||
| Calibration 1 | 197,462 | ||
| Calibration 2 | 196,481 | ||
| Calibration 3 | 197,085 | ||
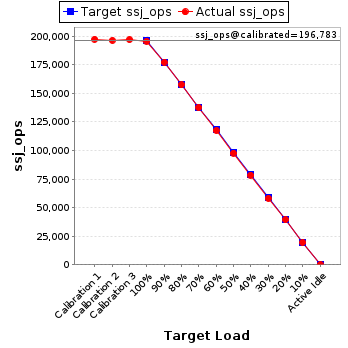
| ssj_ops@calibrated=196,783 | |||
| 100% | 99.4% | 196,783 | 195,682 |
| 90% | 90.2% | 177,105 | 177,416 |
| 80% | 80.0% | 157,427 | 157,445 |
| 70% | 69.9% | 137,748 | 137,616 |
| 60% | 59.7% | 118,070 | 117,482 |
| 50% | 49.7% | 98,392 | 97,789 |
| 40% | 39.9% | 78,713 | 78,423 |
| 30% | 29.5% | 59,035 | 58,147 |
| 20% | 20.0% | 39,357 | 39,321 |
| 10% | 10.0% | 19,678 | 19,596 |
| Active Idle | 0 | 0 | |
| Target Load | Actual Load | ssj_ops | |
|---|---|---|---|
| Target | Actual | ||
| Calibration 1 | 191,417 | ||
| Calibration 2 | 191,505 | ||
| Calibration 3 | 191,315 | ||
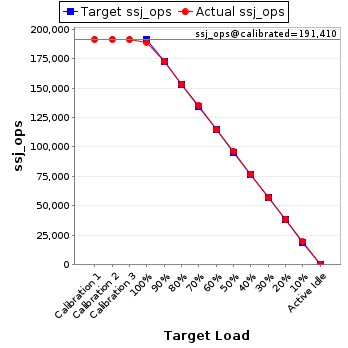
| ssj_ops@calibrated=191,410 | |||
| 100% | 98.7% | 191,410 | 188,974 |
| 90% | 90.3% | 172,269 | 172,849 |
| 80% | 79.9% | 153,128 | 153,030 |
| 70% | 70.7% | 133,987 | 135,364 |
| 60% | 59.8% | 114,846 | 114,539 |
| 50% | 50.4% | 95,705 | 96,559 |
| 40% | 40.1% | 76,564 | 76,758 |
| 30% | 29.8% | 57,423 | 57,077 |
| 20% | 20.1% | 38,282 | 38,500 |
| 10% | 10.1% | 19,141 | 19,374 |
| Active Idle | 0 | 0 | |
| Target Load | Actual Load | ssj_ops | |
|---|---|---|---|
| Target | Actual | ||
| Calibration 1 | 190,417 | ||
| Calibration 2 | 189,810 | ||
| Calibration 3 | 190,771 | ||
| ssj_ops@calibrated=190,291 | |||
| 100% | 99.5% | 190,291 | 189,247 |
| 90% | 89.9% | 171,261 | 171,046 |
| 80% | 79.6% | 152,232 | 151,442 |
| 70% | 70.5% | 133,203 | 134,201 |
| 60% | 60.1% | 114,174 | 114,317 |
| 50% | 50.1% | 95,145 | 95,405 |
| 40% | 40.1% | 76,116 | 76,337 |
| 30% | 29.7% | 57,087 | 56,449 |
| 20% | 20.2% | 38,058 | 38,515 |
| 10% | 10.2% | 19,029 | 19,328 |
| Active Idle | 0 | 0 | |

| Target Load | Actual Load | ssj_ops | |
|---|---|---|---|
| Target | Actual | ||
| Calibration 1 | 190,558 | ||
| Calibration 2 | 191,326 | ||
| Calibration 3 | 190,933 | ||
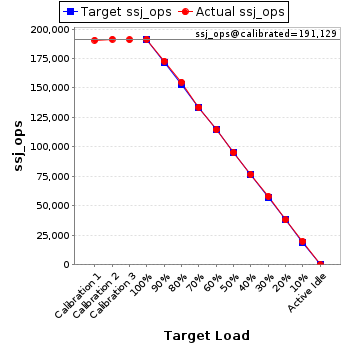
| ssj_ops@calibrated=191,129 | |||
| 100% | 100.1% | 191,129 | 191,342 |
| 90% | 90.4% | 172,017 | 172,792 |
| 80% | 81.1% | 152,904 | 155,026 |
| 70% | 69.9% | 133,791 | 133,609 |
| 60% | 59.9% | 114,678 | 114,521 |
| 50% | 49.9% | 95,565 | 95,352 |
| 40% | 40.1% | 76,452 | 76,626 |
| 30% | 30.4% | 57,339 | 58,043 |
| 20% | 19.9% | 38,226 | 37,971 |
| 10% | 10.4% | 19,113 | 19,872 |
| Active Idle | 0 | 0 | |
| Target Load | Actual Load | ssj_ops | |
|---|---|---|---|
| Target | Actual | ||
| Calibration 1 | 197,665 | ||
| Calibration 2 | 195,018 | ||
| Calibration 3 | 196,862 | ||
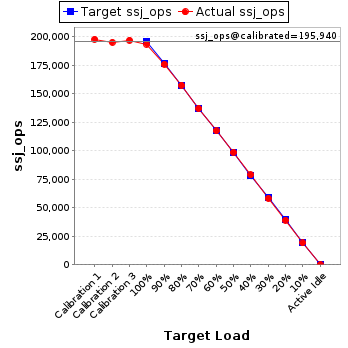
| ssj_ops@calibrated=195,940 | |||
| 100% | 98.7% | 195,940 | 193,419 |
| 90% | 89.7% | 176,346 | 175,727 |
| 80% | 80.3% | 156,752 | 157,388 |
| 70% | 69.9% | 137,158 | 137,003 |
| 60% | 59.9% | 117,564 | 117,319 |
| 50% | 50.4% | 97,970 | 98,663 |
| 40% | 40.2% | 78,376 | 78,710 |
| 30% | 29.7% | 58,782 | 58,179 |
| 20% | 19.9% | 39,188 | 39,056 |
| 10% | 9.7% | 19,594 | 19,067 |
| Active Idle | 0 | 0 | |
| Target Load | Actual Load | ssj_ops | |
|---|---|---|---|
| Target | Actual | ||
| Calibration 1 | 188,181 | ||
| Calibration 2 | 191,016 | ||
| Calibration 3 | 188,258 | ||
| ssj_ops@calibrated=189,637 | |||
| 100% | 99.9% | 189,637 | 189,401 |
| 90% | 89.8% | 170,673 | 170,376 |
| 80% | 79.6% | 151,710 | 151,026 |
| 70% | 70.1% | 132,746 | 132,868 |
| 60% | 60.2% | 113,782 | 114,172 |
| 50% | 49.9% | 94,819 | 94,672 |
| 40% | 40.1% | 75,855 | 76,092 |
| 30% | 30.2% | 56,891 | 57,193 |
| 20% | 19.9% | 37,927 | 37,720 |
| 10% | 10.2% | 18,964 | 19,319 |
| Active Idle | 0 | 0 | |

| Target Load | Actual Load | ssj_ops | |
|---|---|---|---|
| Target | Actual | ||
| Calibration 1 | 188,966 | ||
| Calibration 2 | 185,713 | ||
| Calibration 3 | 188,034 | ||
| ssj_ops@calibrated=186,874 | |||
| 100% | 99.6% | 186,874 | 186,084 |
| 90% | 90.5% | 168,186 | 169,160 |
| 80% | 81.1% | 149,499 | 151,497 |
| 70% | 70.6% | 130,811 | 131,932 |
| 60% | 60.0% | 112,124 | 112,161 |
| 50% | 49.9% | 93,437 | 93,242 |
| 40% | 40.1% | 74,749 | 74,969 |
| 30% | 29.9% | 56,062 | 55,945 |
| 20% | 20.2% | 37,375 | 37,692 |
| 10% | 9.8% | 18,687 | 18,337 |
| Active Idle | 0 | 0 | |

| Target Load | Actual Load | ssj_ops | |
|---|---|---|---|
| Target | Actual | ||
| Calibration 1 | 188,022 | ||
| Calibration 2 | 191,964 | ||
| Calibration 3 | 190,916 | ||
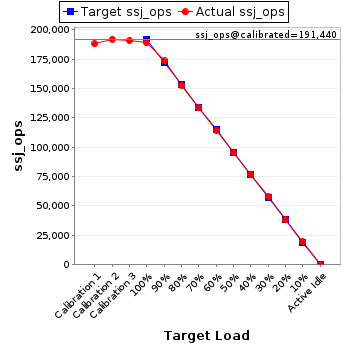
| ssj_ops@calibrated=191,440 | |||
| 100% | 98.7% | 191,440 | 188,967 |
| 90% | 90.6% | 172,296 | 173,471 |
| 80% | 79.9% | 153,152 | 152,910 |
| 70% | 69.8% | 134,008 | 133,537 |
| 60% | 59.9% | 114,864 | 114,659 |
| 50% | 49.9% | 95,720 | 95,563 |
| 40% | 40.1% | 76,576 | 76,829 |
| 30% | 30.2% | 57,432 | 57,902 |
| 20% | 20.0% | 38,288 | 38,270 |
| 10% | 10.1% | 19,144 | 19,375 |
| Active Idle | 0 | 0 | |
| Target Load | Actual Load | ssj_ops | |
|---|---|---|---|
| Target | Actual | ||
| Calibration 1 | 191,469 | ||
| Calibration 2 | 191,097 | ||
| Calibration 3 | 192,367 | ||
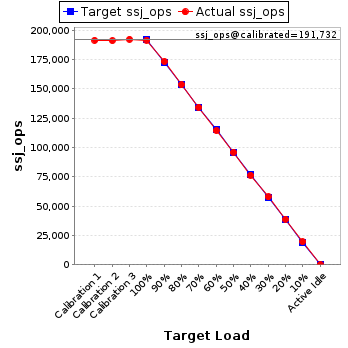
| ssj_ops@calibrated=191,732 | |||
| 100% | 99.9% | 191,732 | 191,597 |
| 90% | 90.4% | 172,559 | 173,386 |
| 80% | 80.1% | 153,386 | 153,486 |
| 70% | 70.0% | 134,212 | 134,262 |
| 60% | 59.7% | 115,039 | 114,404 |
| 50% | 50.1% | 95,866 | 96,089 |
| 40% | 39.8% | 76,693 | 76,286 |
| 30% | 30.1% | 57,520 | 57,757 |
| 20% | 20.3% | 38,346 | 38,861 |
| 10% | 10.2% | 19,173 | 19,501 |
| Active Idle | 0 | 0 | |
| Target Load | Actual Load | ssj_ops | |
|---|---|---|---|
| Target | Actual | ||
| Calibration 1 | 191,568 | ||
| Calibration 2 | 189,861 | ||
| Calibration 3 | 188,815 | ||
| ssj_ops@calibrated=189,338 | |||
| 100% | 100.0% | 189,338 | 189,281 |
| 90% | 89.8% | 170,404 | 169,965 |
| 80% | 79.6% | 151,470 | 150,734 |
| 70% | 71.0% | 132,536 | 134,370 |
| 60% | 60.1% | 113,603 | 113,833 |
| 50% | 49.8% | 94,669 | 94,244 |
| 40% | 40.2% | 75,735 | 76,126 |
| 30% | 29.8% | 56,801 | 56,454 |
| 20% | 19.8% | 37,868 | 37,479 |
| 10% | 9.8% | 18,934 | 18,609 |
| Active Idle | 0 | 0 | |

| Target Load | Actual Load | ssj_ops | |
|---|---|---|---|
| Target | Actual | ||
| Calibration 1 | 192,965 | ||
| Calibration 2 | 193,170 | ||
| Calibration 3 | 193,165 | ||
| ssj_ops@calibrated=193,168 | |||
| 100% | 99.4% | 193,168 | 192,077 |
| 90% | 89.4% | 173,851 | 172,767 |
| 80% | 80.2% | 154,534 | 154,887 |
| 70% | 70.0% | 135,217 | 135,259 |
| 60% | 60.3% | 115,901 | 116,536 |
| 50% | 50.3% | 96,584 | 97,133 |
| 40% | 40.4% | 77,267 | 78,028 |
| 30% | 29.7% | 57,950 | 57,432 |
| 20% | 20.2% | 38,634 | 39,062 |
| 10% | 9.9% | 19,317 | 19,219 |
| Active Idle | 0 | 0 | |

| Target Load | Actual Load | ssj_ops | |
|---|---|---|---|
| Target | Actual | ||
| Calibration 1 | 193,240 | ||
| Calibration 2 | 193,338 | ||
| Calibration 3 | 194,172 | ||
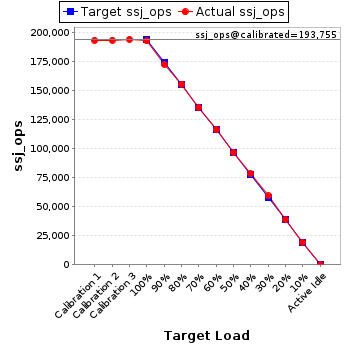
| ssj_ops@calibrated=193,755 | |||
| 100% | 99.5% | 193,755 | 192,770 |
| 90% | 89.1% | 174,379 | 172,661 |
| 80% | 80.3% | 155,004 | 155,605 |
| 70% | 69.8% | 135,628 | 135,301 |
| 60% | 60.1% | 116,253 | 116,422 |
| 50% | 49.9% | 96,877 | 96,653 |
| 40% | 40.3% | 77,502 | 78,140 |
| 30% | 30.5% | 58,126 | 59,182 |
| 20% | 20.0% | 38,751 | 38,688 |
| 10% | 9.9% | 19,375 | 19,242 |
| Active Idle | 0 | 0 | |
| Target Load | Actual Load | ssj_ops | |
|---|---|---|---|
| Target | Actual | ||
| Calibration 1 | 194,099 | ||
| Calibration 2 | 194,738 | ||
| Calibration 3 | 193,939 | ||
| ssj_ops@calibrated=194,338 | |||
| 100% | 98.9% | 194,338 | 192,110 |
| 90% | 89.9% | 174,904 | 174,625 |
| 80% | 80.7% | 155,471 | 156,747 |
| 70% | 70.2% | 136,037 | 136,459 |
| 60% | 60.1% | 116,603 | 116,759 |
| 50% | 49.6% | 97,169 | 96,480 |
| 40% | 39.8% | 77,735 | 77,401 |
| 30% | 30.2% | 58,301 | 58,650 |
| 20% | 19.9% | 38,868 | 38,732 |
| 10% | 10.0% | 19,434 | 19,342 |
| Active Idle | 0 | 0 | |

| Target Load | Actual Load | ssj_ops | |
|---|---|---|---|
| Target | Actual | ||
| Calibration 1 | 192,059 | ||
| Calibration 2 | 191,877 | ||
| Calibration 3 | 192,207 | ||
| ssj_ops@calibrated=192,042 | |||
| 100% | 100.1% | 192,042 | 192,292 |
| 90% | 90.1% | 172,837 | 173,078 |
| 80% | 79.2% | 153,633 | 152,118 |
| 70% | 69.5% | 134,429 | 133,554 |
| 60% | 60.2% | 115,225 | 115,589 |
| 50% | 49.8% | 96,021 | 95,626 |
| 40% | 40.3% | 76,817 | 77,361 |
| 30% | 29.9% | 57,612 | 57,479 |
| 20% | 20.0% | 38,408 | 38,476 |
| 10% | 10.0% | 19,204 | 19,184 |
| Active Idle | 0 | 0 | |

| Target Load | Actual Load | ssj_ops | |
|---|---|---|---|
| Target | Actual | ||
| Calibration 1 | 182,850 | ||
| Calibration 2 | 182,116 | ||
| Calibration 3 | 181,329 | ||
| ssj_ops@calibrated=181,723 | |||
| 100% | 99.6% | 181,723 | 181,003 |
| 90% | 91.3% | 163,550 | 165,974 |
| 80% | 79.7% | 145,378 | 144,818 |
| 70% | 69.9% | 127,206 | 127,029 |
| 60% | 59.7% | 109,034 | 108,559 |
| 50% | 50.1% | 90,861 | 91,077 |
| 40% | 39.7% | 72,689 | 72,063 |
| 30% | 29.8% | 54,517 | 54,129 |
| 20% | 19.9% | 36,345 | 36,101 |
| 10% | 10.2% | 18,172 | 18,510 |
| Active Idle | 0 | 0 | |

| Target Load | Actual Load | ssj_ops | |
|---|---|---|---|
| Target | Actual | ||
| Calibration 1 | 197,418 | ||
| Calibration 2 | 196,884 | ||
| Calibration 3 | 198,251 | ||
| ssj_ops@calibrated=197,567 | |||
| 100% | 99.9% | 197,567 | 197,361 |
| 90% | 89.8% | 177,811 | 177,363 |
| 80% | 80.3% | 158,054 | 158,613 |
| 70% | 70.8% | 138,297 | 139,910 |
| 60% | 60.2% | 118,540 | 118,913 |
| 50% | 50.4% | 98,784 | 99,527 |
| 40% | 40.0% | 79,027 | 78,955 |
| 30% | 30.0% | 59,270 | 59,204 |
| 20% | 19.9% | 39,513 | 39,304 |
| 10% | 9.9% | 19,757 | 19,476 |
| Active Idle | 0 | 0 | |

| Target Load | Actual Load | ssj_ops | |
|---|---|---|---|
| Target | Actual | ||
| Calibration 1 | 187,537 | ||
| Calibration 2 | 186,178 | ||
| Calibration 3 | 188,001 | ||
| ssj_ops@calibrated=187,089 | |||
| 100% | 100.4% | 187,089 | 187,773 |
| 90% | 90.4% | 168,381 | 169,144 |
| 80% | 79.6% | 149,672 | 148,977 |
| 70% | 69.6% | 130,963 | 130,229 |
| 60% | 59.7% | 112,254 | 111,611 |
| 50% | 49.9% | 93,545 | 93,408 |
| 40% | 40.2% | 74,836 | 75,166 |
| 30% | 30.1% | 56,127 | 56,287 |
| 20% | 19.7% | 37,418 | 36,896 |
| 10% | 9.8% | 18,709 | 18,248 |
| Active Idle | 0 | 0 | |

| Target Load | Actual Load | ssj_ops | |
|---|---|---|---|
| Target | Actual | ||
| Calibration 1 | 195,005 | ||
| Calibration 2 | 194,548 | ||
| Calibration 3 | 192,604 | ||
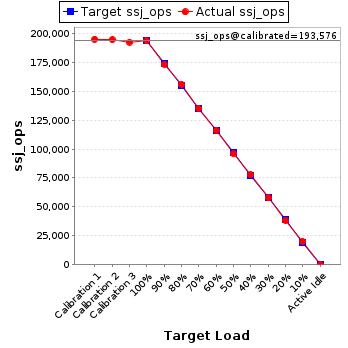
| ssj_ops@calibrated=193,576 | |||
| 100% | 100.0% | 193,576 | 193,550 |
| 90% | 89.6% | 174,218 | 173,486 |
| 80% | 80.6% | 154,861 | 156,049 |
| 70% | 69.8% | 135,503 | 135,058 |
| 60% | 60.0% | 116,146 | 116,076 |
| 50% | 49.5% | 96,788 | 95,880 |
| 40% | 40.2% | 77,430 | 77,733 |
| 30% | 29.8% | 58,073 | 57,724 |
| 20% | 19.8% | 38,715 | 38,239 |
| 10% | 10.2% | 19,358 | 19,800 |
| Active Idle | 0 | 0 | |
| Target Load | Actual Load | ssj_ops | |
|---|---|---|---|
| Target | Actual | ||
| Calibration 1 | 188,194 | ||
| Calibration 2 | 188,440 | ||
| Calibration 3 | 188,755 | ||
| ssj_ops@calibrated=188,597 | |||
| 100% | 99.7% | 188,597 | 188,110 |
| 90% | 90.0% | 169,738 | 169,821 |
| 80% | 79.8% | 150,878 | 150,591 |
| 70% | 69.4% | 132,018 | 130,794 |
| 60% | 59.9% | 113,158 | 112,977 |
| 50% | 49.9% | 94,299 | 94,100 |
| 40% | 40.2% | 75,439 | 75,763 |
| 30% | 29.9% | 56,579 | 56,411 |
| 20% | 19.7% | 37,719 | 37,118 |
| 10% | 9.8% | 18,860 | 18,390 |
| Active Idle | 0 | 0 | |

| Target Load | Actual Load | ssj_ops | |
|---|---|---|---|
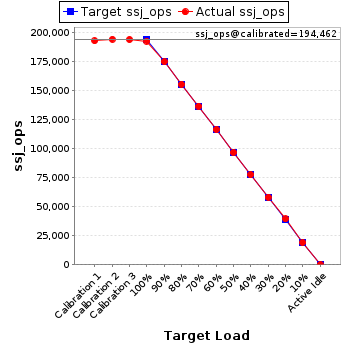
| Target | Actual | ||
| Calibration 1 | 193,198 | ||
| Calibration 2 | 194,607 | ||
| Calibration 3 | 194,317 | ||
| ssj_ops@calibrated=194,462 | |||
| 100% | 99.2% | 194,462 | 192,960 |
| 90% | 90.1% | 175,016 | 175,185 |
| 80% | 80.1% | 155,570 | 155,708 |
| 70% | 70.4% | 136,123 | 136,807 |
| 60% | 60.0% | 116,677 | 116,717 |
| 50% | 49.9% | 97,231 | 97,010 |
| 40% | 39.9% | 77,785 | 77,616 |
| 30% | 30.0% | 58,339 | 58,280 |
| 20% | 20.3% | 38,892 | 39,448 |
| 10% | 9.9% | 19,446 | 19,188 |
| Active Idle | 0 | 0 | |
| Target Load | Actual Load | ssj_ops | |
|---|---|---|---|
| Target | Actual | ||
| Calibration 1 | 190,596 | ||
| Calibration 2 | 190,321 | ||
| Calibration 3 | 192,332 | ||
| ssj_ops@calibrated=191,326 | |||
| 100% | 99.4% | 191,326 | 190,113 |
| 90% | 89.7% | 172,194 | 171,567 |
| 80% | 80.1% | 153,061 | 153,201 |
| 70% | 69.5% | 133,928 | 133,065 |
| 60% | 60.0% | 114,796 | 114,708 |
| 50% | 49.8% | 95,663 | 95,221 |
| 40% | 40.1% | 76,531 | 76,657 |
| 30% | 29.6% | 57,398 | 56,663 |
| 20% | 20.2% | 38,265 | 38,587 |
| 10% | 10.1% | 19,133 | 19,304 |
| Active Idle | 0 | 0 | |
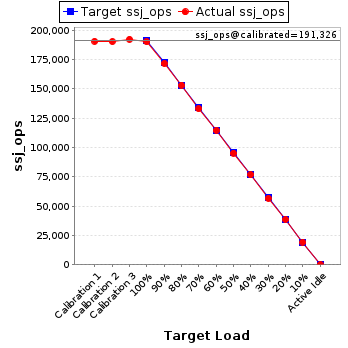
| Target Load | Actual Load | ssj_ops | |
|---|---|---|---|
| Target | Actual | ||
| Calibration 1 | 190,784 | ||
| Calibration 2 | 188,880 | ||
| Calibration 3 | 189,413 | ||
| ssj_ops@calibrated=189,146 | |||
| 100% | 99.9% | 189,146 | 188,969 |
| 90% | 89.2% | 170,232 | 168,643 |
| 80% | 79.9% | 151,317 | 151,153 |
| 70% | 70.5% | 132,403 | 133,267 |
| 60% | 60.3% | 113,488 | 114,042 |
| 50% | 50.0% | 94,573 | 94,620 |
| 40% | 39.1% | 75,659 | 73,998 |
| 30% | 29.5% | 56,744 | 55,826 |
| 20% | 19.8% | 37,829 | 37,508 |
| 10% | 10.0% | 18,915 | 18,940 |
| Active Idle | 0 | 0 | |
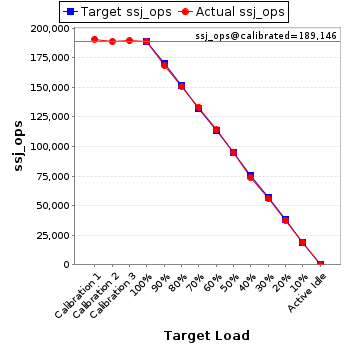
| Target Load | Actual Load | ssj_ops | |
|---|---|---|---|
| Target | Actual | ||
| Calibration 1 | 195,049 | ||
| Calibration 2 | 194,906 | ||
| Calibration 3 | 193,848 | ||
| ssj_ops@calibrated=194,377 | |||
| 100% | 100.2% | 194,377 | 194,756 |
| 90% | 90.0% | 174,940 | 175,016 |
| 80% | 79.9% | 155,502 | 155,379 |
| 70% | 70.8% | 136,064 | 137,592 |
| 60% | 60.1% | 116,626 | 116,746 |
| 50% | 50.0% | 97,189 | 97,195 |
| 40% | 39.7% | 77,751 | 77,175 |
| 30% | 29.6% | 58,313 | 57,559 |
| 20% | 19.8% | 38,875 | 38,423 |
| 10% | 9.9% | 19,438 | 19,332 |
| Active Idle | 0 | 0 | |
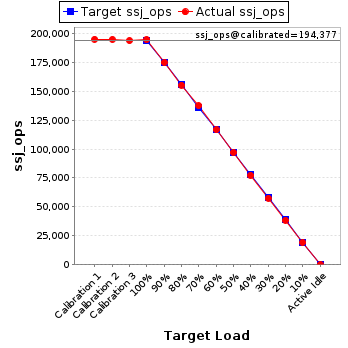
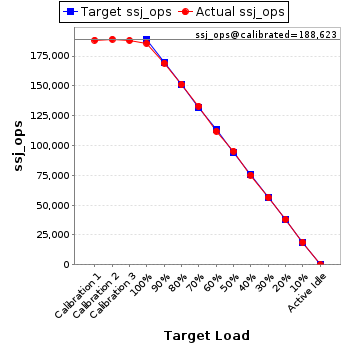
| Target Load | Actual Load | ssj_ops | |
|---|---|---|---|
| Target | Actual | ||
| Calibration 1 | 188,374 | ||
| Calibration 2 | 189,082 | ||
| Calibration 3 | 188,164 | ||
| ssj_ops@calibrated=188,623 | |||
| 100% | 98.4% | 188,623 | 185,555 |
| 90% | 89.6% | 169,760 | 169,035 |
| 80% | 80.1% | 150,898 | 151,143 |
| 70% | 70.5% | 132,036 | 132,967 |
| 60% | 59.3% | 113,174 | 111,938 |
| 50% | 50.5% | 94,311 | 95,233 |
| 40% | 39.8% | 75,449 | 75,130 |
| 30% | 29.9% | 56,587 | 56,427 |
| 20% | 20.2% | 37,725 | 38,012 |
| 10% | 10.0% | 18,862 | 18,919 |
| Active Idle | 0 | 0 | |