SPECpower_ssj2008
Host 'localhost' Performance Report
Copyright © 2007-2022 Standard Performance Evaluation Corporation
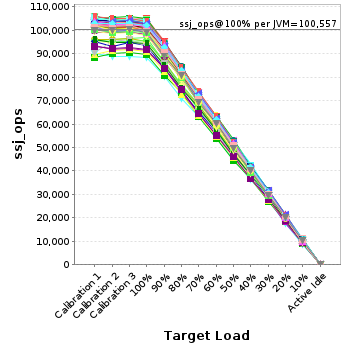
| Nettrix R620 G40 | ssj_ops@100% = 7,642,314 ssj_ops@100% per JVM = 100,557 |
||||
| Test Sponsor: | Nettrix | SPEC License #: | 6138 | Test Method: | Single Node |
| Tested By: | Nettrix | Test Location: | Beijing,China | Test Date: | Jun 17, 2022 |
| Hardware Availability: | Jun-2022 | Software Availability: | Jun-2022 | Publication: | Jul 12, 2022 |
| System Source: | Single Supplier | System Designation: | Server | Power Provisioning: | Line-powered |
| Target Load | Actual Load | ssj_ops | |
|---|---|---|---|
| Target | Actual | ||
| Calibration 1 | 7,731,452 | ||
| Calibration 2 | 7,675,324 | ||
| Calibration 3 | 7,700,505 | ||
| ssj_ops@calibrated=7,687,914 | |||
| 100% | 99.4% | 7,687,914 | 7,642,314 |
| 90% | 89.9% | 6,919,123 | 6,913,015 |
| 80% | 79.9% | 6,150,332 | 6,146,167 |
| 70% | 70.0% | 5,381,540 | 5,382,925 |
| 60% | 60.0% | 4,612,749 | 4,609,580 |
| 50% | 49.9% | 3,843,957 | 3,839,672 |
| 40% | 39.9% | 3,075,166 | 3,069,711 |
| 30% | 30.0% | 2,306,374 | 2,305,109 |
| 20% | 20.0% | 1,537,583 | 1,536,179 |
| 10% | 10.0% | 768,791 | 769,502 |
| Active Idle | 0 | 0 | |

| Set Identifier: | sut |
| Set Description: | System Under Test |
| # of Identical Nodes: | 1 |
| Comment: | None |
| Hardware | |
|---|---|
| Hardware Vendor: | Nettrix |
| Model: | R620 G40 |
| Form Factor: | 2U |
| CPU Name: | Intel Xeon Platinum 8368Q |
| CPU Characteristics: | 38-Core,2.60GHz,57MB L3 Cache |
| CPU Frequency (MHz): | 2600 |
| CPU(s) Enabled: | 76 cores, 2 chips, 38 cores/chip |
| Hardware Threads: | 152 (2 / core) |
| CPU(s) Orderable: | 1,2 chips |
| Primary Cache: | 32 KB I + 48 KB D on chip per core |
| Secondary Cache: | 1280 KB I+D on chip per chip |
| Tertiary Cache: | 57 MB I+D on chip per chip |
| Other Cache: | None |
| Memory Amount (GB): | 256 |
| # and size of DIMM: | 16 x 16 GB |
| Memory Details: | 16 x 16GB 2Rx8 PC4-3200Y-R; slots 0, 2, 4, 6, 8, 10, 12, 14, 16, 18, 20, 22, 24, 26, 28 and 30 populated |
| Power Supply Quantity and Rating (W): | 1 x 800 |
| Power Supply Details: | ACBEL CRPS800B2 800W |
| Disk Drive: | 1 x 512GB SATA SSD; P/N SDASB8Y-512G |
| Disk Controller: | Integrated SATA controller |
| # and type of Network Interface Cards (NICs) Installed: | 1 x 10000BASE-T OCP with 2x RJ45 ports; P/N BCM957416N4160C |
| NICs Enabled in Firmware / OS / Connected: | 2/2/1 |
| Network Speed (Mbit): | 1000 |
| Keyboard: | None |
| Mouse: | None |
| Monitor: | None |
| Optical Drives: | No |
| Other Hardware: | None |
| Software | |
|---|---|
| Power Management: | tuned-adm profile powersave |
| Operating System (OS): | Suse Linux Enterprise Server 15 SP3 |
| OS Version: | 5.3.18-57-default |
| Filesystem: | btrfs |
| JVM Vendor: | Oracle Corporation |
| JVM Version: | Java HotSpot(TM) 64-Bit Server VM 18.9 (build 11.0.11+9-LTS-194, mixed mode) |
| JVM Command-line Options: | -server -Xms1995m -Xmx1995m -Xmn1825m -XX:SurvivorRatio=1 -XX:TargetSurvivorRatio=99 -XX:ParallelGCThreads=2 -XX:AllocatePrefetchDistance=256 -XX:AllocatePrefetchLines=4 -XX:LoopUnrollLimit=45 -XX:InitialTenuringThreshold=12 -XX:MaxTenuringThreshold=15 -XX:InlineSmallCode=3900 -XX:MaxInlineSize=270 -XX:FreqInlineSize=2500 -XX:+UseLargePages -XX:+UseParallelOldGC -XX:UseAVX=1 -XX:BiasedLockingStartupDelay=30000 -XX:-UseAdaptiveSizePolicy -XX:-ThreadLocalHandshakes |
| JVM Affinity: | numactl --physcpubind=[(0,76),(1,77),(2,78),(3,79),(4,80),(5,81),(6,82),(7,83),(8,84),(9,85),(10,86),(11,87),(12,88),(13,89),(14,90),(15,91),(16,92),(17,93),(18,94),(19,95),(20,96),(21,97),(22,98),(23,99),(24,100),(25,101),(26,102),(27,103),(28,104),(29,105),(30,106),(31,107),(32,108),(33,109),(34,110),(35,111),(36,112),(37,113),(38,114),(39,115),(40,116),(41,117),(42,118),(43,119),(44,120),(45,121),(46,122),(47,123),(48,124),(49,125),(50,126),(51,127),(52,128),(53,129),(54,130),(55,131),(56,132),(57,133),(58,134),(59,135),(60,136),(61,137),(62,138),(63,139),(64,140),(65,141),(66,142),(67,143),(68,144),(69,145),(70,146),(71,147),(72,148),(73,149),(74,150),(75,151)] --localalloc |
| JVM Instances: | 76 |
| JVM Initial Heap (MB): | 1995 |
| JVM Maximum Heap (MB): | 1995 |
| JVM Address Bits: | 64 |
| Boot Firmware Version: | 0PYH001040 |
| Management Firmware Version: | 50.31(PYH-C01-097-0S04) |
| Workload Version: | SSJ 1.2.10 |
| Director Location: | Controller |
| Other Software: | None |
| Target Load | Actual Load | ssj_ops | |
|---|---|---|---|
| Target | Actual | ||
| Calibration 1 | 102,406 | ||
| Calibration 2 | 101,237 | ||
| Calibration 3 | 101,692 | ||
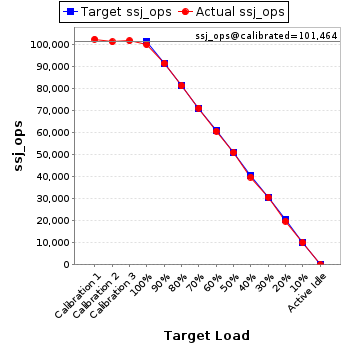
| ssj_ops@calibrated=101,464 | |||
| 100% | 98.5% | 101,464 | 99,930 |
| 90% | 90.1% | 91,318 | 91,432 |
| 80% | 80.1% | 81,172 | 81,232 |
| 70% | 70.1% | 71,025 | 71,148 |
| 60% | 59.7% | 60,879 | 60,610 |
| 50% | 50.1% | 50,732 | 50,867 |
| 40% | 39.2% | 40,586 | 39,805 |
| 30% | 30.2% | 30,439 | 30,663 |
| 20% | 19.5% | 20,293 | 19,767 |
| 10% | 9.9% | 10,146 | 10,083 |
| Active Idle | 0 | 0 | |
| Target Load | Actual Load | ssj_ops | |
|---|---|---|---|
| Target | Actual | ||
| Calibration 1 | 103,148 | ||
| Calibration 2 | 102,299 | ||
| Calibration 3 | 102,817 | ||
| ssj_ops@calibrated=102,558 | |||
| 100% | 99.9% | 102,558 | 102,493 |
| 90% | 88.2% | 92,302 | 90,444 |
| 80% | 80.4% | 82,046 | 82,421 |
| 70% | 70.0% | 71,790 | 71,781 |
| 60% | 60.0% | 61,535 | 61,524 |
| 50% | 49.9% | 51,279 | 51,168 |
| 40% | 39.4% | 41,023 | 40,429 |
| 30% | 30.5% | 30,767 | 31,246 |
| 20% | 19.8% | 20,512 | 20,269 |
| 10% | 10.3% | 10,256 | 10,537 |
| Active Idle | 0 | 0 | |

| Target Load | Actual Load | ssj_ops | |
|---|---|---|---|
| Target | Actual | ||
| Calibration 1 | 95,793 | ||
| Calibration 2 | 96,181 | ||
| Calibration 3 | 96,422 | ||
| ssj_ops@calibrated=96,302 | |||
| 100% | 100.8% | 96,302 | 97,039 |
| 90% | 89.4% | 86,672 | 86,130 |
| 80% | 79.7% | 77,041 | 76,786 |
| 70% | 70.8% | 67,411 | 68,183 |
| 60% | 59.8% | 57,781 | 57,624 |
| 50% | 50.4% | 48,151 | 48,570 |
| 40% | 40.8% | 38,521 | 39,255 |
| 30% | 30.9% | 28,891 | 29,763 |
| 20% | 20.3% | 19,260 | 19,503 |
| 10% | 10.0% | 9,630 | 9,662 |
| Active Idle | 0 | 0 | |

| Target Load | Actual Load | ssj_ops | |
|---|---|---|---|
| Target | Actual | ||
| Calibration 1 | 100,179 | ||
| Calibration 2 | 99,008 | ||
| Calibration 3 | 99,531 | ||
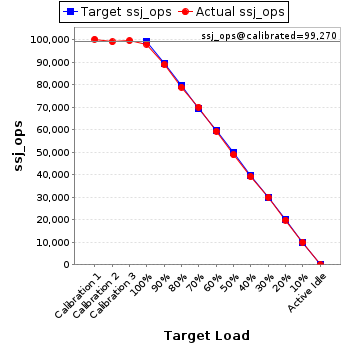
| ssj_ops@calibrated=99,270 | |||
| 100% | 98.7% | 99,270 | 97,958 |
| 90% | 89.5% | 89,343 | 88,855 |
| 80% | 79.4% | 79,416 | 78,869 |
| 70% | 70.5% | 69,489 | 69,967 |
| 60% | 59.7% | 59,562 | 59,242 |
| 50% | 49.2% | 49,635 | 48,797 |
| 40% | 39.4% | 39,708 | 39,095 |
| 30% | 30.2% | 29,781 | 29,971 |
| 20% | 20.0% | 19,854 | 19,839 |
| 10% | 10.1% | 9,927 | 9,996 |
| Active Idle | 0 | 0 | |
| Target Load | Actual Load | ssj_ops | |
|---|---|---|---|
| Target | Actual | ||
| Calibration 1 | 100,367 | ||
| Calibration 2 | 99,070 | ||
| Calibration 3 | 99,387 | ||
| ssj_ops@calibrated=99,228 | |||
| 100% | 98.6% | 99,228 | 97,824 |
| 90% | 90.3% | 89,305 | 89,651 |
| 80% | 80.0% | 79,382 | 79,352 |
| 70% | 71.1% | 69,460 | 70,539 |
| 60% | 60.6% | 59,537 | 60,107 |
| 50% | 50.6% | 49,614 | 50,228 |
| 40% | 40.1% | 39,691 | 39,775 |
| 30% | 29.4% | 29,768 | 29,217 |
| 20% | 20.4% | 19,846 | 20,253 |
| 10% | 9.9% | 9,923 | 9,840 |
| Active Idle | 0 | 0 | |

| Target Load | Actual Load | ssj_ops | |
|---|---|---|---|
| Target | Actual | ||
| Calibration 1 | 89,923 | ||
| Calibration 2 | 89,030 | ||
| Calibration 3 | 88,895 | ||
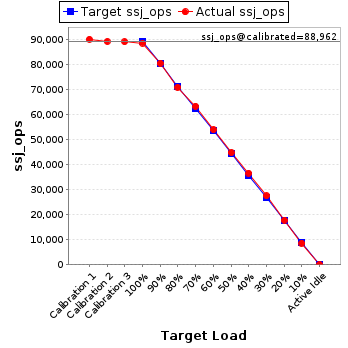
| ssj_ops@calibrated=88,962 | |||
| 100% | 99.4% | 88,962 | 88,423 |
| 90% | 90.3% | 80,066 | 80,368 |
| 80% | 79.5% | 71,170 | 70,746 |
| 70% | 71.1% | 62,274 | 63,250 |
| 60% | 60.5% | 53,377 | 53,842 |
| 50% | 50.3% | 44,481 | 44,719 |
| 40% | 41.1% | 35,585 | 36,528 |
| 30% | 30.9% | 26,689 | 27,459 |
| 20% | 20.0% | 17,792 | 17,779 |
| 10% | 9.6% | 8,896 | 8,562 |
| Active Idle | 0 | 0 | |
| Target Load | Actual Load | ssj_ops | |
|---|---|---|---|
| Target | Actual | ||
| Calibration 1 | 104,091 | ||
| Calibration 2 | 103,940 | ||
| Calibration 3 | 104,177 | ||
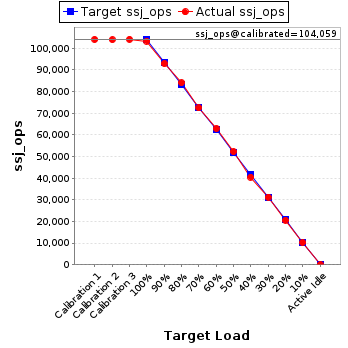
| ssj_ops@calibrated=104,059 | |||
| 100% | 99.3% | 104,059 | 103,330 |
| 90% | 89.3% | 93,653 | 92,889 |
| 80% | 80.7% | 83,247 | 84,027 |
| 70% | 69.6% | 72,841 | 72,430 |
| 60% | 60.5% | 62,435 | 62,939 |
| 50% | 50.2% | 52,029 | 52,249 |
| 40% | 38.9% | 41,624 | 40,466 |
| 30% | 30.0% | 31,218 | 31,227 |
| 20% | 19.8% | 20,812 | 20,562 |
| 10% | 9.9% | 10,406 | 10,295 |
| Active Idle | 0 | 0 | |
| Target Load | Actual Load | ssj_ops | |
|---|---|---|---|
| Target | Actual | ||
| Calibration 1 | 104,827 | ||
| Calibration 2 | 103,352 | ||
| Calibration 3 | 103,874 | ||
| ssj_ops@calibrated=103,613 | |||
| 100% | 100.1% | 103,613 | 103,694 |
| 90% | 90.0% | 93,252 | 93,236 |
| 80% | 80.1% | 82,891 | 83,001 |
| 70% | 70.8% | 72,529 | 73,316 |
| 60% | 59.5% | 62,168 | 61,648 |
| 50% | 50.2% | 51,807 | 52,005 |
| 40% | 40.0% | 41,445 | 41,437 |
| 30% | 29.6% | 31,084 | 30,634 |
| 20% | 19.9% | 20,723 | 20,618 |
| 10% | 10.2% | 10,361 | 10,604 |
| Active Idle | 0 | 0 | |

| Target Load | Actual Load | ssj_ops | |
|---|---|---|---|
| Target | Actual | ||
| Calibration 1 | 104,014 | ||
| Calibration 2 | 103,132 | ||
| Calibration 3 | 103,472 | ||
| ssj_ops@calibrated=103,302 | |||
| 100% | 100.4% | 103,302 | 103,702 |
| 90% | 88.9% | 92,972 | 91,885 |
| 80% | 79.3% | 82,642 | 81,955 |
| 70% | 69.4% | 72,311 | 71,679 |
| 60% | 60.5% | 61,981 | 62,503 |
| 50% | 49.2% | 51,651 | 50,828 |
| 40% | 40.3% | 41,321 | 41,663 |
| 30% | 29.9% | 30,991 | 30,879 |
| 20% | 19.5% | 20,660 | 20,154 |
| 10% | 9.8% | 10,330 | 10,117 |
| Active Idle | 0 | 0 | |

| Target Load | Actual Load | ssj_ops | |
|---|---|---|---|
| Target | Actual | ||
| Calibration 1 | 104,698 | ||
| Calibration 2 | 103,644 | ||
| Calibration 3 | 103,939 | ||
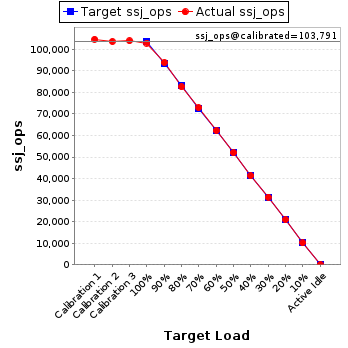
| ssj_ops@calibrated=103,791 | |||
| 100% | 99.2% | 103,791 | 102,941 |
| 90% | 90.4% | 93,412 | 93,870 |
| 80% | 79.6% | 83,033 | 82,579 |
| 70% | 70.3% | 72,654 | 72,914 |
| 60% | 60.0% | 62,275 | 62,236 |
| 50% | 50.1% | 51,896 | 51,988 |
| 40% | 39.7% | 41,517 | 41,204 |
| 30% | 30.3% | 31,137 | 31,398 |
| 20% | 20.1% | 20,758 | 20,837 |
| 10% | 9.7% | 10,379 | 10,112 |
| Active Idle | 0 | 0 | |
| Target Load | Actual Load | ssj_ops | |
|---|---|---|---|
| Target | Actual | ||
| Calibration 1 | 88,386 | ||
| Calibration 2 | 89,986 | ||
| Calibration 3 | 90,586 | ||
| ssj_ops@calibrated=90,286 | |||
| 100% | 99.1% | 90,286 | 89,513 |
| 90% | 89.2% | 81,258 | 80,579 |
| 80% | 81.3% | 72,229 | 73,377 |
| 70% | 70.3% | 63,200 | 63,445 |
| 60% | 59.7% | 54,172 | 53,869 |
| 50% | 49.4% | 45,143 | 44,583 |
| 40% | 40.5% | 36,115 | 36,608 |
| 30% | 29.8% | 27,086 | 26,909 |
| 20% | 20.2% | 18,057 | 18,215 |
| 10% | 9.9% | 9,029 | 8,971 |
| Active Idle | 0 | 0 | |

| Target Load | Actual Load | ssj_ops | |
|---|---|---|---|
| Target | Actual | ||
| Calibration 1 | 96,185 | ||
| Calibration 2 | 96,174 | ||
| Calibration 3 | 96,489 | ||
| ssj_ops@calibrated=96,332 | |||
| 100% | 99.0% | 96,332 | 95,331 |
| 90% | 89.9% | 86,698 | 86,586 |
| 80% | 79.0% | 77,065 | 76,130 |
| 70% | 70.4% | 67,432 | 67,816 |
| 60% | 60.2% | 57,799 | 57,960 |
| 50% | 49.8% | 48,166 | 47,962 |
| 40% | 39.4% | 38,533 | 37,950 |
| 30% | 30.2% | 28,899 | 29,052 |
| 20% | 20.3% | 19,266 | 19,583 |
| 10% | 10.2% | 9,633 | 9,783 |
| Active Idle | 0 | 0 | |

| Target Load | Actual Load | ssj_ops | |
|---|---|---|---|
| Target | Actual | ||
| Calibration 1 | 104,162 | ||
| Calibration 2 | 104,039 | ||
| Calibration 3 | 104,900 | ||
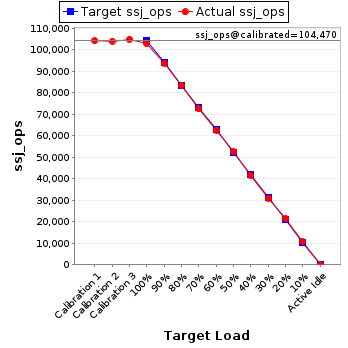
| ssj_ops@calibrated=104,470 | |||
| 100% | 98.5% | 104,470 | 102,951 |
| 90% | 89.8% | 94,023 | 93,795 |
| 80% | 80.0% | 83,576 | 83,574 |
| 70% | 69.5% | 73,129 | 72,613 |
| 60% | 60.0% | 62,682 | 62,664 |
| 50% | 50.2% | 52,235 | 52,496 |
| 40% | 39.9% | 41,788 | 41,638 |
| 30% | 29.6% | 31,341 | 30,933 |
| 20% | 20.4% | 20,894 | 21,279 |
| 10% | 10.3% | 10,447 | 10,737 |
| Active Idle | 0 | 0 | |
| Target Load | Actual Load | ssj_ops | |
|---|---|---|---|
| Target | Actual | ||
| Calibration 1 | 104,961 | ||
| Calibration 2 | 103,449 | ||
| Calibration 3 | 103,641 | ||
| ssj_ops@calibrated=103,545 | |||
| 100% | 98.7% | 103,545 | 102,248 |
| 90% | 89.0% | 93,190 | 92,144 |
| 80% | 80.3% | 82,836 | 83,168 |
| 70% | 70.0% | 72,481 | 72,529 |
| 60% | 59.3% | 62,127 | 61,438 |
| 50% | 49.8% | 51,772 | 51,591 |
| 40% | 40.2% | 41,418 | 41,592 |
| 30% | 29.3% | 31,063 | 30,337 |
| 20% | 20.0% | 20,709 | 20,680 |
| 10% | 10.0% | 10,354 | 10,373 |
| Active Idle | 0 | 0 | |

| Target Load | Actual Load | ssj_ops | |
|---|---|---|---|
| Target | Actual | ||
| Calibration 1 | 101,549 | ||
| Calibration 2 | 100,680 | ||
| Calibration 3 | 101,369 | ||
| ssj_ops@calibrated=101,025 | |||
| 100% | 99.8% | 101,025 | 100,833 |
| 90% | 89.6% | 90,922 | 90,491 |
| 80% | 80.1% | 80,820 | 80,939 |
| 70% | 69.1% | 70,717 | 69,813 |
| 60% | 60.3% | 60,615 | 60,904 |
| 50% | 49.9% | 50,512 | 50,370 |
| 40% | 39.6% | 40,410 | 39,988 |
| 30% | 30.1% | 30,307 | 30,437 |
| 20% | 20.0% | 20,205 | 20,228 |
| 10% | 9.9% | 10,102 | 9,954 |
| Active Idle | 0 | 0 | |

| Target Load | Actual Load | ssj_ops | |
|---|---|---|---|
| Target | Actual | ||
| Calibration 1 | 105,860 | ||
| Calibration 2 | 104,634 | ||
| Calibration 3 | 104,815 | ||
| ssj_ops@calibrated=104,724 | |||
| 100% | 100.4% | 104,724 | 105,174 |
| 90% | 91.1% | 94,252 | 95,359 |
| 80% | 80.2% | 83,780 | 84,035 |
| 70% | 70.3% | 73,307 | 73,629 |
| 60% | 60.3% | 62,835 | 63,143 |
| 50% | 50.3% | 52,362 | 52,687 |
| 40% | 39.1% | 41,890 | 40,994 |
| 30% | 30.3% | 31,417 | 31,680 |
| 20% | 20.1% | 20,945 | 21,076 |
| 10% | 10.1% | 10,472 | 10,549 |
| Active Idle | 0 | 0 | |

| Target Load | Actual Load | ssj_ops | |
|---|---|---|---|
| Target | Actual | ||
| Calibration 1 | 100,774 | ||
| Calibration 2 | 99,699 | ||
| Calibration 3 | 99,754 | ||
| ssj_ops@calibrated=99,727 | |||
| 100% | 100.1% | 99,727 | 99,794 |
| 90% | 90.3% | 89,754 | 90,064 |
| 80% | 79.9% | 79,781 | 79,726 |
| 70% | 70.0% | 69,809 | 69,784 |
| 60% | 59.6% | 59,836 | 59,473 |
| 50% | 50.4% | 49,863 | 50,226 |
| 40% | 39.7% | 39,891 | 39,637 |
| 30% | 29.6% | 29,918 | 29,555 |
| 20% | 20.5% | 19,945 | 20,394 |
| 10% | 9.9% | 9,973 | 9,856 |
| Active Idle | 0 | 0 | |

| Target Load | Actual Load | ssj_ops | |
|---|---|---|---|
| Target | Actual | ||
| Calibration 1 | 102,532 | ||
| Calibration 2 | 100,889 | ||
| Calibration 3 | 101,323 | ||
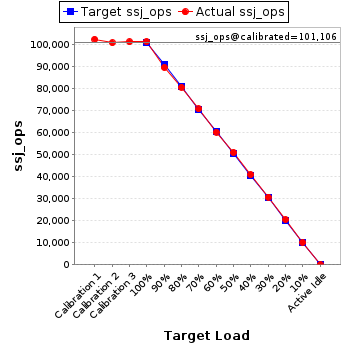
| ssj_ops@calibrated=101,106 | |||
| 100% | 100.4% | 101,106 | 101,483 |
| 90% | 88.7% | 90,995 | 89,662 |
| 80% | 79.8% | 80,885 | 80,702 |
| 70% | 70.0% | 70,774 | 70,804 |
| 60% | 59.6% | 60,664 | 60,303 |
| 50% | 50.5% | 50,553 | 51,046 |
| 40% | 40.5% | 40,442 | 40,971 |
| 30% | 30.4% | 30,332 | 30,742 |
| 20% | 20.3% | 20,221 | 20,535 |
| 10% | 10.1% | 10,111 | 10,183 |
| Active Idle | 0 | 0 | |
| Target Load | Actual Load | ssj_ops | |
|---|---|---|---|
| Target | Actual | ||
| Calibration 1 | 104,689 | ||
| Calibration 2 | 103,900 | ||
| Calibration 3 | 104,219 | ||
| ssj_ops@calibrated=104,059 | |||
| 100% | 99.2% | 104,059 | 103,248 |
| 90% | 89.6% | 93,653 | 93,259 |
| 80% | 79.5% | 83,248 | 82,710 |
| 70% | 69.9% | 72,842 | 72,735 |
| 60% | 61.0% | 62,436 | 63,490 |
| 50% | 50.3% | 52,030 | 52,344 |
| 40% | 40.2% | 41,624 | 41,881 |
| 30% | 30.1% | 31,218 | 31,299 |
| 20% | 20.0% | 20,812 | 20,815 |
| 10% | 10.2% | 10,406 | 10,642 |
| Active Idle | 0 | 0 | |

| Target Load | Actual Load | ssj_ops | |
|---|---|---|---|
| Target | Actual | ||
| Calibration 1 | 105,374 | ||
| Calibration 2 | 104,353 | ||
| Calibration 3 | 104,353 | ||
| ssj_ops@calibrated=104,353 | |||
| 100% | 99.1% | 104,353 | 103,426 |
| 90% | 89.0% | 93,918 | 92,865 |
| 80% | 79.5% | 83,483 | 82,935 |
| 70% | 70.3% | 73,047 | 73,369 |
| 60% | 59.4% | 62,612 | 62,000 |
| 50% | 50.7% | 52,177 | 52,949 |
| 40% | 40.1% | 41,741 | 41,872 |
| 30% | 29.8% | 31,306 | 31,120 |
| 20% | 19.8% | 20,871 | 20,621 |
| 10% | 10.3% | 10,435 | 10,741 |
| Active Idle | 0 | 0 | |

| Target Load | Actual Load | ssj_ops | |
|---|---|---|---|
| Target | Actual | ||
| Calibration 1 | 103,429 | ||
| Calibration 2 | 101,507 | ||
| Calibration 3 | 102,016 | ||
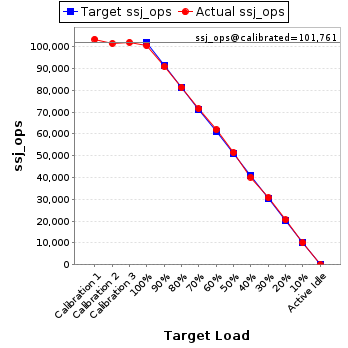
| ssj_ops@calibrated=101,761 | |||
| 100% | 98.7% | 101,761 | 100,444 |
| 90% | 89.2% | 91,585 | 90,817 |
| 80% | 79.9% | 81,409 | 81,351 |
| 70% | 70.3% | 71,233 | 71,522 |
| 60% | 60.9% | 61,057 | 61,971 |
| 50% | 50.5% | 50,881 | 51,432 |
| 40% | 39.5% | 40,705 | 40,146 |
| 30% | 30.2% | 30,528 | 30,699 |
| 20% | 20.2% | 20,352 | 20,537 |
| 10% | 9.9% | 10,176 | 10,120 |
| Active Idle | 0 | 0 | |
| Target Load | Actual Load | ssj_ops | |
|---|---|---|---|
| Target | Actual | ||
| Calibration 1 | 102,907 | ||
| Calibration 2 | 101,482 | ||
| Calibration 3 | 101,780 | ||
| ssj_ops@calibrated=101,631 | |||
| 100% | 99.2% | 101,631 | 100,785 |
| 90% | 90.3% | 91,467 | 91,764 |
| 80% | 80.4% | 81,304 | 81,694 |
| 70% | 70.3% | 71,141 | 71,473 |
| 60% | 60.4% | 60,978 | 61,377 |
| 50% | 49.7% | 50,815 | 50,483 |
| 40% | 40.4% | 40,652 | 41,044 |
| 30% | 29.8% | 30,489 | 30,312 |
| 20% | 20.0% | 20,326 | 20,295 |
| 10% | 10.1% | 10,163 | 10,267 |
| Active Idle | 0 | 0 | |

| Target Load | Actual Load | ssj_ops | |
|---|---|---|---|
| Target | Actual | ||
| Calibration 1 | 102,628 | ||
| Calibration 2 | 101,866 | ||
| Calibration 3 | 101,833 | ||
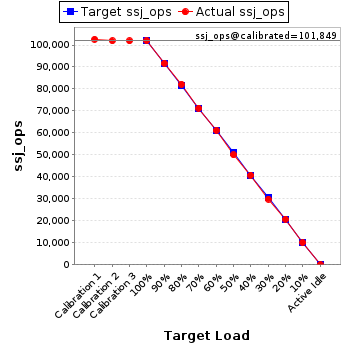
| ssj_ops@calibrated=101,849 | |||
| 100% | 100.1% | 101,849 | 101,998 |
| 90% | 90.0% | 91,665 | 91,680 |
| 80% | 80.7% | 81,480 | 82,161 |
| 70% | 70.0% | 71,295 | 71,291 |
| 60% | 60.1% | 61,110 | 61,189 |
| 50% | 49.1% | 50,925 | 49,978 |
| 40% | 40.0% | 40,740 | 40,737 |
| 30% | 29.3% | 30,555 | 29,892 |
| 20% | 20.4% | 20,370 | 20,761 |
| 10% | 9.9% | 10,185 | 10,125 |
| Active Idle | 0 | 0 | |
| Target Load | Actual Load | ssj_ops | |
|---|---|---|---|
| Target | Actual | ||
| Calibration 1 | 105,312 | ||
| Calibration 2 | 104,002 | ||
| Calibration 3 | 104,208 | ||
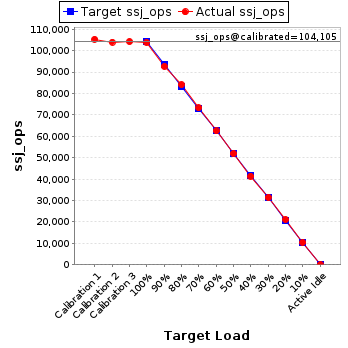
| ssj_ops@calibrated=104,105 | |||
| 100% | 99.7% | 104,105 | 103,812 |
| 90% | 89.0% | 93,694 | 92,640 |
| 80% | 80.7% | 83,284 | 84,049 |
| 70% | 70.3% | 72,873 | 73,232 |
| 60% | 60.0% | 62,463 | 62,467 |
| 50% | 49.8% | 52,052 | 51,823 |
| 40% | 39.7% | 41,642 | 41,344 |
| 30% | 30.2% | 31,231 | 31,420 |
| 20% | 20.3% | 20,821 | 21,140 |
| 10% | 10.1% | 10,410 | 10,479 |
| Active Idle | 0 | 0 | |
| Target Load | Actual Load | ssj_ops | |
|---|---|---|---|
| Target | Actual | ||
| Calibration 1 | 103,651 | ||
| Calibration 2 | 101,967 | ||
| Calibration 3 | 102,227 | ||
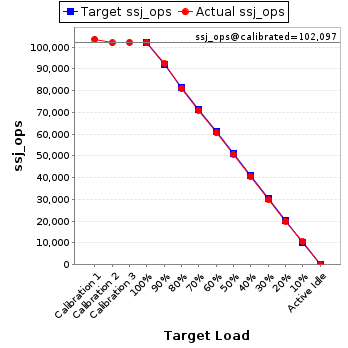
| ssj_ops@calibrated=102,097 | |||
| 100% | 100.1% | 102,097 | 102,170 |
| 90% | 90.7% | 91,887 | 92,593 |
| 80% | 79.3% | 81,677 | 80,996 |
| 70% | 69.6% | 71,468 | 71,027 |
| 60% | 59.4% | 61,258 | 60,632 |
| 50% | 49.8% | 51,048 | 50,882 |
| 40% | 39.9% | 40,839 | 40,730 |
| 30% | 29.3% | 30,629 | 29,875 |
| 20% | 19.6% | 20,419 | 20,057 |
| 10% | 10.3% | 10,210 | 10,554 |
| Active Idle | 0 | 0 | |
| Target Load | Actual Load | ssj_ops | |
|---|---|---|---|
| Target | Actual | ||
| Calibration 1 | 103,452 | ||
| Calibration 2 | 102,200 | ||
| Calibration 3 | 102,132 | ||
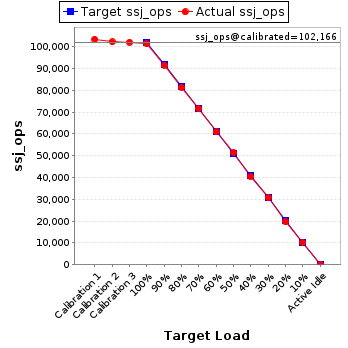
| ssj_ops@calibrated=102,166 | |||
| 100% | 99.2% | 102,166 | 101,319 |
| 90% | 89.7% | 91,949 | 91,597 |
| 80% | 79.7% | 81,733 | 81,435 |
| 70% | 70.0% | 71,516 | 71,540 |
| 60% | 59.6% | 61,300 | 60,892 |
| 50% | 50.3% | 51,083 | 51,358 |
| 40% | 39.6% | 40,866 | 40,501 |
| 30% | 30.2% | 30,650 | 30,821 |
| 20% | 19.2% | 20,433 | 19,608 |
| 10% | 9.9% | 10,217 | 10,125 |
| Active Idle | 0 | 0 | |
| Target Load | Actual Load | ssj_ops | |
|---|---|---|---|
| Target | Actual | ||
| Calibration 1 | 99,226 | ||
| Calibration 2 | 98,912 | ||
| Calibration 3 | 99,162 | ||
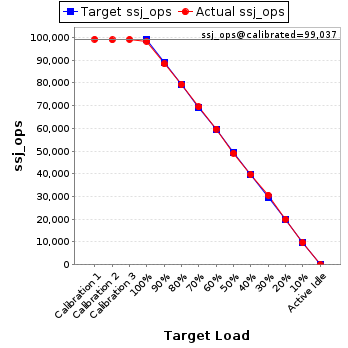
| ssj_ops@calibrated=99,037 | |||
| 100% | 99.2% | 99,037 | 98,259 |
| 90% | 89.2% | 89,133 | 88,368 |
| 80% | 80.1% | 79,229 | 79,321 |
| 70% | 70.1% | 69,326 | 69,419 |
| 60% | 60.3% | 59,422 | 59,712 |
| 50% | 49.6% | 49,518 | 49,093 |
| 40% | 40.0% | 39,615 | 39,598 |
| 30% | 30.9% | 29,711 | 30,633 |
| 20% | 20.2% | 19,807 | 20,021 |
| 10% | 9.9% | 9,904 | 9,771 |
| Active Idle | 0 | 0 | |
| Target Load | Actual Load | ssj_ops | |
|---|---|---|---|
| Target | Actual | ||
| Calibration 1 | 103,574 | ||
| Calibration 2 | 102,235 | ||
| Calibration 3 | 102,616 | ||
| ssj_ops@calibrated=102,426 | |||
| 100% | 100.4% | 102,426 | 102,852 |
| 90% | 89.3% | 92,183 | 91,430 |
| 80% | 79.0% | 81,941 | 80,899 |
| 70% | 70.1% | 71,698 | 71,825 |
| 60% | 60.0% | 61,455 | 61,408 |
| 50% | 50.9% | 51,213 | 52,106 |
| 40% | 39.9% | 40,970 | 40,821 |
| 30% | 30.0% | 30,728 | 30,731 |
| 20% | 20.0% | 20,485 | 20,502 |
| 10% | 9.9% | 10,243 | 10,150 |
| Active Idle | 0 | 0 | |

| Target Load | Actual Load | ssj_ops | |
|---|---|---|---|
| Target | Actual | ||
| Calibration 1 | 104,529 | ||
| Calibration 2 | 103,440 | ||
| Calibration 3 | 103,869 | ||
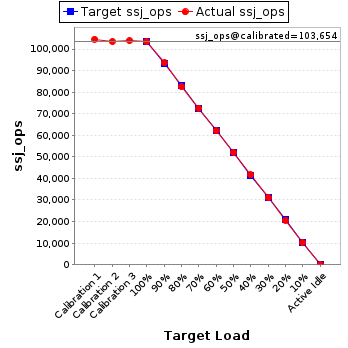
| ssj_ops@calibrated=103,654 | |||
| 100% | 99.8% | 103,654 | 103,448 |
| 90% | 90.2% | 93,289 | 93,540 |
| 80% | 79.5% | 82,924 | 82,436 |
| 70% | 70.1% | 72,558 | 72,628 |
| 60% | 59.8% | 62,193 | 62,003 |
| 50% | 50.3% | 51,827 | 52,141 |
| 40% | 40.1% | 41,462 | 41,593 |
| 30% | 30.0% | 31,096 | 31,091 |
| 20% | 19.8% | 20,731 | 20,573 |
| 10% | 9.8% | 10,365 | 10,154 |
| Active Idle | 0 | 0 | |
| Target Load | Actual Load | ssj_ops | |
|---|---|---|---|
| Target | Actual | ||
| Calibration 1 | 105,169 | ||
| Calibration 2 | 103,864 | ||
| Calibration 3 | 103,997 | ||
| ssj_ops@calibrated=103,930 | |||
| 100% | 100.6% | 103,930 | 104,594 |
| 90% | 90.1% | 93,537 | 93,622 |
| 80% | 78.9% | 83,144 | 81,970 |
| 70% | 69.1% | 72,751 | 71,864 |
| 60% | 59.6% | 62,358 | 61,912 |
| 50% | 50.3% | 51,965 | 52,240 |
| 40% | 39.5% | 41,572 | 41,080 |
| 30% | 29.2% | 31,179 | 30,358 |
| 20% | 20.1% | 20,786 | 20,881 |
| 10% | 10.2% | 10,393 | 10,564 |
| Active Idle | 0 | 0 | |

| Target Load | Actual Load | ssj_ops | |
|---|---|---|---|
| Target | Actual | ||
| Calibration 1 | 105,917 | ||
| Calibration 2 | 104,383 | ||
| Calibration 3 | 104,457 | ||
| ssj_ops@calibrated=104,420 | |||
| 100% | 100.4% | 104,420 | 104,807 |
| 90% | 90.2% | 93,978 | 94,196 |
| 80% | 80.1% | 83,536 | 83,647 |
| 70% | 70.1% | 73,094 | 73,161 |
| 60% | 59.9% | 62,652 | 62,593 |
| 50% | 49.9% | 52,210 | 52,108 |
| 40% | 40.3% | 41,768 | 42,038 |
| 30% | 29.6% | 31,326 | 30,949 |
| 20% | 20.3% | 20,884 | 21,167 |
| 10% | 10.0% | 10,442 | 10,431 |
| Active Idle | 0 | 0 | |

| Target Load | Actual Load | ssj_ops | |
|---|---|---|---|
| Target | Actual | ||
| Calibration 1 | 95,367 | ||
| Calibration 2 | 94,849 | ||
| Calibration 3 | 94,783 | ||
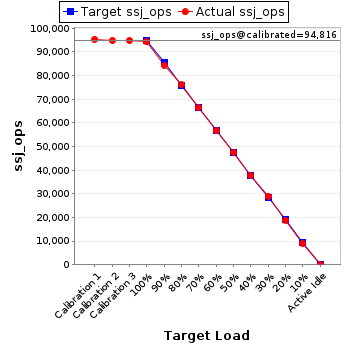
| ssj_ops@calibrated=94,816 | |||
| 100% | 99.4% | 94,816 | 94,235 |
| 90% | 89.0% | 85,334 | 84,369 |
| 80% | 80.3% | 75,853 | 76,125 |
| 70% | 70.0% | 66,371 | 66,374 |
| 60% | 59.7% | 56,889 | 56,646 |
| 50% | 50.2% | 47,408 | 47,589 |
| 40% | 39.7% | 37,926 | 37,610 |
| 30% | 30.6% | 28,445 | 29,005 |
| 20% | 19.9% | 18,963 | 18,851 |
| 10% | 9.6% | 9,482 | 9,079 |
| Active Idle | 0 | 0 | |
| Target Load | Actual Load | ssj_ops | |
|---|---|---|---|
| Target | Actual | ||
| Calibration 1 | 103,041 | ||
| Calibration 2 | 102,657 | ||
| Calibration 3 | 103,056 | ||
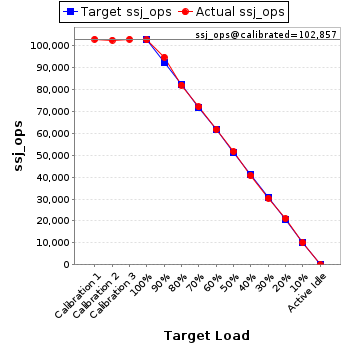
| ssj_ops@calibrated=102,857 | |||
| 100% | 99.9% | 102,857 | 102,719 |
| 90% | 92.2% | 92,571 | 94,854 |
| 80% | 79.8% | 82,285 | 82,119 |
| 70% | 70.1% | 72,000 | 72,123 |
| 60% | 60.1% | 61,714 | 61,811 |
| 50% | 50.3% | 51,428 | 51,692 |
| 40% | 39.5% | 41,143 | 40,651 |
| 30% | 29.6% | 30,857 | 30,402 |
| 20% | 20.5% | 20,571 | 21,130 |
| 10% | 9.9% | 10,286 | 10,158 |
| Active Idle | 0 | 0 | |
| Target Load | Actual Load | ssj_ops | |
|---|---|---|---|
| Target | Actual | ||
| Calibration 1 | 101,625 | ||
| Calibration 2 | 101,406 | ||
| Calibration 3 | 101,692 | ||
| ssj_ops@calibrated=101,549 | |||
| 100% | 100.1% | 101,549 | 101,653 |
| 90% | 90.3% | 91,394 | 91,749 |
| 80% | 80.3% | 81,239 | 81,524 |
| 70% | 69.3% | 71,084 | 70,371 |
| 60% | 59.5% | 60,930 | 60,418 |
| 50% | 50.4% | 50,775 | 51,199 |
| 40% | 40.2% | 40,620 | 40,870 |
| 30% | 30.2% | 30,465 | 30,706 |
| 20% | 20.6% | 20,310 | 20,928 |
| 10% | 10.1% | 10,155 | 10,283 |
| Active Idle | 0 | 0 | |

| Target Load | Actual Load | ssj_ops | |
|---|---|---|---|
| Target | Actual | ||
| Calibration 1 | 105,162 | ||
| Calibration 2 | 103,848 | ||
| Calibration 3 | 104,440 | ||
| ssj_ops@calibrated=104,144 | |||
| 100% | 99.2% | 104,144 | 103,284 |
| 90% | 90.2% | 93,730 | 93,916 |
| 80% | 80.7% | 83,315 | 84,070 |
| 70% | 69.9% | 72,901 | 72,813 |
| 60% | 60.2% | 62,487 | 62,673 |
| 50% | 50.6% | 52,072 | 52,654 |
| 40% | 39.4% | 41,658 | 41,078 |
| 30% | 29.3% | 31,243 | 30,515 |
| 20% | 19.8% | 20,829 | 20,595 |
| 10% | 9.4% | 10,414 | 9,837 |
| Active Idle | 0 | 0 | |

| Target Load | Actual Load | ssj_ops | |
|---|---|---|---|
| Target | Actual | ||
| Calibration 1 | 102,734 | ||
| Calibration 2 | 101,521 | ||
| Calibration 3 | 101,855 | ||
| ssj_ops@calibrated=101,688 | |||
| 100% | 100.2% | 101,688 | 101,880 |
| 90% | 89.5% | 91,519 | 90,985 |
| 80% | 79.7% | 81,351 | 81,060 |
| 70% | 69.8% | 71,182 | 71,025 |
| 60% | 59.6% | 61,013 | 60,639 |
| 50% | 50.0% | 50,844 | 50,842 |
| 40% | 40.2% | 40,675 | 40,855 |
| 30% | 30.6% | 30,506 | 31,092 |
| 20% | 19.7% | 20,338 | 20,023 |
| 10% | 10.2% | 10,169 | 10,379 |
| Active Idle | 0 | 0 | |

| Target Load | Actual Load | ssj_ops | |
|---|---|---|---|
| Target | Actual | ||
| Calibration 1 | 95,851 | ||
| Calibration 2 | 95,374 | ||
| Calibration 3 | 95,426 | ||
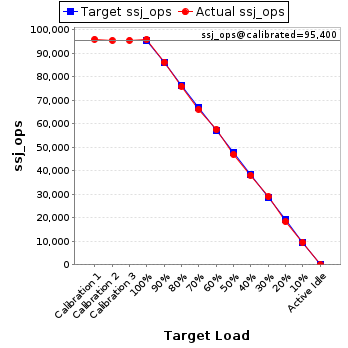
| ssj_ops@calibrated=95,400 | |||
| 100% | 100.5% | 95,400 | 95,874 |
| 90% | 90.3% | 85,860 | 86,129 |
| 80% | 79.5% | 76,320 | 75,863 |
| 70% | 69.2% | 66,780 | 66,040 |
| 60% | 60.3% | 57,240 | 57,502 |
| 50% | 49.2% | 47,700 | 46,898 |
| 40% | 39.8% | 38,160 | 37,924 |
| 30% | 30.3% | 28,620 | 28,912 |
| 20% | 19.2% | 19,080 | 18,321 |
| 10% | 10.0% | 9,540 | 9,550 |
| Active Idle | 0 | 0 | |
| Target Load | Actual Load | ssj_ops | |
|---|---|---|---|
| Target | Actual | ||
| Calibration 1 | 100,881 | ||
| Calibration 2 | 100,269 | ||
| Calibration 3 | 101,021 | ||
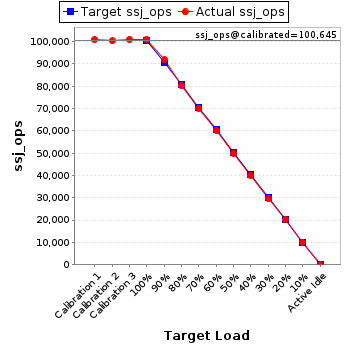
| ssj_ops@calibrated=100,645 | |||
| 100% | 100.2% | 100,645 | 100,849 |
| 90% | 91.2% | 90,581 | 91,793 |
| 80% | 79.7% | 80,516 | 80,202 |
| 70% | 69.7% | 70,452 | 70,183 |
| 60% | 59.9% | 60,387 | 60,290 |
| 50% | 49.7% | 50,323 | 49,986 |
| 40% | 39.9% | 40,258 | 40,118 |
| 30% | 29.3% | 30,194 | 29,525 |
| 20% | 20.0% | 20,129 | 20,146 |
| 10% | 9.9% | 10,065 | 9,942 |
| Active Idle | 0 | 0 | |
| Target Load | Actual Load | ssj_ops | |
|---|---|---|---|
| Target | Actual | ||
| Calibration 1 | 102,938 | ||
| Calibration 2 | 101,579 | ||
| Calibration 3 | 101,819 | ||
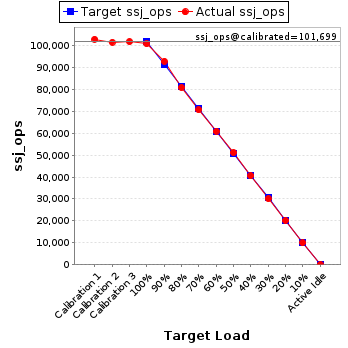
| ssj_ops@calibrated=101,699 | |||
| 100% | 99.1% | 101,699 | 100,813 |
| 90% | 91.3% | 91,529 | 92,890 |
| 80% | 79.5% | 81,359 | 80,835 |
| 70% | 69.5% | 71,189 | 70,708 |
| 60% | 59.9% | 61,019 | 60,954 |
| 50% | 50.3% | 50,850 | 51,150 |
| 40% | 39.9% | 40,680 | 40,529 |
| 30% | 29.6% | 30,510 | 30,110 |
| 20% | 19.8% | 20,340 | 20,172 |
| 10% | 9.8% | 10,170 | 9,992 |
| Active Idle | 0 | 0 | |
| Target Load | Actual Load | ssj_ops | |
|---|---|---|---|
| Target | Actual | ||
| Calibration 1 | 102,795 | ||
| Calibration 2 | 102,004 | ||
| Calibration 3 | 102,255 | ||
| ssj_ops@calibrated=102,130 | |||
| 100% | 99.3% | 102,130 | 101,368 |
| 90% | 89.0% | 91,917 | 90,942 |
| 80% | 80.4% | 81,704 | 82,072 |
| 70% | 69.7% | 71,491 | 71,161 |
| 60% | 60.2% | 61,278 | 61,466 |
| 50% | 50.6% | 51,065 | 51,681 |
| 40% | 40.0% | 40,852 | 40,858 |
| 30% | 29.8% | 30,639 | 30,433 |
| 20% | 20.0% | 20,426 | 20,471 |
| 10% | 10.1% | 10,213 | 10,333 |
| Active Idle | 0 | 0 | |

| Target Load | Actual Load | ssj_ops | |
|---|---|---|---|
| Target | Actual | ||
| Calibration 1 | 104,373 | ||
| Calibration 2 | 103,149 | ||
| Calibration 3 | 103,556 | ||
| ssj_ops@calibrated=103,353 | |||
| 100% | 98.8% | 103,353 | 102,078 |
| 90% | 89.8% | 93,017 | 92,830 |
| 80% | 80.0% | 82,682 | 82,635 |
| 70% | 70.4% | 72,347 | 72,736 |
| 60% | 59.8% | 62,012 | 61,829 |
| 50% | 49.6% | 51,676 | 51,289 |
| 40% | 39.7% | 41,341 | 41,030 |
| 30% | 29.6% | 31,006 | 30,637 |
| 20% | 20.4% | 20,671 | 21,131 |
| 10% | 10.7% | 10,335 | 11,016 |
| Active Idle | 0 | 0 | |
| Target Load | Actual Load | ssj_ops | |
|---|---|---|---|
| Target | Actual | ||
| Calibration 1 | 105,952 | ||
| Calibration 2 | 104,752 | ||
| Calibration 3 | 104,394 | ||
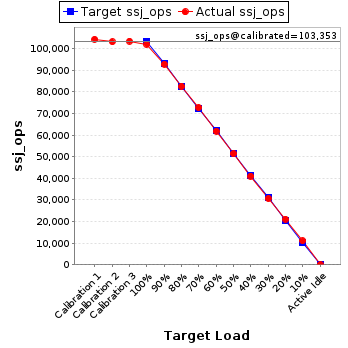
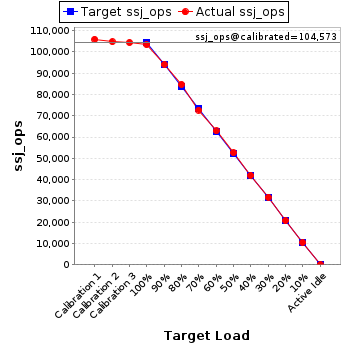
| ssj_ops@calibrated=104,573 | |||
| 100% | 98.9% | 104,573 | 103,378 |
| 90% | 90.0% | 94,116 | 94,084 |
| 80% | 81.0% | 83,659 | 84,713 |
| 70% | 69.5% | 73,201 | 72,653 |
| 60% | 60.1% | 62,744 | 62,831 |
| 50% | 50.3% | 52,287 | 52,577 |
| 40% | 40.1% | 41,829 | 41,946 |
| 30% | 30.3% | 31,372 | 31,721 |
| 20% | 19.8% | 20,915 | 20,675 |
| 10% | 10.0% | 10,457 | 10,479 |
| Active Idle | 0 | 0 | |
| Target Load | Actual Load | ssj_ops | |
|---|---|---|---|
| Target | Actual | ||
| Calibration 1 | 103,249 | ||
| Calibration 2 | 102,830 | ||
| Calibration 3 | 102,831 | ||
| ssj_ops@calibrated=102,831 | |||
| 100% | 99.7% | 102,831 | 102,537 |
| 90% | 90.4% | 92,548 | 92,969 |
| 80% | 79.9% | 82,265 | 82,179 |
| 70% | 70.2% | 71,981 | 72,238 |
| 60% | 60.1% | 61,698 | 61,767 |
| 50% | 50.1% | 51,415 | 51,484 |
| 40% | 40.0% | 41,132 | 41,153 |
| 30% | 30.0% | 30,849 | 30,820 |
| 20% | 20.3% | 20,566 | 20,851 |
| 10% | 10.2% | 10,283 | 10,458 |
| Active Idle | 0 | 0 | |

| Target Load | Actual Load | ssj_ops | |
|---|---|---|---|
| Target | Actual | ||
| Calibration 1 | 95,166 | ||
| Calibration 2 | 92,913 | ||
| Calibration 3 | 94,751 | ||
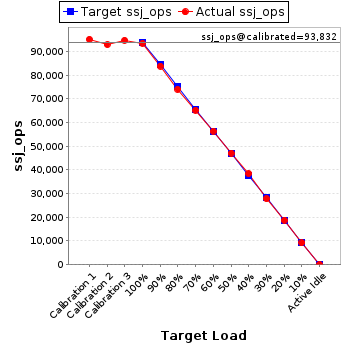
| ssj_ops@calibrated=93,832 | |||
| 100% | 99.6% | 93,832 | 93,490 |
| 90% | 89.4% | 84,449 | 83,849 |
| 80% | 78.9% | 75,066 | 74,003 |
| 70% | 69.5% | 65,682 | 65,214 |
| 60% | 60.1% | 56,299 | 56,420 |
| 50% | 50.2% | 46,916 | 47,059 |
| 40% | 41.0% | 37,533 | 38,432 |
| 30% | 29.6% | 28,150 | 27,787 |
| 20% | 20.0% | 18,766 | 18,809 |
| 10% | 9.8% | 9,383 | 9,229 |
| Active Idle | 0 | 0 | |
| Target Load | Actual Load | ssj_ops | |
|---|---|---|---|
| Target | Actual | ||
| Calibration 1 | 105,003 | ||
| Calibration 2 | 105,357 | ||
| Calibration 3 | 105,792 | ||
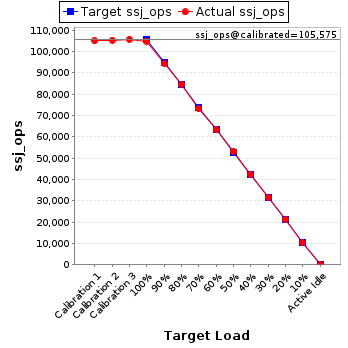
| ssj_ops@calibrated=105,575 | |||
| 100% | 99.4% | 105,575 | 104,894 |
| 90% | 89.4% | 95,017 | 94,371 |
| 80% | 80.3% | 84,460 | 84,751 |
| 70% | 69.3% | 73,902 | 73,159 |
| 60% | 59.9% | 63,345 | 63,286 |
| 50% | 50.4% | 52,787 | 53,229 |
| 40% | 40.0% | 42,230 | 42,260 |
| 30% | 30.1% | 31,672 | 31,729 |
| 20% | 20.2% | 21,115 | 21,321 |
| 10% | 9.7% | 10,557 | 10,237 |
| Active Idle | 0 | 0 | |
| Target Load | Actual Load | ssj_ops | |
|---|---|---|---|
| Target | Actual | ||
| Calibration 1 | 101,921 | ||
| Calibration 2 | 100,794 | ||
| Calibration 3 | 101,298 | ||
| ssj_ops@calibrated=101,046 | |||
| 100% | 98.9% | 101,046 | 99,956 |
| 90% | 89.1% | 90,941 | 90,026 |
| 80% | 78.9% | 80,836 | 79,677 |
| 70% | 69.9% | 70,732 | 70,588 |
| 60% | 59.6% | 60,627 | 60,195 |
| 50% | 49.5% | 50,523 | 50,022 |
| 40% | 40.1% | 40,418 | 40,533 |
| 30% | 30.3% | 30,314 | 30,639 |
| 20% | 19.8% | 20,209 | 20,021 |
| 10% | 10.5% | 10,105 | 10,567 |
| Active Idle | 0 | 0 | |

| Target Load | Actual Load | ssj_ops | |
|---|---|---|---|
| Target | Actual | ||
| Calibration 1 | 93,371 | ||
| Calibration 2 | 91,977 | ||
| Calibration 3 | 92,091 | ||
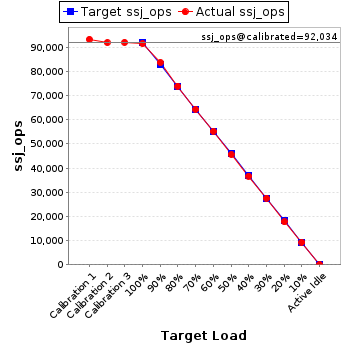
| ssj_ops@calibrated=92,034 | |||
| 100% | 99.5% | 92,034 | 91,591 |
| 90% | 91.0% | 82,831 | 83,766 |
| 80% | 80.3% | 73,627 | 73,948 |
| 70% | 69.9% | 64,424 | 64,374 |
| 60% | 60.1% | 55,220 | 55,324 |
| 50% | 49.5% | 46,017 | 45,597 |
| 40% | 39.9% | 36,814 | 36,712 |
| 30% | 30.0% | 27,610 | 27,602 |
| 20% | 19.2% | 18,407 | 17,684 |
| 10% | 10.1% | 9,203 | 9,317 |
| Active Idle | 0 | 0 | |
| Target Load | Actual Load | ssj_ops | |
|---|---|---|---|
| Target | Actual | ||
| Calibration 1 | 104,461 | ||
| Calibration 2 | 104,056 | ||
| Calibration 3 | 104,584 | ||
| ssj_ops@calibrated=104,320 | |||
| 100% | 99.3% | 104,320 | 103,632 |
| 90% | 90.3% | 93,888 | 94,191 |
| 80% | 78.7% | 83,456 | 82,136 |
| 70% | 70.5% | 73,024 | 73,548 |
| 60% | 60.5% | 62,592 | 63,156 |
| 50% | 50.1% | 52,160 | 52,304 |
| 40% | 40.7% | 41,728 | 42,444 |
| 30% | 30.4% | 31,296 | 31,714 |
| 20% | 19.4% | 20,864 | 20,283 |
| 10% | 10.1% | 10,432 | 10,551 |
| Active Idle | 0 | 0 | |

| Target Load | Actual Load | ssj_ops | |
|---|---|---|---|
| Target | Actual | ||
| Calibration 1 | 104,532 | ||
| Calibration 2 | 103,625 | ||
| Calibration 3 | 103,898 | ||
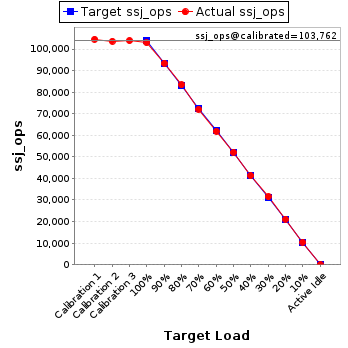
| ssj_ops@calibrated=103,762 | |||
| 100% | 99.2% | 103,762 | 102,897 |
| 90% | 90.0% | 93,385 | 93,385 |
| 80% | 80.3% | 83,009 | 83,365 |
| 70% | 69.5% | 72,633 | 72,112 |
| 60% | 59.6% | 62,257 | 61,833 |
| 50% | 50.3% | 51,881 | 52,187 |
| 40% | 39.7% | 41,505 | 41,195 |
| 30% | 30.4% | 31,128 | 31,519 |
| 20% | 20.4% | 20,752 | 21,150 |
| 10% | 10.1% | 10,376 | 10,475 |
| Active Idle | 0 | 0 | |
| Target Load | Actual Load | ssj_ops | |
|---|---|---|---|
| Target | Actual | ||
| Calibration 1 | 102,756 | ||
| Calibration 2 | 101,235 | ||
| Calibration 3 | 101,398 | ||
| ssj_ops@calibrated=101,317 | |||
| 100% | 99.2% | 101,317 | 100,492 |
| 90% | 88.9% | 91,185 | 90,069 |
| 80% | 80.2% | 81,053 | 81,255 |
| 70% | 70.7% | 70,922 | 71,615 |
| 60% | 60.1% | 60,790 | 60,911 |
| 50% | 49.9% | 50,658 | 50,560 |
| 40% | 39.3% | 40,527 | 39,862 |
| 30% | 29.8% | 30,395 | 30,217 |
| 20% | 19.9% | 20,263 | 20,133 |
| 10% | 10.0% | 10,132 | 10,098 |
| Active Idle | 0 | 0 | |

| Target Load | Actual Load | ssj_ops | |
|---|---|---|---|
| Target | Actual | ||
| Calibration 1 | 102,909 | ||
| Calibration 2 | 102,830 | ||
| Calibration 3 | 103,036 | ||
| ssj_ops@calibrated=102,933 | |||
| 100% | 99.3% | 102,933 | 102,234 |
| 90% | 90.8% | 92,639 | 93,460 |
| 80% | 80.9% | 82,346 | 83,233 |
| 70% | 70.4% | 72,053 | 72,471 |
| 60% | 59.6% | 61,760 | 61,399 |
| 50% | 49.8% | 51,466 | 51,298 |
| 40% | 40.0% | 41,173 | 41,139 |
| 30% | 29.7% | 30,880 | 30,599 |
| 20% | 20.3% | 20,587 | 20,904 |
| 10% | 9.8% | 10,293 | 10,058 |
| Active Idle | 0 | 0 | |

| Target Load | Actual Load | ssj_ops | |
|---|---|---|---|
| Target | Actual | ||
| Calibration 1 | 105,073 | ||
| Calibration 2 | 104,136 | ||
| Calibration 3 | 104,529 | ||
| ssj_ops@calibrated=104,333 | |||
| 100% | 99.4% | 104,333 | 103,734 |
| 90% | 89.9% | 93,899 | 93,825 |
| 80% | 79.6% | 83,466 | 83,058 |
| 70% | 70.6% | 73,033 | 73,700 |
| 60% | 59.9% | 62,600 | 62,455 |
| 50% | 49.5% | 52,166 | 51,615 |
| 40% | 39.7% | 41,733 | 41,379 |
| 30% | 29.9% | 31,300 | 31,236 |
| 20% | 19.9% | 20,867 | 20,783 |
| 10% | 9.8% | 10,433 | 10,258 |
| Active Idle | 0 | 0 | |

| Target Load | Actual Load | ssj_ops | |
|---|---|---|---|
| Target | Actual | ||
| Calibration 1 | 89,619 | ||
| Calibration 2 | 91,312 | ||
| Calibration 3 | 91,761 | ||
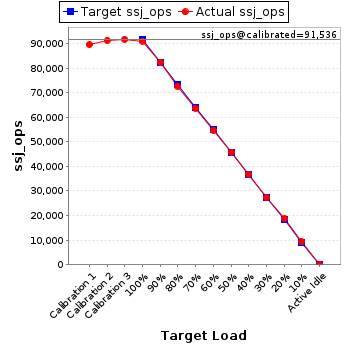
| ssj_ops@calibrated=91,536 | |||
| 100% | 99.4% | 91,536 | 90,995 |
| 90% | 90.0% | 82,383 | 82,426 |
| 80% | 79.4% | 73,229 | 72,635 |
| 70% | 69.7% | 64,075 | 63,765 |
| 60% | 59.8% | 54,922 | 54,768 |
| 50% | 49.9% | 45,768 | 45,690 |
| 40% | 40.2% | 36,615 | 36,824 |
| 30% | 29.8% | 27,461 | 27,247 |
| 20% | 20.5% | 18,307 | 18,748 |
| 10% | 10.2% | 9,154 | 9,306 |
| Active Idle | 0 | 0 | |
| Target Load | Actual Load | ssj_ops | |
|---|---|---|---|
| Target | Actual | ||
| Calibration 1 | 102,683 | ||
| Calibration 2 | 102,393 | ||
| Calibration 3 | 102,679 | ||
| ssj_ops@calibrated=102,536 | |||
| 100% | 98.8% | 102,536 | 101,293 |
| 90% | 89.9% | 92,283 | 92,156 |
| 80% | 80.6% | 82,029 | 82,623 |
| 70% | 69.3% | 71,775 | 71,091 |
| 60% | 58.7% | 61,522 | 60,224 |
| 50% | 49.5% | 51,268 | 50,796 |
| 40% | 40.2% | 41,014 | 41,181 |
| 30% | 29.5% | 30,761 | 30,273 |
| 20% | 20.1% | 20,507 | 20,631 |
| 10% | 9.8% | 10,254 | 10,017 |
| Active Idle | 0 | 0 | |

| Target Load | Actual Load | ssj_ops | |
|---|---|---|---|
| Target | Actual | ||
| Calibration 1 | 104,535 | ||
| Calibration 2 | 104,631 | ||
| Calibration 3 | 105,245 | ||
| ssj_ops@calibrated=104,938 | |||
| 100% | 99.4% | 104,938 | 104,285 |
| 90% | 89.7% | 94,445 | 94,085 |
| 80% | 80.1% | 83,951 | 84,050 |
| 70% | 70.0% | 73,457 | 73,500 |
| 60% | 59.8% | 62,963 | 62,720 |
| 50% | 49.9% | 52,469 | 52,371 |
| 40% | 41.0% | 41,975 | 43,058 |
| 30% | 29.7% | 31,482 | 31,176 |
| 20% | 20.2% | 20,988 | 21,192 |
| 10% | 10.7% | 10,494 | 11,179 |
| Active Idle | 0 | 0 | |

| Target Load | Actual Load | ssj_ops | |
|---|---|---|---|
| Target | Actual | ||
| Calibration 1 | 90,610 | ||
| Calibration 2 | 95,364 | ||
| Calibration 3 | 95,958 | ||
| ssj_ops@calibrated=95,661 | |||
| 100% | 97.5% | 95,661 | 93,247 |
| 90% | 89.6% | 86,095 | 85,709 |
| 80% | 78.8% | 76,529 | 75,369 |
| 70% | 70.6% | 66,962 | 67,520 |
| 60% | 59.2% | 57,396 | 56,595 |
| 50% | 48.6% | 47,830 | 46,507 |
| 40% | 40.3% | 38,264 | 38,579 |
| 30% | 30.1% | 28,698 | 28,800 |
| 20% | 20.1% | 19,132 | 19,209 |
| 10% | 9.8% | 9,566 | 9,383 |
| Active Idle | 0 | 0 | |

| Target Load | Actual Load | ssj_ops | |
|---|---|---|---|
| Target | Actual | ||
| Calibration 1 | 103,164 | ||
| Calibration 2 | 101,721 | ||
| Calibration 3 | 102,075 | ||
| ssj_ops@calibrated=101,898 | |||
| 100% | 99.3% | 101,898 | 101,139 |
| 90% | 90.2% | 91,708 | 91,913 |
| 80% | 80.4% | 81,518 | 81,885 |
| 70% | 70.4% | 71,329 | 71,735 |
| 60% | 60.5% | 61,139 | 61,641 |
| 50% | 49.9% | 50,949 | 50,863 |
| 40% | 39.7% | 40,759 | 40,489 |
| 30% | 30.2% | 30,569 | 30,792 |
| 20% | 19.6% | 20,380 | 19,982 |
| 10% | 10.2% | 10,190 | 10,400 |
| Active Idle | 0 | 0 | |

| Target Load | Actual Load | ssj_ops | |
|---|---|---|---|
| Target | Actual | ||
| Calibration 1 | 104,376 | ||
| Calibration 2 | 104,166 | ||
| Calibration 3 | 104,504 | ||
| ssj_ops@calibrated=104,335 | |||
| 100% | 99.4% | 104,335 | 103,680 |
| 90% | 90.4% | 93,901 | 94,334 |
| 80% | 79.2% | 83,468 | 82,647 |
| 70% | 69.5% | 73,034 | 72,562 |
| 60% | 59.8% | 62,601 | 62,409 |
| 50% | 48.9% | 52,167 | 51,065 |
| 40% | 40.2% | 41,734 | 41,919 |
| 30% | 29.7% | 31,300 | 30,975 |
| 20% | 19.7% | 20,867 | 20,587 |
| 10% | 10.4% | 10,433 | 10,846 |
| Active Idle | 0 | 0 | |

| Target Load | Actual Load | ssj_ops | |
|---|---|---|---|
| Target | Actual | ||
| Calibration 1 | 96,247 | ||
| Calibration 2 | 94,880 | ||
| Calibration 3 | 95,025 | ||
| ssj_ops@calibrated=94,953 | |||
| 100% | 99.5% | 94,953 | 94,488 |
| 90% | 89.5% | 85,457 | 84,975 |
| 80% | 79.2% | 75,962 | 75,174 |
| 70% | 70.9% | 66,467 | 67,284 |
| 60% | 60.2% | 56,972 | 57,167 |
| 50% | 49.6% | 47,476 | 47,079 |
| 40% | 40.7% | 37,981 | 38,629 |
| 30% | 31.1% | 28,486 | 29,537 |
| 20% | 20.1% | 18,991 | 19,054 |
| 10% | 10.1% | 9,495 | 9,621 |
| Active Idle | 0 | 0 | |

| Target Load | Actual Load | ssj_ops | |
|---|---|---|---|
| Target | Actual | ||
| Calibration 1 | 101,854 | ||
| Calibration 2 | 101,248 | ||
| Calibration 3 | 101,461 | ||
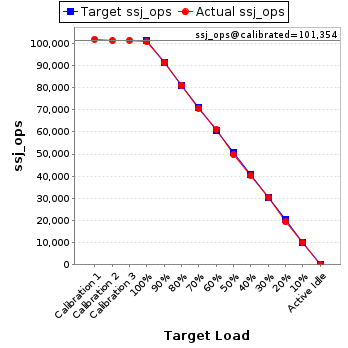
| ssj_ops@calibrated=101,354 | |||
| 100% | 99.4% | 101,354 | 100,756 |
| 90% | 90.0% | 91,219 | 91,185 |
| 80% | 80.0% | 81,083 | 81,127 |
| 70% | 69.8% | 70,948 | 70,738 |
| 60% | 60.2% | 60,813 | 61,029 |
| 50% | 49.1% | 50,677 | 49,734 |
| 40% | 39.8% | 40,542 | 40,377 |
| 30% | 30.1% | 30,406 | 30,500 |
| 20% | 19.1% | 20,271 | 19,337 |
| 10% | 9.9% | 10,135 | 9,986 |
| Active Idle | 0 | 0 | |
| Target Load | Actual Load | ssj_ops | |
|---|---|---|---|
| Target | Actual | ||
| Calibration 1 | 93,038 | ||
| Calibration 2 | 92,393 | ||
| Calibration 3 | 92,704 | ||
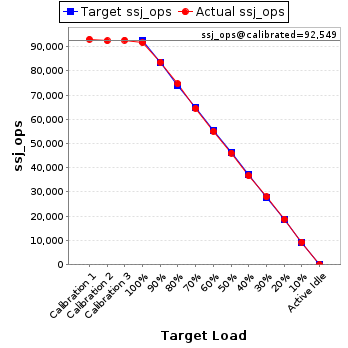
| ssj_ops@calibrated=92,549 | |||
| 100% | 99.0% | 92,549 | 91,631 |
| 90% | 90.3% | 83,294 | 83,599 |
| 80% | 80.6% | 74,039 | 74,626 |
| 70% | 69.7% | 64,784 | 64,489 |
| 60% | 59.4% | 55,529 | 55,002 |
| 50% | 49.8% | 46,274 | 46,057 |
| 40% | 39.6% | 37,019 | 36,679 |
| 30% | 30.2% | 27,765 | 27,937 |
| 20% | 20.3% | 18,510 | 18,804 |
| 10% | 10.1% | 9,255 | 9,333 |
| Active Idle | 0 | 0 | |
| Target Load | Actual Load | ssj_ops | |
|---|---|---|---|
| Target | Actual | ||
| Calibration 1 | 105,927 | ||
| Calibration 2 | 104,647 | ||
| Calibration 3 | 104,807 | ||
| ssj_ops@calibrated=104,727 | |||
| 100% | 99.2% | 104,727 | 103,937 |
| 90% | 90.5% | 94,255 | 94,783 |
| 80% | 80.8% | 83,782 | 84,628 |
| 70% | 69.6% | 73,309 | 72,867 |
| 60% | 60.0% | 62,836 | 62,814 |
| 50% | 50.7% | 52,364 | 53,056 |
| 40% | 39.9% | 41,891 | 41,825 |
| 30% | 30.3% | 31,418 | 31,681 |
| 20% | 19.7% | 20,945 | 20,596 |
| 10% | 10.1% | 10,473 | 10,550 |
| Active Idle | 0 | 0 | |

| Target Load | Actual Load | ssj_ops | |
|---|---|---|---|
| Target | Actual | ||
| Calibration 1 | 102,509 | ||
| Calibration 2 | 102,765 | ||
| Calibration 3 | 103,257 | ||
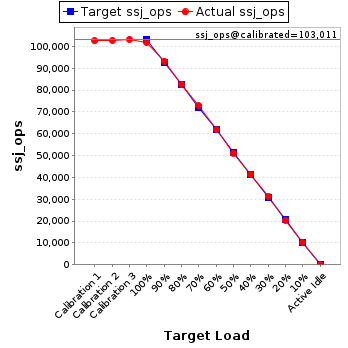
| ssj_ops@calibrated=103,011 | |||
| 100% | 98.8% | 103,011 | 101,728 |
| 90% | 90.5% | 92,710 | 93,236 |
| 80% | 80.3% | 82,409 | 82,677 |
| 70% | 70.7% | 72,108 | 72,802 |
| 60% | 60.1% | 61,806 | 61,909 |
| 50% | 49.6% | 51,505 | 51,128 |
| 40% | 40.1% | 41,204 | 41,265 |
| 30% | 30.4% | 30,903 | 31,279 |
| 20% | 19.8% | 20,602 | 20,346 |
| 10% | 9.9% | 10,301 | 10,171 |
| Active Idle | 0 | 0 | |
| Target Load | Actual Load | ssj_ops | |
|---|---|---|---|
| Target | Actual | ||
| Calibration 1 | 101,089 | ||
| Calibration 2 | 100,123 | ||
| Calibration 3 | 100,377 | ||
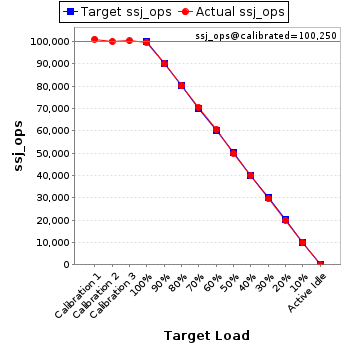
| ssj_ops@calibrated=100,250 | |||
| 100% | 99.4% | 100,250 | 99,676 |
| 90% | 89.8% | 90,225 | 90,037 |
| 80% | 79.9% | 80,200 | 80,133 |
| 70% | 70.2% | 70,175 | 70,402 |
| 60% | 60.4% | 60,150 | 60,543 |
| 50% | 49.8% | 50,125 | 49,937 |
| 40% | 39.9% | 40,100 | 40,034 |
| 30% | 29.6% | 30,075 | 29,687 |
| 20% | 19.9% | 20,050 | 19,987 |
| 10% | 9.9% | 10,025 | 9,884 |
| Active Idle | 0 | 0 | |
| Target Load | Actual Load | ssj_ops | |
|---|---|---|---|
| Target | Actual | ||
| Calibration 1 | 105,633 | ||
| Calibration 2 | 104,234 | ||
| Calibration 3 | 104,868 | ||
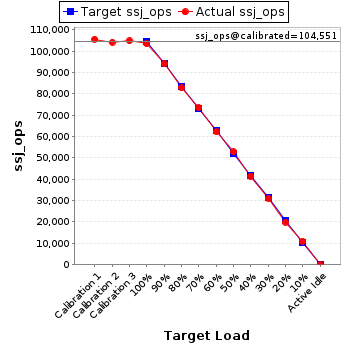
| ssj_ops@calibrated=104,551 | |||
| 100% | 99.0% | 104,551 | 103,540 |
| 90% | 90.0% | 94,096 | 94,069 |
| 80% | 79.2% | 83,641 | 82,805 |
| 70% | 70.4% | 73,186 | 73,592 |
| 60% | 59.6% | 62,731 | 62,299 |
| 50% | 50.5% | 52,276 | 52,809 |
| 40% | 39.7% | 41,820 | 41,533 |
| 30% | 29.8% | 31,365 | 31,151 |
| 20% | 19.1% | 20,910 | 19,983 |
| 10% | 10.4% | 10,455 | 10,892 |
| Active Idle | 0 | 0 | |
| Target Load | Actual Load | ssj_ops | |
|---|---|---|---|
| Target | Actual | ||
| Calibration 1 | 99,324 | ||
| Calibration 2 | 98,681 | ||
| Calibration 3 | 99,090 | ||
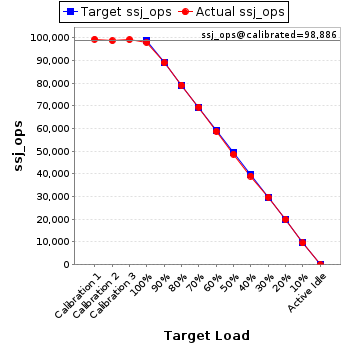
| ssj_ops@calibrated=98,886 | |||
| 100% | 99.0% | 98,886 | 97,872 |
| 90% | 89.9% | 88,997 | 88,910 |
| 80% | 80.0% | 79,108 | 79,119 |
| 70% | 70.2% | 69,220 | 69,425 |
| 60% | 59.3% | 59,331 | 58,681 |
| 50% | 49.3% | 49,443 | 48,708 |
| 40% | 39.5% | 39,554 | 39,057 |
| 30% | 30.1% | 29,666 | 29,758 |
| 20% | 20.2% | 19,777 | 19,970 |
| 10% | 9.7% | 9,889 | 9,558 |
| Active Idle | 0 | 0 | |
| Target Load | Actual Load | ssj_ops | |
|---|---|---|---|
| Target | Actual | ||
| Calibration 1 | 102,330 | ||
| Calibration 2 | 102,269 | ||
| Calibration 3 | 102,366 | ||
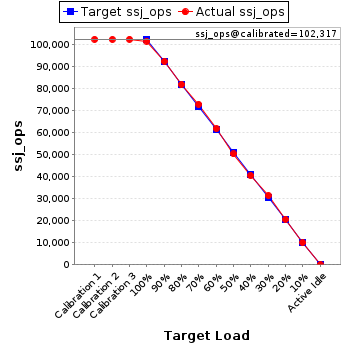
| ssj_ops@calibrated=102,317 | |||
| 100% | 99.2% | 102,317 | 101,454 |
| 90% | 90.2% | 92,086 | 92,329 |
| 80% | 79.9% | 81,854 | 81,781 |
| 70% | 71.2% | 71,622 | 72,822 |
| 60% | 60.4% | 61,390 | 61,787 |
| 50% | 49.1% | 51,159 | 50,254 |
| 40% | 39.5% | 40,927 | 40,408 |
| 30% | 30.7% | 30,695 | 31,416 |
| 20% | 20.2% | 20,463 | 20,629 |
| 10% | 9.8% | 10,232 | 10,062 |
| Active Idle | 0 | 0 | |
| Target Load | Actual Load | ssj_ops | |
|---|---|---|---|
| Target | Actual | ||
| Calibration 1 | 105,679 | ||
| Calibration 2 | 104,094 | ||
| Calibration 3 | 104,422 | ||
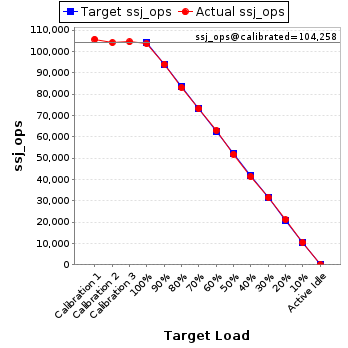
| ssj_ops@calibrated=104,258 | |||
| 100% | 99.4% | 104,258 | 103,588 |
| 90% | 90.1% | 93,832 | 93,966 |
| 80% | 79.6% | 83,406 | 83,019 |
| 70% | 70.2% | 72,981 | 73,142 |
| 60% | 60.4% | 62,555 | 62,923 |
| 50% | 49.6% | 52,129 | 51,742 |
| 40% | 39.5% | 41,703 | 41,203 |
| 30% | 30.2% | 31,277 | 31,468 |
| 20% | 20.2% | 20,852 | 21,109 |
| 10% | 10.0% | 10,426 | 10,455 |
| Active Idle | 0 | 0 | |
| Target Load | Actual Load | ssj_ops | |
|---|---|---|---|
| Target | Actual | ||
| Calibration 1 | 105,716 | ||
| Calibration 2 | 104,860 | ||
| Calibration 3 | 104,901 | ||
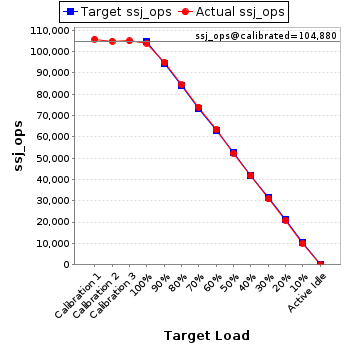
| ssj_ops@calibrated=104,880 | |||
| 100% | 99.1% | 104,880 | 103,915 |
| 90% | 90.5% | 94,392 | 94,963 |
| 80% | 80.4% | 83,904 | 84,359 |
| 70% | 70.5% | 73,416 | 73,900 |
| 60% | 60.4% | 62,928 | 63,298 |
| 50% | 49.8% | 52,440 | 52,202 |
| 40% | 39.7% | 41,952 | 41,679 |
| 30% | 29.4% | 31,464 | 30,865 |
| 20% | 19.9% | 20,976 | 20,887 |
| 10% | 9.7% | 10,488 | 10,129 |
| Active Idle | 0 | 0 | |
| Target Load | Actual Load | ssj_ops | |
|---|---|---|---|
| Target | Actual | ||
| Calibration 1 | 103,347 | ||
| Calibration 2 | 103,635 | ||
| Calibration 3 | 104,016 | ||
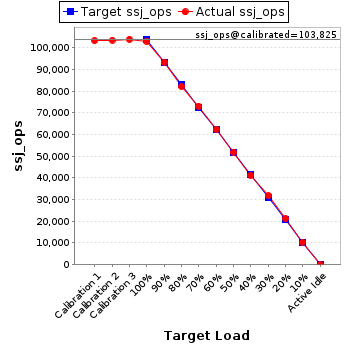
| ssj_ops@calibrated=103,825 | |||
| 100% | 99.3% | 103,825 | 103,101 |
| 90% | 90.1% | 93,443 | 93,507 |
| 80% | 79.3% | 83,060 | 82,308 |
| 70% | 70.4% | 72,678 | 73,136 |
| 60% | 60.2% | 62,295 | 62,551 |
| 50% | 50.1% | 51,913 | 51,970 |
| 40% | 39.8% | 41,530 | 41,289 |
| 30% | 30.6% | 31,148 | 31,787 |
| 20% | 20.5% | 20,765 | 21,283 |
| 10% | 10.0% | 10,383 | 10,396 |
| Active Idle | 0 | 0 | |
| Target Load | Actual Load | ssj_ops | |
|---|---|---|---|
| Target | Actual | ||
| Calibration 1 | 100,210 | ||
| Calibration 2 | 99,133 | ||
| Calibration 3 | 99,672 | ||
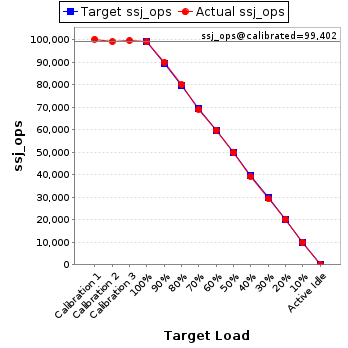
| ssj_ops@calibrated=99,402 | |||
| 100% | 99.6% | 99,402 | 98,990 |
| 90% | 90.5% | 89,462 | 89,958 |
| 80% | 80.5% | 79,522 | 79,974 |
| 70% | 69.5% | 69,582 | 69,046 |
| 60% | 60.2% | 59,641 | 59,853 |
| 50% | 50.1% | 49,701 | 49,821 |
| 40% | 39.5% | 39,761 | 39,242 |
| 30% | 29.5% | 29,821 | 29,337 |
| 20% | 20.3% | 19,880 | 20,130 |
| 10% | 10.0% | 9,940 | 9,933 |
| Active Idle | 0 | 0 | |
| Target Load | Actual Load | ssj_ops | |
|---|---|---|---|
| Target | Actual | ||
| Calibration 1 | 102,139 | ||
| Calibration 2 | 99,932 | ||
| Calibration 3 | 100,782 | ||
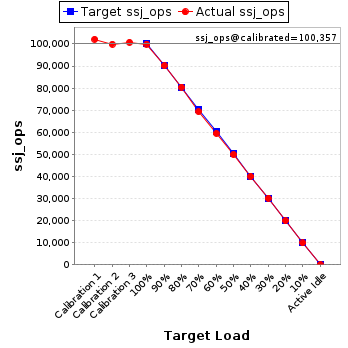
| ssj_ops@calibrated=100,357 | |||
| 100% | 99.6% | 100,357 | 99,970 |
| 90% | 89.8% | 90,321 | 90,150 |
| 80% | 80.2% | 80,286 | 80,485 |
| 70% | 69.1% | 70,250 | 69,346 |
| 60% | 59.3% | 60,214 | 59,499 |
| 50% | 49.7% | 50,178 | 49,901 |
| 40% | 39.9% | 40,143 | 40,013 |
| 30% | 30.0% | 30,107 | 30,150 |
| 20% | 19.8% | 20,071 | 19,864 |
| 10% | 9.8% | 10,036 | 9,854 |
| Active Idle | 0 | 0 | |
| Target Load | Actual Load | ssj_ops | |
|---|---|---|---|
| Target | Actual | ||
| Calibration 1 | 103,740 | ||
| Calibration 2 | 102,652 | ||
| Calibration 3 | 102,781 | ||
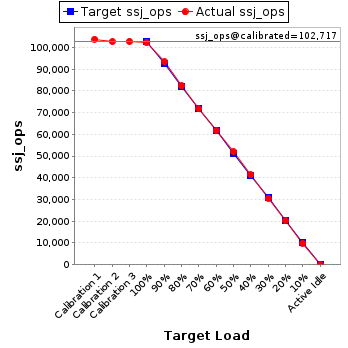
| ssj_ops@calibrated=102,717 | |||
| 100% | 99.5% | 102,717 | 102,188 |
| 90% | 90.9% | 92,445 | 93,371 |
| 80% | 80.1% | 82,173 | 82,243 |
| 70% | 69.8% | 71,902 | 71,691 |
| 60% | 60.1% | 61,630 | 61,701 |
| 50% | 50.5% | 51,358 | 51,910 |
| 40% | 40.3% | 41,087 | 41,381 |
| 30% | 29.8% | 30,815 | 30,578 |
| 20% | 19.7% | 20,543 | 20,258 |
| 10% | 9.7% | 10,272 | 9,912 |
| Active Idle | 0 | 0 | |
| Target Load | Actual Load | ssj_ops | |
|---|---|---|---|
| Target | Actual | ||
| Calibration 1 | 103,012 | ||
| Calibration 2 | 102,837 | ||
| Calibration 3 | 103,089 | ||
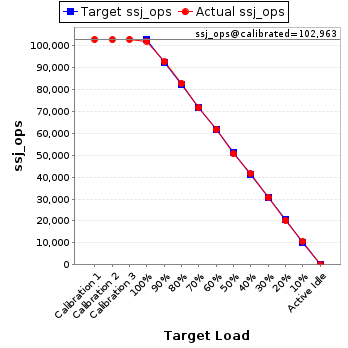
| ssj_ops@calibrated=102,963 | |||
| 100% | 99.3% | 102,963 | 102,260 |
| 90% | 90.1% | 92,667 | 92,786 |
| 80% | 80.6% | 82,371 | 83,001 |
| 70% | 69.7% | 72,074 | 71,742 |
| 60% | 60.1% | 61,778 | 61,879 |
| 50% | 49.2% | 51,482 | 50,655 |
| 40% | 40.4% | 41,185 | 41,604 |
| 30% | 29.8% | 30,889 | 30,696 |
| 20% | 19.8% | 20,593 | 20,341 |
| 10% | 10.4% | 10,296 | 10,675 |
| Active Idle | 0 | 0 | |
| Target Load | Actual Load | ssj_ops | |
|---|---|---|---|
| Target | Actual | ||
| Calibration 1 | 101,901 | ||
| Calibration 2 | 101,616 | ||
| Calibration 3 | 101,878 | ||
| ssj_ops@calibrated=101,747 | |||
| 100% | 98.4% | 101,747 | 100,153 |
| 90% | 89.7% | 91,573 | 91,282 |
| 80% | 80.4% | 81,398 | 81,830 |
| 70% | 69.9% | 71,223 | 71,158 |
| 60% | 59.6% | 61,048 | 60,593 |
| 50% | 50.6% | 50,874 | 51,474 |
| 40% | 39.7% | 40,699 | 40,442 |
| 30% | 29.9% | 30,524 | 30,383 |
| 20% | 19.8% | 20,349 | 20,183 |
| 10% | 9.9% | 10,175 | 10,033 |
| Active Idle | 0 | 0 | |

| Target Load | Actual Load | ssj_ops | |
|---|---|---|---|
| Target | Actual | ||
| Calibration 1 | 99,894 | ||
| Calibration 2 | 100,019 | ||
| Calibration 3 | 100,331 | ||
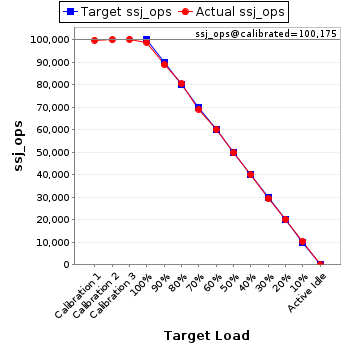
| ssj_ops@calibrated=100,175 | |||
| 100% | 98.8% | 100,175 | 99,016 |
| 90% | 88.9% | 90,157 | 89,022 |
| 80% | 80.5% | 80,140 | 80,623 |
| 70% | 69.1% | 70,122 | 69,236 |
| 60% | 60.1% | 60,105 | 60,217 |
| 50% | 49.6% | 50,087 | 49,714 |
| 40% | 39.9% | 40,070 | 40,001 |
| 30% | 29.4% | 30,052 | 29,412 |
| 20% | 20.1% | 20,035 | 20,133 |
| 10% | 10.3% | 10,017 | 10,292 |
| Active Idle | 0 | 0 | |