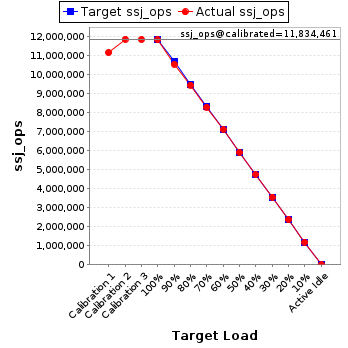
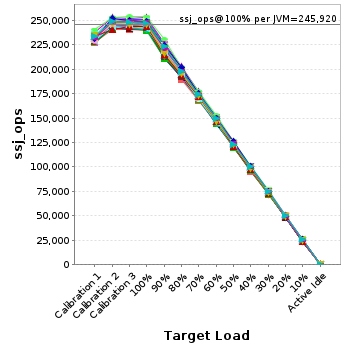
| Target Load |
Actual Load |
ssj_ops |
| Target |
Actual |
| Calibration 1 |
|
|
11,140,800 |
| Calibration 2 |
|
|
11,839,590 |
| Calibration 3 |
|
|
11,829,331 |
| ssj_ops@calibrated=11,834,461 |
| 100% |
99.7% |
11,834,461 |
11,804,168 |
| 90% |
89.0% |
10,651,015 |
10,532,898 |
| 80% |
79.7% |
9,467,569 |
9,433,502 |
| 70% |
70.0% |
8,284,122 |
8,280,679 |
| 60% |
60.0% |
7,100,676 |
7,100,647 |
| 50% |
49.9% |
5,917,230 |
5,908,875 |
| 40% |
40.1% |
4,733,784 |
4,739,762 |
| 30% |
30.0% |
3,550,338 |
3,551,252 |
| 20% |
20.0% |
2,366,892 |
2,367,884 |
| 10% |
10.0% |
1,183,446 |
1,183,978 |
| Active Idle |
|
0 |
0 |
| JVM Instance |
ssj_ops@100% |
| localhost.001 |
239,614 |
| localhost.002 |
248,074 |
| localhost.003 |
246,070 |
| localhost.004 |
250,954 |
| localhost.005 |
243,834 |
| localhost.006 |
242,462 |
| localhost.007 |
246,653 |
| localhost.008 |
244,819 |
| localhost.009 |
246,872 |
| localhost.010 |
242,021 |
| localhost.011 |
239,748 |
| localhost.012 |
241,927 |
| localhost.013 |
252,550 |
| localhost.014 |
240,811 |
| localhost.015 |
241,328 |
| localhost.016 |
246,929 |
| localhost.017 |
250,467 |
| localhost.018 |
246,577 |
| localhost.019 |
245,502 |
| localhost.020 |
246,305 |
| localhost.021 |
247,512 |
| localhost.022 |
245,991 |
| localhost.023 |
245,829 |
| localhost.024 |
243,907 |
| localhost.025 |
244,197 |
| localhost.026 |
244,449 |
| localhost.027 |
243,781 |
| localhost.028 |
247,425 |
| localhost.029 |
245,023 |
| localhost.030 |
243,288 |
| localhost.031 |
249,482 |
| localhost.032 |
245,369 |
| localhost.033 |
245,254 |
| localhost.034 |
248,063 |
| localhost.035 |
247,254 |
| localhost.036 |
248,166 |
| localhost.037 |
253,961 |
| localhost.038 |
248,593 |
| localhost.039 |
246,454 |
| localhost.040 |
241,986 |
| localhost.041 |
246,687 |
| localhost.042 |
246,257 |
| localhost.043 |
244,214 |
| localhost.044 |
248,572 |
| localhost.045 |
248,515 |
| localhost.046 |
245,737 |
| localhost.047 |
248,104 |
| localhost.048 |
246,582 |
| ssj_ops@100% |
11,804,168 |
| ssj_ops@100% per JVM |
245,920 |
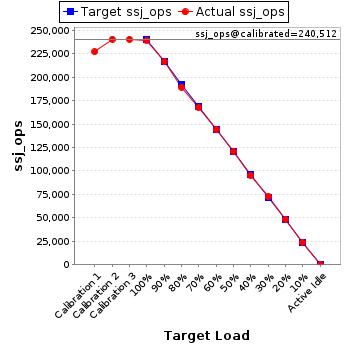
JVM 'localhost.001' Scores:
| Target Load |
Actual Load |
ssj_ops |
| Target |
Actual |
| Calibration 1 |
|
|
227,135 |
| Calibration 2 |
|
|
240,496 |
| Calibration 3 |
|
|
240,528 |
| ssj_ops@calibrated=240,512 |
| 100% |
99.6% |
240,512 |
239,614 |
| 90% |
90.2% |
216,461 |
216,887 |
| 80% |
78.8% |
192,409 |
189,425 |
| 70% |
69.9% |
168,358 |
168,048 |
| 60% |
60.1% |
144,307 |
144,492 |
| 50% |
50.4% |
120,256 |
121,131 |
| 40% |
39.7% |
96,205 |
95,447 |
| 30% |
30.2% |
72,154 |
72,640 |
| 20% |
20.1% |
48,102 |
48,421 |
| 10% |
10.0% |
24,051 |
23,962 |
| Active Idle |
|
0 |
0 |
JVM 'localhost.002' Scores:
| Target Load |
Actual Load |
ssj_ops |
| Target |
Actual |
| Calibration 1 |
|
|
229,882 |
| Calibration 2 |
|
|
248,047 |
| Calibration 3 |
|
|
247,443 |
| ssj_ops@calibrated=247,745 |
| 100% |
100.1% |
247,745 |
248,074 |
| 90% |
90.4% |
222,970 |
223,871 |
| 80% |
79.6% |
198,196 |
197,111 |
| 70% |
70.1% |
173,421 |
173,685 |
| 60% |
59.8% |
148,647 |
148,268 |
| 50% |
49.9% |
123,872 |
123,505 |
| 40% |
40.0% |
99,098 |
99,200 |
| 30% |
29.9% |
74,323 |
74,012 |
| 20% |
20.1% |
49,549 |
49,885 |
| 10% |
10.0% |
24,774 |
24,800 |
| Active Idle |
|
0 |
0 |
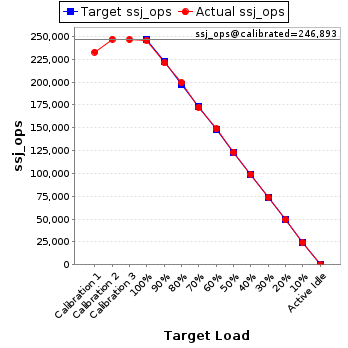
JVM 'localhost.003' Scores:
| Target Load |
Actual Load |
ssj_ops |
| Target |
Actual |
| Calibration 1 |
|
|
233,066 |
| Calibration 2 |
|
|
247,070 |
| Calibration 3 |
|
|
246,716 |
| ssj_ops@calibrated=246,893 |
| 100% |
99.7% |
246,893 |
246,070 |
| 90% |
89.7% |
222,204 |
221,370 |
| 80% |
80.7% |
197,515 |
199,347 |
| 70% |
69.9% |
172,825 |
172,653 |
| 60% |
60.2% |
148,136 |
148,706 |
| 50% |
50.0% |
123,447 |
123,447 |
| 40% |
40.0% |
98,757 |
98,844 |
| 30% |
30.0% |
74,068 |
74,007 |
| 20% |
20.0% |
49,379 |
49,278 |
| 10% |
9.7% |
24,689 |
23,931 |
| Active Idle |
|
0 |
0 |
JVM 'localhost.004' Scores:
| Target Load |
Actual Load |
ssj_ops |
| Target |
Actual |
| Calibration 1 |
|
|
235,249 |
| Calibration 2 |
|
|
249,940 |
| Calibration 3 |
|
|
250,064 |
| ssj_ops@calibrated=250,002 |
| 100% |
100.4% |
250,002 |
250,954 |
| 90% |
87.9% |
225,002 |
219,760 |
| 80% |
79.6% |
200,002 |
198,925 |
| 70% |
69.8% |
175,001 |
174,606 |
| 60% |
60.2% |
150,001 |
150,603 |
| 50% |
50.1% |
125,001 |
125,181 |
| 40% |
39.7% |
100,001 |
99,134 |
| 30% |
29.7% |
75,001 |
74,217 |
| 20% |
19.9% |
50,000 |
49,801 |
| 10% |
10.2% |
25,000 |
25,379 |
| Active Idle |
|
0 |
0 |
JVM 'localhost.005' Scores:
| Target Load |
Actual Load |
ssj_ops |
| Target |
Actual |
| Calibration 1 |
|
|
232,669 |
| Calibration 2 |
|
|
245,535 |
| Calibration 3 |
|
|
243,688 |
| ssj_ops@calibrated=244,611 |
| 100% |
99.7% |
244,611 |
243,834 |
| 90% |
89.4% |
220,150 |
218,657 |
| 80% |
79.8% |
195,689 |
195,183 |
| 70% |
70.1% |
171,228 |
171,379 |
| 60% |
60.0% |
146,767 |
146,807 |
| 50% |
49.8% |
122,306 |
121,773 |
| 40% |
39.6% |
97,845 |
96,952 |
| 30% |
30.1% |
73,383 |
73,584 |
| 20% |
20.1% |
48,922 |
49,210 |
| 10% |
9.9% |
24,461 |
24,303 |
| Active Idle |
|
0 |
0 |
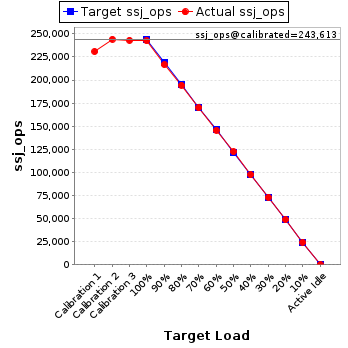
JVM 'localhost.006' Scores:
| Target Load |
Actual Load |
ssj_ops |
| Target |
Actual |
| Calibration 1 |
|
|
230,855 |
| Calibration 2 |
|
|
244,145 |
| Calibration 3 |
|
|
243,081 |
| ssj_ops@calibrated=243,613 |
| 100% |
99.5% |
243,613 |
242,462 |
| 90% |
88.9% |
219,252 |
216,640 |
| 80% |
79.8% |
194,891 |
194,326 |
| 70% |
69.8% |
170,529 |
170,002 |
| 60% |
59.7% |
146,168 |
145,531 |
| 50% |
50.2% |
121,807 |
122,295 |
| 40% |
39.9% |
97,445 |
97,307 |
| 30% |
29.9% |
73,084 |
72,944 |
| 20% |
20.0% |
48,723 |
48,764 |
| 10% |
10.0% |
24,361 |
24,389 |
| Active Idle |
|
0 |
0 |
JVM 'localhost.007' Scores:
| Target Load |
Actual Load |
ssj_ops |
| Target |
Actual |
| Calibration 1 |
|
|
233,544 |
| Calibration 2 |
|
|
245,948 |
| Calibration 3 |
|
|
246,109 |
| ssj_ops@calibrated=246,028 |
| 100% |
100.3% |
246,028 |
246,653 |
| 90% |
88.8% |
221,426 |
218,543 |
| 80% |
79.1% |
196,823 |
194,727 |
| 70% |
70.2% |
172,220 |
172,713 |
| 60% |
60.5% |
147,617 |
148,796 |
| 50% |
49.7% |
123,014 |
122,244 |
| 40% |
39.9% |
98,411 |
98,129 |
| 30% |
30.3% |
73,809 |
74,578 |
| 20% |
19.8% |
49,206 |
48,765 |
| 10% |
10.0% |
24,603 |
24,543 |
| Active Idle |
|
0 |
0 |
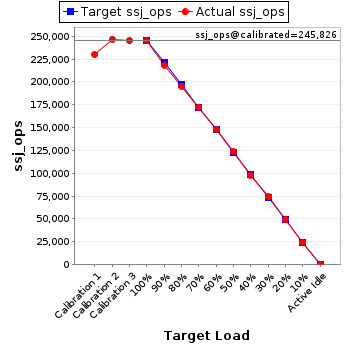
JVM 'localhost.008' Scores:
| Target Load |
Actual Load |
ssj_ops |
| Target |
Actual |
| Calibration 1 |
|
|
230,241 |
| Calibration 2 |
|
|
246,726 |
| Calibration 3 |
|
|
244,925 |
| ssj_ops@calibrated=245,826 |
| 100% |
99.6% |
245,826 |
244,819 |
| 90% |
88.9% |
221,243 |
218,491 |
| 80% |
79.5% |
196,661 |
195,501 |
| 70% |
70.1% |
172,078 |
172,426 |
| 60% |
60.2% |
147,495 |
148,054 |
| 50% |
50.3% |
122,913 |
123,678 |
| 40% |
39.8% |
98,330 |
97,958 |
| 30% |
30.3% |
73,748 |
74,545 |
| 20% |
20.0% |
49,165 |
49,254 |
| 10% |
10.0% |
24,583 |
24,671 |
| Active Idle |
|
0 |
0 |
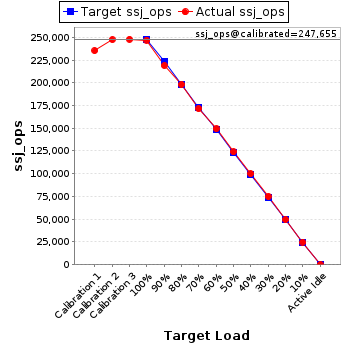
JVM 'localhost.009' Scores:
| Target Load |
Actual Load |
ssj_ops |
| Target |
Actual |
| Calibration 1 |
|
|
235,338 |
| Calibration 2 |
|
|
247,430 |
| Calibration 3 |
|
|
247,880 |
| ssj_ops@calibrated=247,655 |
| 100% |
99.7% |
247,655 |
246,872 |
| 90% |
88.4% |
222,890 |
218,906 |
| 80% |
80.0% |
198,124 |
198,054 |
| 70% |
69.3% |
173,359 |
171,563 |
| 60% |
60.3% |
148,593 |
149,428 |
| 50% |
50.0% |
123,828 |
123,920 |
| 40% |
40.4% |
99,062 |
99,938 |
| 30% |
30.3% |
74,297 |
74,986 |
| 20% |
20.0% |
49,531 |
49,540 |
| 10% |
10.0% |
24,766 |
24,887 |
| Active Idle |
|
0 |
0 |
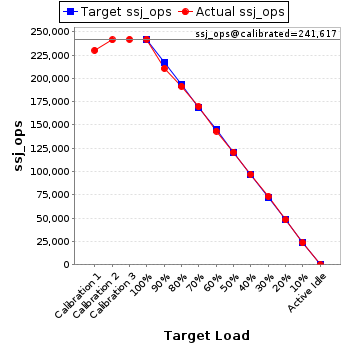
JVM 'localhost.010' Scores:
| Target Load |
Actual Load |
ssj_ops |
| Target |
Actual |
| Calibration 1 |
|
|
230,007 |
| Calibration 2 |
|
|
241,315 |
| Calibration 3 |
|
|
241,919 |
| ssj_ops@calibrated=241,617 |
| 100% |
100.2% |
241,617 |
242,021 |
| 90% |
87.2% |
217,455 |
210,689 |
| 80% |
79.2% |
193,294 |
191,410 |
| 70% |
70.2% |
169,132 |
169,638 |
| 60% |
59.4% |
144,970 |
143,456 |
| 50% |
50.0% |
120,809 |
120,882 |
| 40% |
40.1% |
96,647 |
96,890 |
| 30% |
30.3% |
72,485 |
73,240 |
| 20% |
19.9% |
48,323 |
48,096 |
| 10% |
9.8% |
24,162 |
23,634 |
| Active Idle |
|
0 |
0 |
JVM 'localhost.011' Scores:
| Target Load |
Actual Load |
ssj_ops |
| Target |
Actual |
| Calibration 1 |
|
|
228,035 |
| Calibration 2 |
|
|
241,518 |
| Calibration 3 |
|
|
241,807 |
| ssj_ops@calibrated=241,663 |
| 100% |
99.2% |
241,663 |
239,748 |
| 90% |
87.3% |
217,496 |
210,977 |
| 80% |
79.8% |
193,330 |
192,805 |
| 70% |
70.1% |
169,164 |
169,307 |
| 60% |
59.8% |
144,998 |
144,568 |
| 50% |
49.6% |
120,831 |
119,880 |
| 40% |
39.9% |
96,665 |
96,530 |
| 30% |
29.8% |
72,499 |
72,091 |
| 20% |
20.1% |
48,333 |
48,508 |
| 10% |
9.9% |
24,166 |
23,912 |
| Active Idle |
|
0 |
0 |
JVM 'localhost.012' Scores:
| Target Load |
Actual Load |
ssj_ops |
| Target |
Actual |
| Calibration 1 |
|
|
231,087 |
| Calibration 2 |
|
|
244,612 |
| Calibration 3 |
|
|
243,922 |
| ssj_ops@calibrated=244,267 |
| 100% |
99.0% |
244,267 |
241,927 |
| 90% |
89.9% |
219,840 |
219,659 |
| 80% |
79.7% |
195,414 |
194,721 |
| 70% |
70.3% |
170,987 |
171,716 |
| 60% |
60.5% |
146,560 |
147,715 |
| 50% |
50.0% |
122,133 |
122,241 |
| 40% |
40.1% |
97,707 |
97,920 |
| 30% |
29.9% |
73,280 |
73,003 |
| 20% |
19.9% |
48,853 |
48,588 |
| 10% |
10.0% |
24,427 |
24,458 |
| Active Idle |
|
0 |
0 |
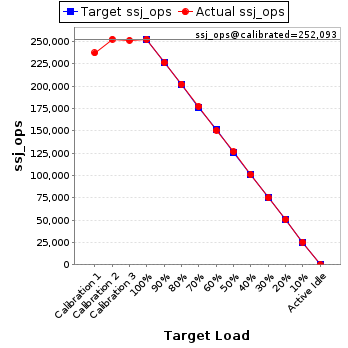
JVM 'localhost.013' Scores:
| Target Load |
Actual Load |
ssj_ops |
| Target |
Actual |
| Calibration 1 |
|
|
237,274 |
| Calibration 2 |
|
|
252,698 |
| Calibration 3 |
|
|
251,487 |
| ssj_ops@calibrated=252,093 |
| 100% |
100.2% |
252,093 |
252,550 |
| 90% |
89.9% |
226,883 |
226,558 |
| 80% |
80.3% |
201,674 |
202,366 |
| 70% |
70.4% |
176,465 |
177,354 |
| 60% |
59.7% |
151,256 |
150,581 |
| 50% |
50.1% |
126,046 |
126,424 |
| 40% |
40.0% |
100,837 |
100,760 |
| 30% |
29.7% |
75,628 |
74,973 |
| 20% |
20.0% |
50,419 |
50,542 |
| 10% |
10.1% |
25,209 |
25,362 |
| Active Idle |
|
0 |
0 |
JVM 'localhost.014' Scores:
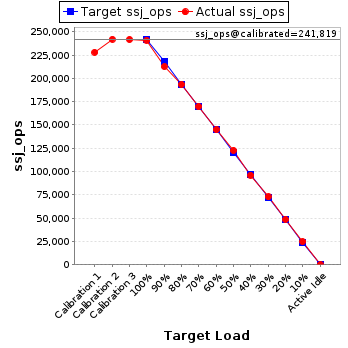
| Target Load |
Actual Load |
ssj_ops |
| Target |
Actual |
| Calibration 1 |
|
|
227,930 |
| Calibration 2 |
|
|
241,972 |
| Calibration 3 |
|
|
241,667 |
| ssj_ops@calibrated=241,819 |
| 100% |
99.6% |
241,819 |
240,811 |
| 90% |
87.9% |
217,637 |
212,594 |
| 80% |
80.0% |
193,455 |
193,423 |
| 70% |
70.2% |
169,273 |
169,732 |
| 60% |
59.9% |
145,092 |
144,962 |
| 50% |
50.7% |
120,910 |
122,691 |
| 40% |
39.7% |
96,728 |
95,901 |
| 30% |
30.1% |
72,546 |
72,817 |
| 20% |
20.1% |
48,364 |
48,662 |
| 10% |
10.2% |
24,182 |
24,746 |
| Active Idle |
|
0 |
0 |
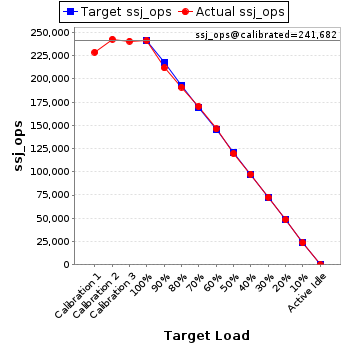
JVM 'localhost.015' Scores:
| Target Load |
Actual Load |
ssj_ops |
| Target |
Actual |
| Calibration 1 |
|
|
228,664 |
| Calibration 2 |
|
|
242,682 |
| Calibration 3 |
|
|
240,682 |
| ssj_ops@calibrated=241,682 |
| 100% |
99.9% |
241,682 |
241,328 |
| 90% |
87.6% |
217,514 |
211,768 |
| 80% |
79.1% |
193,346 |
191,222 |
| 70% |
70.5% |
169,178 |
170,394 |
| 60% |
60.4% |
145,009 |
146,053 |
| 50% |
49.4% |
120,841 |
119,498 |
| 40% |
40.3% |
96,673 |
97,388 |
| 30% |
30.1% |
72,505 |
72,674 |
| 20% |
20.0% |
48,336 |
48,413 |
| 10% |
9.8% |
24,168 |
23,603 |
| Active Idle |
|
0 |
0 |
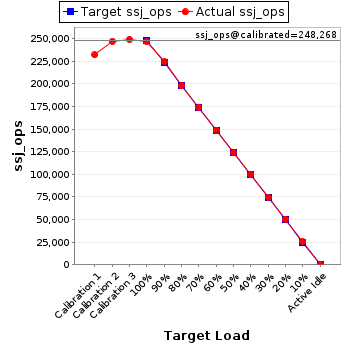
JVM 'localhost.016' Scores:
| Target Load |
Actual Load |
ssj_ops |
| Target |
Actual |
| Calibration 1 |
|
|
232,095 |
| Calibration 2 |
|
|
247,092 |
| Calibration 3 |
|
|
249,443 |
| ssj_ops@calibrated=248,268 |
| 100% |
99.5% |
248,268 |
246,929 |
| 90% |
90.4% |
223,441 |
224,548 |
| 80% |
79.6% |
198,614 |
197,732 |
| 70% |
70.2% |
173,787 |
174,302 |
| 60% |
60.0% |
148,961 |
149,013 |
| 50% |
49.9% |
124,134 |
123,833 |
| 40% |
40.4% |
99,307 |
100,301 |
| 30% |
30.2% |
74,480 |
74,854 |
| 20% |
20.3% |
49,654 |
50,439 |
| 10% |
10.1% |
24,827 |
25,142 |
| Active Idle |
|
0 |
0 |
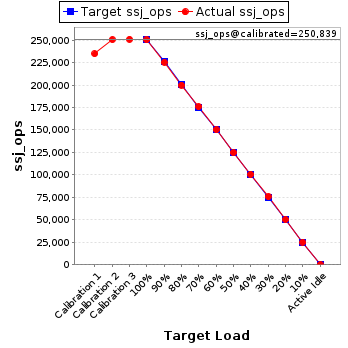
JVM 'localhost.017' Scores:
| Target Load |
Actual Load |
ssj_ops |
| Target |
Actual |
| Calibration 1 |
|
|
234,849 |
| Calibration 2 |
|
|
250,613 |
| Calibration 3 |
|
|
251,066 |
| ssj_ops@calibrated=250,839 |
| 100% |
99.9% |
250,839 |
250,467 |
| 90% |
89.9% |
225,755 |
225,454 |
| 80% |
79.7% |
200,672 |
200,036 |
| 70% |
70.2% |
175,588 |
175,990 |
| 60% |
59.9% |
150,504 |
150,324 |
| 50% |
49.8% |
125,420 |
124,819 |
| 40% |
40.1% |
100,336 |
100,558 |
| 30% |
30.2% |
75,252 |
75,806 |
| 20% |
20.0% |
50,168 |
50,237 |
| 10% |
10.0% |
25,084 |
25,158 |
| Active Idle |
|
0 |
0 |
JVM 'localhost.018' Scores:
| Target Load |
Actual Load |
ssj_ops |
| Target |
Actual |
| Calibration 1 |
|
|
233,763 |
| Calibration 2 |
|
|
246,404 |
| Calibration 3 |
|
|
247,027 |
| ssj_ops@calibrated=246,715 |
| 100% |
99.9% |
246,715 |
246,577 |
| 90% |
88.9% |
222,044 |
219,213 |
| 80% |
79.4% |
197,372 |
195,871 |
| 70% |
70.3% |
172,701 |
173,492 |
| 60% |
60.3% |
148,029 |
148,740 |
| 50% |
50.4% |
123,358 |
124,336 |
| 40% |
40.0% |
98,686 |
98,779 |
| 30% |
30.5% |
74,015 |
75,197 |
| 20% |
20.2% |
49,343 |
49,733 |
| 10% |
10.1% |
24,672 |
24,875 |
| Active Idle |
|
0 |
0 |
JVM 'localhost.019' Scores:
| Target Load |
Actual Load |
ssj_ops |
| Target |
Actual |
| Calibration 1 |
|
|
232,182 |
| Calibration 2 |
|
|
246,953 |
| Calibration 3 |
|
|
247,124 |
| ssj_ops@calibrated=247,038 |
| 100% |
99.4% |
247,038 |
245,502 |
| 90% |
88.6% |
222,334 |
218,801 |
| 80% |
79.9% |
197,631 |
197,370 |
| 70% |
69.4% |
172,927 |
171,343 |
| 60% |
60.0% |
148,223 |
148,248 |
| 50% |
50.2% |
123,519 |
124,081 |
| 40% |
40.0% |
98,815 |
98,729 |
| 30% |
29.8% |
74,111 |
73,715 |
| 20% |
19.9% |
49,408 |
49,217 |
| 10% |
9.9% |
24,704 |
24,533 |
| Active Idle |
|
0 |
0 |
JVM 'localhost.020' Scores:
| Target Load |
Actual Load |
ssj_ops |
| Target |
Actual |
| Calibration 1 |
|
|
233,163 |
| Calibration 2 |
|
|
248,122 |
| Calibration 3 |
|
|
248,907 |
| ssj_ops@calibrated=248,515 |
| 100% |
99.1% |
248,515 |
246,305 |
| 90% |
90.8% |
223,663 |
225,601 |
| 80% |
80.4% |
198,812 |
199,789 |
| 70% |
69.4% |
173,960 |
172,404 |
| 60% |
60.7% |
149,109 |
150,914 |
| 50% |
49.7% |
124,257 |
123,456 |
| 40% |
39.9% |
99,406 |
99,232 |
| 30% |
30.0% |
74,554 |
74,510 |
| 20% |
19.9% |
49,703 |
49,458 |
| 10% |
10.2% |
24,851 |
25,254 |
| Active Idle |
|
0 |
0 |
JVM 'localhost.021' Scores:
| Target Load |
Actual Load |
ssj_ops |
| Target |
Actual |
| Calibration 1 |
|
|
235,423 |
| Calibration 2 |
|
|
248,988 |
| Calibration 3 |
|
|
247,273 |
| ssj_ops@calibrated=248,130 |
| 100% |
99.8% |
248,130 |
247,512 |
| 90% |
88.2% |
223,317 |
218,794 |
| 80% |
80.6% |
198,504 |
200,073 |
| 70% |
69.5% |
173,691 |
172,415 |
| 60% |
59.7% |
148,878 |
148,049 |
| 50% |
49.5% |
124,065 |
122,935 |
| 40% |
40.2% |
99,252 |
99,815 |
| 30% |
29.7% |
74,439 |
73,614 |
| 20% |
19.7% |
49,626 |
48,988 |
| 10% |
9.9% |
24,813 |
24,562 |
| Active Idle |
|
0 |
0 |
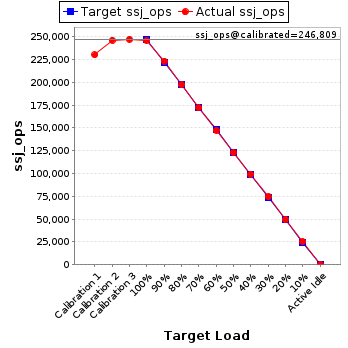
JVM 'localhost.022' Scores:
| Target Load |
Actual Load |
ssj_ops |
| Target |
Actual |
| Calibration 1 |
|
|
230,098 |
| Calibration 2 |
|
|
246,306 |
| Calibration 3 |
|
|
247,312 |
| ssj_ops@calibrated=246,809 |
| 100% |
99.7% |
246,809 |
245,991 |
| 90% |
90.5% |
222,128 |
223,401 |
| 80% |
79.9% |
197,447 |
197,207 |
| 70% |
69.7% |
172,766 |
172,016 |
| 60% |
59.7% |
148,085 |
147,299 |
| 50% |
49.7% |
123,404 |
122,693 |
| 40% |
40.2% |
98,724 |
99,279 |
| 30% |
30.2% |
74,043 |
74,577 |
| 20% |
20.1% |
49,362 |
49,635 |
| 10% |
10.2% |
24,681 |
25,258 |
| Active Idle |
|
0 |
0 |
JVM 'localhost.023' Scores:
| Target Load |
Actual Load |
ssj_ops |
| Target |
Actual |
| Calibration 1 |
|
|
228,252 |
| Calibration 2 |
|
|
245,898 |
| Calibration 3 |
|
|
242,202 |
| ssj_ops@calibrated=244,050 |
| 100% |
100.7% |
244,050 |
245,829 |
| 90% |
88.9% |
219,645 |
217,024 |
| 80% |
79.7% |
195,240 |
194,542 |
| 70% |
70.4% |
170,835 |
171,816 |
| 60% |
59.9% |
146,430 |
146,248 |
| 50% |
50.2% |
122,025 |
122,498 |
| 40% |
39.8% |
97,620 |
97,059 |
| 30% |
30.2% |
73,215 |
73,733 |
| 20% |
20.0% |
48,810 |
48,728 |
| 10% |
9.9% |
24,405 |
24,266 |
| Active Idle |
|
0 |
0 |
JVM 'localhost.024' Scores:
| Target Load |
Actual Load |
ssj_ops |
| Target |
Actual |
| Calibration 1 |
|
|
229,654 |
| Calibration 2 |
|
|
243,700 |
| Calibration 3 |
|
|
243,953 |
| ssj_ops@calibrated=243,826 |
| 100% |
100.0% |
243,826 |
243,907 |
| 90% |
88.6% |
219,444 |
215,911 |
| 80% |
79.2% |
195,061 |
193,229 |
| 70% |
70.0% |
170,678 |
170,594 |
| 60% |
60.2% |
146,296 |
146,846 |
| 50% |
50.2% |
121,913 |
122,397 |
| 40% |
40.3% |
97,530 |
98,171 |
| 30% |
29.9% |
73,148 |
72,943 |
| 20% |
19.9% |
48,765 |
48,589 |
| 10% |
9.9% |
24,383 |
24,177 |
| Active Idle |
|
0 |
0 |
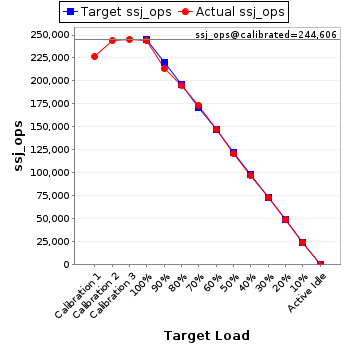
JVM 'localhost.025' Scores:
| Target Load |
Actual Load |
ssj_ops |
| Target |
Actual |
| Calibration 1 |
|
|
226,564 |
| Calibration 2 |
|
|
243,812 |
| Calibration 3 |
|
|
245,401 |
| ssj_ops@calibrated=244,606 |
| 100% |
99.8% |
244,606 |
244,197 |
| 90% |
87.2% |
220,146 |
213,416 |
| 80% |
79.9% |
195,685 |
195,404 |
| 70% |
70.9% |
171,224 |
173,351 |
| 60% |
60.3% |
146,764 |
147,458 |
| 50% |
49.4% |
122,303 |
120,928 |
| 40% |
39.6% |
97,843 |
96,866 |
| 30% |
29.8% |
73,382 |
72,899 |
| 20% |
19.9% |
48,921 |
48,697 |
| 10% |
10.0% |
24,461 |
24,358 |
| Active Idle |
|
0 |
0 |
JVM 'localhost.026' Scores:
| Target Load |
Actual Load |
ssj_ops |
| Target |
Actual |
| Calibration 1 |
|
|
231,084 |
| Calibration 2 |
|
|
244,788 |
| Calibration 3 |
|
|
245,434 |
| ssj_ops@calibrated=245,111 |
| 100% |
99.7% |
245,111 |
244,449 |
| 90% |
86.9% |
220,600 |
213,026 |
| 80% |
79.4% |
196,089 |
194,608 |
| 70% |
70.1% |
171,578 |
171,725 |
| 60% |
60.0% |
147,067 |
147,146 |
| 50% |
49.6% |
122,556 |
121,652 |
| 40% |
39.6% |
98,045 |
97,085 |
| 30% |
29.5% |
73,533 |
72,263 |
| 20% |
20.3% |
49,022 |
49,713 |
| 10% |
9.9% |
24,511 |
24,379 |
| Active Idle |
|
0 |
0 |
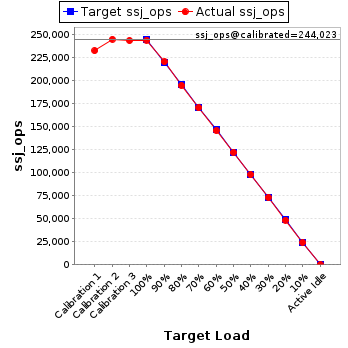
JVM 'localhost.027' Scores:
| Target Load |
Actual Load |
ssj_ops |
| Target |
Actual |
| Calibration 1 |
|
|
232,280 |
| Calibration 2 |
|
|
244,738 |
| Calibration 3 |
|
|
243,308 |
| ssj_ops@calibrated=244,023 |
| 100% |
99.9% |
244,023 |
243,781 |
| 90% |
90.3% |
219,621 |
220,296 |
| 80% |
79.7% |
195,218 |
194,371 |
| 70% |
69.8% |
170,816 |
170,376 |
| 60% |
59.6% |
146,414 |
145,456 |
| 50% |
50.1% |
122,011 |
122,151 |
| 40% |
40.0% |
97,609 |
97,651 |
| 30% |
29.9% |
73,207 |
72,922 |
| 20% |
19.8% |
48,805 |
48,377 |
| 10% |
9.9% |
24,402 |
24,224 |
| Active Idle |
|
0 |
0 |
JVM 'localhost.028' Scores:
| Target Load |
Actual Load |
ssj_ops |
| Target |
Actual |
| Calibration 1 |
|
|
233,551 |
| Calibration 2 |
|
|
248,389 |
| Calibration 3 |
|
|
248,322 |
| ssj_ops@calibrated=248,355 |
| 100% |
99.6% |
248,355 |
247,425 |
| 90% |
87.9% |
223,520 |
218,367 |
| 80% |
79.8% |
198,684 |
198,065 |
| 70% |
69.7% |
173,849 |
173,006 |
| 60% |
60.4% |
149,013 |
149,896 |
| 50% |
50.2% |
124,178 |
124,691 |
| 40% |
40.4% |
99,342 |
100,457 |
| 30% |
30.2% |
74,507 |
75,075 |
| 20% |
20.0% |
49,671 |
49,758 |
| 10% |
10.1% |
24,836 |
25,141 |
| Active Idle |
|
0 |
0 |
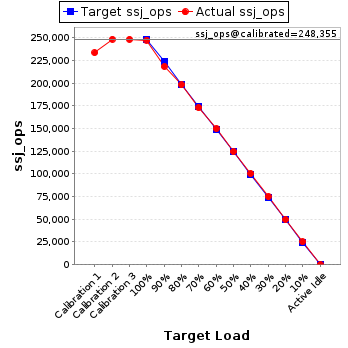
JVM 'localhost.029' Scores:
| Target Load |
Actual Load |
ssj_ops |
| Target |
Actual |
| Calibration 1 |
|
|
234,160 |
| Calibration 2 |
|
|
245,706 |
| Calibration 3 |
|
|
247,010 |
| ssj_ops@calibrated=246,358 |
| 100% |
99.5% |
246,358 |
245,023 |
| 90% |
87.6% |
221,722 |
215,739 |
| 80% |
79.8% |
197,086 |
196,584 |
| 70% |
70.0% |
172,451 |
172,513 |
| 60% |
60.1% |
147,815 |
148,168 |
| 50% |
49.5% |
123,179 |
122,014 |
| 40% |
40.1% |
98,543 |
98,671 |
| 30% |
30.0% |
73,907 |
73,904 |
| 20% |
20.2% |
49,272 |
49,833 |
| 10% |
10.0% |
24,636 |
24,533 |
| Active Idle |
|
0 |
0 |
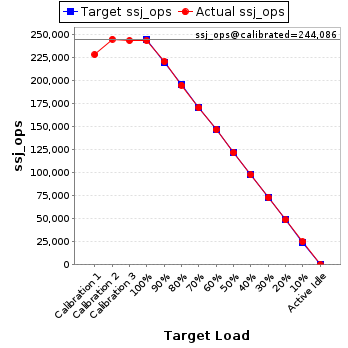
JVM 'localhost.030' Scores:
| Target Load |
Actual Load |
ssj_ops |
| Target |
Actual |
| Calibration 1 |
|
|
228,199 |
| Calibration 2 |
|
|
244,840 |
| Calibration 3 |
|
|
243,332 |
| ssj_ops@calibrated=244,086 |
| 100% |
99.7% |
244,086 |
243,288 |
| 90% |
90.4% |
219,678 |
220,599 |
| 80% |
79.8% |
195,269 |
194,748 |
| 70% |
69.8% |
170,860 |
170,421 |
| 60% |
60.1% |
146,452 |
146,599 |
| 50% |
49.8% |
122,043 |
121,577 |
| 40% |
39.9% |
97,634 |
97,451 |
| 30% |
29.8% |
73,226 |
72,852 |
| 20% |
19.9% |
48,817 |
48,565 |
| 10% |
10.2% |
24,409 |
24,808 |
| Active Idle |
|
0 |
0 |
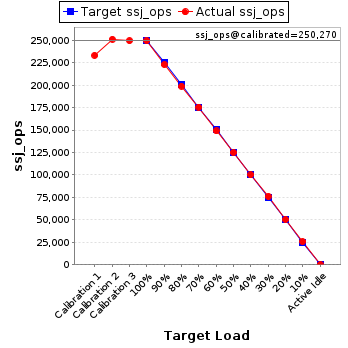
JVM 'localhost.031' Scores:
| Target Load |
Actual Load |
ssj_ops |
| Target |
Actual |
| Calibration 1 |
|
|
233,165 |
| Calibration 2 |
|
|
251,133 |
| Calibration 3 |
|
|
249,406 |
| ssj_ops@calibrated=250,270 |
| 100% |
99.7% |
250,270 |
249,482 |
| 90% |
89.1% |
225,243 |
222,866 |
| 80% |
79.5% |
200,216 |
198,882 |
| 70% |
70.1% |
175,189 |
175,542 |
| 60% |
59.5% |
150,162 |
148,919 |
| 50% |
50.0% |
125,135 |
125,057 |
| 40% |
39.9% |
100,108 |
99,919 |
| 30% |
30.4% |
75,081 |
76,117 |
| 20% |
20.1% |
50,054 |
50,350 |
| 10% |
10.2% |
25,027 |
25,612 |
| Active Idle |
|
0 |
0 |
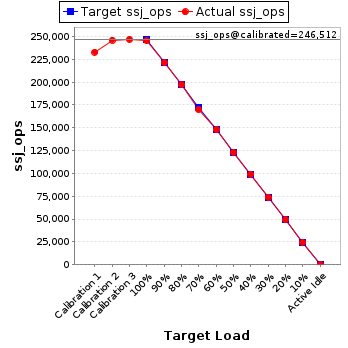
JVM 'localhost.032' Scores:
| Target Load |
Actual Load |
ssj_ops |
| Target |
Actual |
| Calibration 1 |
|
|
232,903 |
| Calibration 2 |
|
|
246,087 |
| Calibration 3 |
|
|
246,938 |
| ssj_ops@calibrated=246,512 |
| 100% |
99.5% |
246,512 |
245,369 |
| 90% |
89.8% |
221,861 |
221,386 |
| 80% |
79.9% |
197,210 |
196,901 |
| 70% |
69.0% |
172,559 |
169,983 |
| 60% |
60.1% |
147,907 |
148,127 |
| 50% |
49.9% |
123,256 |
122,972 |
| 40% |
40.3% |
98,605 |
99,285 |
| 30% |
30.1% |
73,954 |
74,092 |
| 20% |
19.9% |
49,302 |
49,176 |
| 10% |
10.0% |
24,651 |
24,620 |
| Active Idle |
|
0 |
0 |
JVM 'localhost.033' Scores:
| Target Load |
Actual Load |
ssj_ops |
| Target |
Actual |
| Calibration 1 |
|
|
231,473 |
| Calibration 2 |
|
|
247,020 |
| Calibration 3 |
|
|
246,038 |
| ssj_ops@calibrated=246,529 |
| 100% |
99.5% |
246,529 |
245,254 |
| 90% |
89.5% |
221,876 |
220,737 |
| 80% |
80.4% |
197,223 |
198,272 |
| 70% |
69.5% |
172,570 |
171,250 |
| 60% |
60.3% |
147,917 |
148,580 |
| 50% |
49.7% |
123,264 |
122,540 |
| 40% |
40.2% |
98,612 |
99,208 |
| 30% |
29.9% |
73,959 |
73,727 |
| 20% |
20.0% |
49,306 |
49,259 |
| 10% |
10.0% |
24,653 |
24,553 |
| Active Idle |
|
0 |
0 |
JVM 'localhost.034' Scores:
| Target Load |
Actual Load |
ssj_ops |
| Target |
Actual |
| Calibration 1 |
|
|
235,743 |
| Calibration 2 |
|
|
248,469 |
| Calibration 3 |
|
|
248,793 |
| ssj_ops@calibrated=248,631 |
| 100% |
99.8% |
248,631 |
248,063 |
| 90% |
88.1% |
223,768 |
219,105 |
| 80% |
79.6% |
198,905 |
197,907 |
| 70% |
69.8% |
174,042 |
173,491 |
| 60% |
59.7% |
149,179 |
148,390 |
| 50% |
50.1% |
124,316 |
124,483 |
| 40% |
39.9% |
99,452 |
99,113 |
| 30% |
30.0% |
74,589 |
74,606 |
| 20% |
19.7% |
49,726 |
48,882 |
| 10% |
9.9% |
24,863 |
24,568 |
| Active Idle |
|
0 |
0 |
JVM 'localhost.035' Scores:
| Target Load |
Actual Load |
ssj_ops |
| Target |
Actual |
| Calibration 1 |
|
|
233,705 |
| Calibration 2 |
|
|
247,164 |
| Calibration 3 |
|
|
248,324 |
| ssj_ops@calibrated=247,744 |
| 100% |
99.8% |
247,744 |
247,254 |
| 90% |
88.9% |
222,970 |
220,138 |
| 80% |
79.3% |
198,195 |
196,422 |
| 70% |
69.5% |
173,421 |
172,172 |
| 60% |
59.7% |
148,647 |
147,809 |
| 50% |
49.6% |
123,872 |
122,929 |
| 40% |
40.2% |
99,098 |
99,558 |
| 30% |
29.9% |
74,323 |
74,144 |
| 20% |
20.0% |
49,549 |
49,459 |
| 10% |
10.3% |
24,774 |
25,463 |
| Active Idle |
|
0 |
0 |
JVM 'localhost.036' Scores:
| Target Load |
Actual Load |
ssj_ops |
| Target |
Actual |
| Calibration 1 |
|
|
233,865 |
| Calibration 2 |
|
|
248,012 |
| Calibration 3 |
|
|
248,718 |
| ssj_ops@calibrated=248,365 |
| 100% |
99.9% |
248,365 |
248,166 |
| 90% |
88.9% |
223,529 |
220,899 |
| 80% |
78.7% |
198,692 |
195,571 |
| 70% |
70.0% |
173,856 |
173,951 |
| 60% |
59.8% |
149,019 |
148,624 |
| 50% |
49.9% |
124,183 |
123,971 |
| 40% |
40.3% |
99,346 |
100,160 |
| 30% |
30.2% |
74,510 |
75,017 |
| 20% |
20.0% |
49,673 |
49,571 |
| 10% |
9.7% |
24,837 |
24,133 |
| Active Idle |
|
0 |
0 |
JVM 'localhost.037' Scores:
| Target Load |
Actual Load |
ssj_ops |
| Target |
Actual |
| Calibration 1 |
|
|
240,690 |
| Calibration 2 |
|
|
253,427 |
| Calibration 3 |
|
|
254,090 |
| ssj_ops@calibrated=253,759 |
| 100% |
100.1% |
253,759 |
253,961 |
| 90% |
90.9% |
228,383 |
230,766 |
| 80% |
79.5% |
203,007 |
201,818 |
| 70% |
69.9% |
177,631 |
177,490 |
| 60% |
60.2% |
152,255 |
152,829 |
| 50% |
49.7% |
126,879 |
126,168 |
| 40% |
40.1% |
101,503 |
101,777 |
| 30% |
30.0% |
76,128 |
76,057 |
| 20% |
19.9% |
50,752 |
50,586 |
| 10% |
9.8% |
25,376 |
24,792 |
| Active Idle |
|
0 |
0 |
JVM 'localhost.038' Scores:
| Target Load |
Actual Load |
ssj_ops |
| Target |
Actual |
| Calibration 1 |
|
|
232,300 |
| Calibration 2 |
|
|
249,153 |
| Calibration 3 |
|
|
248,613 |
| ssj_ops@calibrated=248,883 |
| 100% |
99.9% |
248,883 |
248,593 |
| 90% |
90.2% |
223,995 |
224,522 |
| 80% |
79.7% |
199,106 |
198,363 |
| 70% |
69.4% |
174,218 |
172,809 |
| 60% |
60.0% |
149,330 |
149,372 |
| 50% |
49.8% |
124,442 |
123,878 |
| 40% |
40.0% |
99,553 |
99,537 |
| 30% |
29.8% |
74,665 |
74,199 |
| 20% |
20.0% |
49,777 |
49,833 |
| 10% |
10.0% |
24,888 |
24,880 |
| Active Idle |
|
0 |
0 |
JVM 'localhost.039' Scores:
| Target Load |
Actual Load |
ssj_ops |
| Target |
Actual |
| Calibration 1 |
|
|
229,758 |
| Calibration 2 |
|
|
247,684 |
| Calibration 3 |
|
|
246,043 |
| ssj_ops@calibrated=246,864 |
| 100% |
99.8% |
246,864 |
246,454 |
| 90% |
87.7% |
222,177 |
216,420 |
| 80% |
79.5% |
197,491 |
196,233 |
| 70% |
70.2% |
172,805 |
173,359 |
| 60% |
59.8% |
148,118 |
147,513 |
| 50% |
50.3% |
123,432 |
124,167 |
| 40% |
40.1% |
98,745 |
99,064 |
| 30% |
30.2% |
74,059 |
74,533 |
| 20% |
20.4% |
49,373 |
50,431 |
| 10% |
9.9% |
24,686 |
24,377 |
| Active Idle |
|
0 |
0 |
JVM 'localhost.040' Scores:
| Target Load |
Actual Load |
ssj_ops |
| Target |
Actual |
| Calibration 1 |
|
|
229,529 |
| Calibration 2 |
|
|
243,705 |
| Calibration 3 |
|
|
242,398 |
| ssj_ops@calibrated=243,051 |
| 100% |
99.6% |
243,051 |
241,986 |
| 90% |
89.1% |
218,746 |
216,645 |
| 80% |
79.8% |
194,441 |
193,942 |
| 70% |
70.0% |
170,136 |
170,124 |
| 60% |
59.8% |
145,831 |
145,367 |
| 50% |
49.8% |
121,526 |
120,935 |
| 40% |
40.0% |
97,221 |
97,341 |
| 30% |
30.0% |
72,915 |
73,035 |
| 20% |
20.1% |
48,610 |
48,946 |
| 10% |
10.0% |
24,305 |
24,376 |
| Active Idle |
|
0 |
0 |
JVM 'localhost.041' Scores:
| Target Load |
Actual Load |
ssj_ops |
| Target |
Actual |
| Calibration 1 |
|
|
230,413 |
| Calibration 2 |
|
|
247,032 |
| Calibration 3 |
|
|
246,624 |
| ssj_ops@calibrated=246,828 |
| 100% |
99.9% |
246,828 |
246,687 |
| 90% |
88.6% |
222,145 |
218,712 |
| 80% |
80.0% |
197,463 |
197,468 |
| 70% |
70.2% |
172,780 |
173,319 |
| 60% |
59.8% |
148,097 |
147,541 |
| 50% |
50.1% |
123,414 |
123,733 |
| 40% |
40.4% |
98,731 |
99,732 |
| 30% |
29.9% |
74,048 |
73,742 |
| 20% |
20.2% |
49,366 |
49,981 |
| 10% |
10.0% |
24,683 |
24,687 |
| Active Idle |
|
0 |
0 |
JVM 'localhost.042' Scores:
| Target Load |
Actual Load |
ssj_ops |
| Target |
Actual |
| Calibration 1 |
|
|
233,717 |
| Calibration 2 |
|
|
248,687 |
| Calibration 3 |
|
|
247,949 |
| ssj_ops@calibrated=248,318 |
| 100% |
99.2% |
248,318 |
246,257 |
| 90% |
89.2% |
223,486 |
221,604 |
| 80% |
80.0% |
198,655 |
198,722 |
| 70% |
69.6% |
173,823 |
172,734 |
| 60% |
60.2% |
148,991 |
149,472 |
| 50% |
49.8% |
124,159 |
123,732 |
| 40% |
40.5% |
99,327 |
100,531 |
| 30% |
29.9% |
74,495 |
74,221 |
| 20% |
20.1% |
49,664 |
49,862 |
| 10% |
10.2% |
24,832 |
25,417 |
| Active Idle |
|
0 |
0 |
JVM 'localhost.043' Scores:
| Target Load |
Actual Load |
ssj_ops |
| Target |
Actual |
| Calibration 1 |
|
|
233,041 |
| Calibration 2 |
|
|
240,724 |
| Calibration 3 |
|
|
244,205 |
| ssj_ops@calibrated=242,464 |
| 100% |
100.7% |
242,464 |
244,214 |
| 90% |
88.7% |
218,218 |
215,141 |
| 80% |
79.7% |
193,971 |
193,132 |
| 70% |
70.8% |
169,725 |
171,680 |
| 60% |
60.3% |
145,479 |
146,155 |
| 50% |
49.8% |
121,232 |
120,684 |
| 40% |
40.1% |
96,986 |
97,339 |
| 30% |
29.9% |
72,739 |
72,472 |
| 20% |
20.1% |
48,493 |
48,839 |
| 10% |
9.9% |
24,246 |
24,071 |
| Active Idle |
|
0 |
0 |
JVM 'localhost.044' Scores:
| Target Load |
Actual Load |
ssj_ops |
| Target |
Actual |
| Calibration 1 |
|
|
231,756 |
| Calibration 2 |
|
|
252,152 |
| Calibration 3 |
|
|
249,950 |
| ssj_ops@calibrated=251,051 |
| 100% |
99.0% |
251,051 |
248,572 |
| 90% |
89.3% |
225,946 |
224,141 |
| 80% |
80.2% |
200,841 |
201,387 |
| 70% |
69.8% |
175,736 |
175,341 |
| 60% |
59.5% |
150,631 |
149,286 |
| 50% |
50.3% |
125,526 |
126,221 |
| 40% |
40.1% |
100,420 |
100,707 |
| 30% |
29.9% |
75,315 |
74,969 |
| 20% |
19.6% |
50,210 |
49,291 |
| 10% |
10.2% |
25,105 |
25,506 |
| Active Idle |
|
0 |
0 |
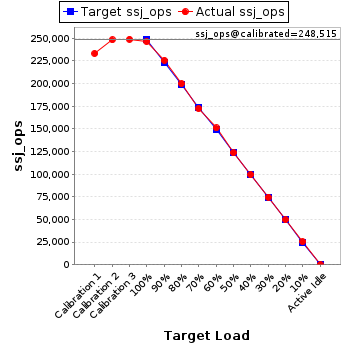
JVM 'localhost.045' Scores:
| Target Load |
Actual Load |
ssj_ops |
| Target |
Actual |
| Calibration 1 |
|
|
232,495 |
| Calibration 2 |
|
|
248,452 |
| Calibration 3 |
|
|
249,058 |
| ssj_ops@calibrated=248,755 |
| 100% |
99.9% |
248,755 |
248,515 |
| 90% |
89.7% |
223,880 |
223,247 |
| 80% |
79.8% |
199,004 |
198,464 |
| 70% |
69.9% |
174,129 |
173,965 |
| 60% |
60.0% |
149,253 |
149,325 |
| 50% |
49.7% |
124,378 |
123,742 |
| 40% |
39.8% |
99,502 |
98,976 |
| 30% |
29.5% |
74,627 |
73,325 |
| 20% |
19.9% |
49,751 |
49,478 |
| 10% |
10.0% |
24,876 |
24,921 |
| Active Idle |
|
0 |
0 |
JVM 'localhost.046' Scores:
| Target Load |
Actual Load |
ssj_ops |
| Target |
Actual |
| Calibration 1 |
|
|
234,421 |
| Calibration 2 |
|
|
246,406 |
| Calibration 3 |
|
|
245,420 |
| ssj_ops@calibrated=245,913 |
| 100% |
99.9% |
245,913 |
245,737 |
| 90% |
88.1% |
221,322 |
216,535 |
| 80% |
79.4% |
196,730 |
195,168 |
| 70% |
70.5% |
172,139 |
173,274 |
| 60% |
59.4% |
147,548 |
146,195 |
| 50% |
49.9% |
122,956 |
122,721 |
| 40% |
40.2% |
98,365 |
98,782 |
| 30% |
30.1% |
73,774 |
74,082 |
| 20% |
19.9% |
49,183 |
48,885 |
| 10% |
10.0% |
24,591 |
24,608 |
| Active Idle |
|
0 |
0 |
JVM 'localhost.047' Scores:
| Target Load |
Actual Load |
ssj_ops |
| Target |
Actual |
| Calibration 1 |
|
|
231,529 |
| Calibration 2 |
|
|
248,564 |
| Calibration 3 |
|
|
249,645 |
| ssj_ops@calibrated=249,105 |
| 100% |
99.6% |
249,105 |
248,104 |
| 90% |
88.7% |
224,194 |
220,895 |
| 80% |
79.8% |
199,284 |
198,718 |
| 70% |
70.1% |
174,373 |
174,544 |
| 60% |
59.9% |
149,463 |
149,199 |
| 50% |
50.1% |
124,552 |
124,827 |
| 40% |
40.1% |
99,642 |
99,925 |
| 30% |
30.0% |
74,731 |
74,842 |
| 20% |
19.9% |
49,821 |
49,544 |
| 10% |
9.9% |
24,910 |
24,758 |
| Active Idle |
|
0 |
0 |
JVM 'localhost.048' Scores:
| Target Load |
Actual Load |
ssj_ops |
| Target |
Actual |
| Calibration 1 |
|
|
234,003 |
| Calibration 2 |
|
|
249,235 |
| Calibration 3 |
|
|
248,085 |
| ssj_ops@calibrated=248,660 |
| 100% |
99.2% |
248,660 |
246,582 |
| 90% |
89.9% |
223,794 |
223,579 |
| 80% |
79.6% |
198,928 |
197,954 |
| 70% |
70.2% |
174,062 |
174,670 |
| 60% |
60.1% |
149,196 |
149,522 |
| 50% |
49.6% |
124,330 |
123,265 |
| 40% |
40.4% |
99,464 |
100,405 |
| 30% |
30.1% |
74,598 |
74,900 |
| 20% |
20.0% |
49,732 |
49,817 |
| 10% |
10.2% |
24,866 |
25,383 |
| Active Idle |
|
0 |
0 |