SPECpower_ssj2008
Aggregate Performance Report
Copyright © 2007-2018 Standard Performance Evaluation Corporation
| Hewlett Packard Enterprise Synergy 480 Gen10 Compute Module | ssj_ops@100% = 62,981,514 ssj_ops@100% per Host = 5,725,592 ssj_ops@100% per JVM = 1,431,398 |
||||
| Test Sponsor: | Hewlett Packard Enterprise | SPEC License #: | 3 | Test Method: | Multi Node |
| Tested By: | Hewlett Packard Enterprise | Test Location: | Houston, TX, USA | Test Date: | Aug 26, 2018 |
| Hardware Availability: | Jun-2018 | Software Availability: | Mar-2018 | Publication: | Sep 12, 2018 |
| System Source: | Single Supplier | System Designation: | Server | Power Provisioning: | Line-powered |
| Target Load | Actual Load | ssj_ops | |
|---|---|---|---|
| Target | Actual | ||
| Calibration 1 | 63,253,543 | ||
| Calibration 2 | 63,205,606 | ||
| Calibration 3 | 63,293,822 | ||
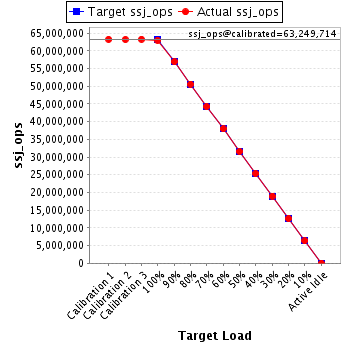
| ssj_ops@calibrated=63,249,714 | |||
| 100% | 99.6% | 63,249,714 | 62,981,514 |
| 90% | 90.0% | 56,924,743 | 56,902,323 |
| 80% | 80.0% | 50,599,771 | 50,630,610 |
| 70% | 70.0% | 44,274,800 | 44,252,658 |
| 60% | 60.0% | 37,949,828 | 37,941,855 |
| 50% | 50.0% | 31,624,857 | 31,602,940 |
| 40% | 40.0% | 25,299,886 | 25,326,307 |
| 30% | 30.0% | 18,974,914 | 18,981,220 |
| 20% | 20.0% | 12,649,943 | 12,646,750 |
| 10% | 10.0% | 6,324,971 | 6,327,604 |
| Active Idle | 0 | 0 | |
| # of Nodes | # of Chips | # of Cores | # of Threads | Total RAM (GB) | # of OS Images | # of JVM Instances |
|---|---|---|---|---|---|---|
| 11 | 22 | 616 | 1,232 | 2,112 | 11 | 44 |
| Set Identifier: | SUT |
| Set Description: | System Under Test |
| # of Identical Nodes: | 11 |
| Comment: | SUT |
| Hardware per Node | |
|---|---|
| Hardware Vendor: | Hewlett Packard Enterprise |
| Model: | Synergy 480 Gen10 Compute Module |
| Form Factor: | Other |
| CPU Name: | Intel Xeon Platinum 8180 2.50GHz |
| CPU Characteristics: | 28-Core, 2.50 GHz, 38.5 MB L3 Cache |
| CPU Frequency (MHz): | 2500 |
| CPU(s) Enabled: | 56 cores, 2 chips, 28 cores/chip |
| Hardware Threads: | 112 (2 / core) |
| CPU(s) Orderable: | 1,2 chips |
| Primary Cache: | 32 KB I + 32 KB D on chip per core |
| Secondary Cache: | 1 MB I+D on chip per core |
| Tertiary Cache: | 39424 KB I+D on chip per chip |
| Other Cache: | None |
| Memory Amount (GB): | 192 |
| # and size of DIMM: | 12 x 16384 MB |
| Memory Details: | 12 x 16GB 2Rx8 PC4-2666-V ECC; slots 1, 3, 5, 8, 10 and 12 populated on each CPU socket |
| Power Supply Quantity and Rating (W): | None |
| Power Supply Details: | Shared |
| Disk Drive: | 1 x HPE Synergy 480 Gen10 M.2 FIO Adapter Board Kit (873165-B21); 1 x HPE 480GB SATA 6G Read Intensive M.2 2280 SSD (875498-B21) |
| Disk Controller: | 1 x HPE Smart Array S100i SR Gen10 |
| # and type of Network Interface Cards (NICs) Installed: | 1 x HPE Synergy 3820C 10/20Gb 2-port Converged Network Adapter (777430-B21) |
| NICs Enabled in Firmware / OS / Connected: | 2/1/1 |
| Network Speed (Mbit): | 10000 |
| Keyboard: | None |
| Mouse: | None |
| Monitor: | None |
| Optical Drives: | No |
| Other Hardware: | None |
| Software per Node | |
|---|---|
| Power Management: | Enabled (see SUT Notes) |
| Operating System (OS): | Windows Server 2012 R2 Datacenter |
| OS Version: | 6.3 (Build 9600) |
| Filesystem: | NTFS |
| JVM Vendor: | Oracle Corporation |
| JVM Version: | Java HotSpot(TM) 64-Bit Server VM (build 24.80-b11, mixed mode), version 1.7.0_80 |
| JVM Command-line Options: | -server -Xmn19g -Xms21g -Xmx21g -XX:SurvivorRatio=1 -XX:TargetSurvivorRatio=99 -XX:ParallelGCThreads=28 -XX:AllocatePrefetchDistance=256 -XX:AllocatePrefetchLines=4 -XX:LoopUnrollLimit=45 -XX:InitialTenuringThreshold=12 -XX:MaxTenuringThreshold=15 -XX:InlineSmallCode=9000 -XX:MaxInlineSize=270 -XX:FreqInlineSize=6000 -XX:+UseLargePages -XX:+UseParallelOldGC -XX:+AggressiveOpts |
| JVM Affinity: | start /NODE [0,1,2,3] /AFFINITY [0xFFFFFFF] |
| JVM Instances: | 4 |
| JVM Initial Heap (MB): | 21000 |
| JVM Maximum Heap (MB): | 21000 |
| JVM Address Bits: | 64 |
| Boot Firmware Version: | I42 v1.32 (02/01/2018) |
| Management Firmware Version: | 1.15 Aug 17 2017 |
| Workload Version: | SSJ 1.2.10 |
| Director Location: | Controller |
| Other Software: | HPE Composer Version 3.10.07 (HPE OneView) with HPE Synergy Custom SPP Bundle 2017.10.20180323; Microsoft Windows KB4054519, KB4056898 |
| Host | ssj_ops@100% |
|---|---|
| NODE01 | 5,752,388 |
| NODE02 | 5,728,531 |
| NODE03 | 5,748,027 |
| NODE04 | 5,693,845 |
| NODE05 | 5,732,798 |
| NODE06 | 5,692,863 |
| NODE07 | 5,719,135 |
| NODE08 | 5,720,146 |
| NODE09 | 5,728,556 |
| NODE10 | 5,716,109 |
| NODE11 | 5,749,115 |
| ssj_ops@100% | 62,981,514 |
| ssj_ops@100% per Host | 5,725,592 |
| ssj_ops@100% per JVM | 1,431,398 |

| Target Load | Actual Load | ssj_ops | |
|---|---|---|---|
| Target | Actual | ||
| Calibration 1 | 5,777,716 | ||
| Calibration 2 | 5,776,219 | ||
| Calibration 3 | 5,786,479 | ||
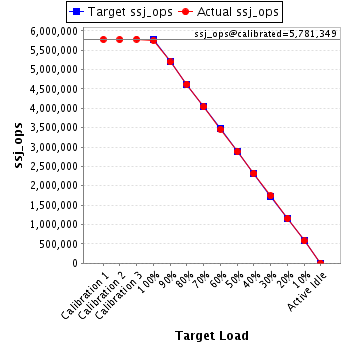
| ssj_ops@calibrated=5,781,349 | |||
| 100% | 99.5% | 5,781,349 | 5,752,388 |
| 90% | 89.9% | 5,203,214 | 5,197,137 |
| 80% | 79.9% | 4,625,079 | 4,620,918 |
| 70% | 69.9% | 4,046,944 | 4,038,945 |
| 60% | 59.9% | 3,468,809 | 3,462,692 |
| 50% | 49.9% | 2,890,674 | 2,882,486 |
| 40% | 40.1% | 2,312,540 | 2,317,805 |
| 30% | 30.1% | 1,734,405 | 1,737,370 |
| 20% | 20.0% | 1,156,270 | 1,156,319 |
| 10% | 10.0% | 578,135 | 577,705 |
| Active Idle | 0 | 0 | |
| Target Load | Actual Load | ssj_ops | |
|---|---|---|---|
| Target | Actual | ||
| Calibration 1 | 5,760,674 | ||
| Calibration 2 | 5,753,998 | ||
| Calibration 3 | 5,759,425 | ||
| ssj_ops@calibrated=5,756,712 | |||
| 100% | 99.5% | 5,756,712 | 5,728,531 |
| 90% | 90.0% | 5,181,041 | 5,180,344 |
| 80% | 79.9% | 4,605,370 | 4,601,648 |
| 70% | 70.1% | 4,029,698 | 4,035,366 |
| 60% | 60.1% | 3,454,027 | 3,458,526 |
| 50% | 50.0% | 2,878,356 | 2,875,624 |
| 40% | 40.1% | 2,302,685 | 2,305,717 |
| 30% | 30.0% | 1,727,014 | 1,727,589 |
| 20% | 20.0% | 1,151,342 | 1,150,405 |
| 10% | 10.0% | 575,671 | 575,507 |
| Active Idle | 0 | 0 | |

| Target Load | Actual Load | ssj_ops | |
|---|---|---|---|
| Target | Actual | ||
| Calibration 1 | 5,771,383 | ||
| Calibration 2 | 5,763,082 | ||
| Calibration 3 | 5,773,467 | ||
| ssj_ops@calibrated=5,768,275 | |||
| 100% | 99.6% | 5,768,275 | 5,748,027 |
| 90% | 90.0% | 5,191,447 | 5,189,782 |
| 80% | 79.9% | 4,614,620 | 4,610,561 |
| 70% | 70.0% | 4,037,792 | 4,036,481 |
| 60% | 60.0% | 3,460,965 | 3,459,777 |
| 50% | 50.0% | 2,884,137 | 2,883,737 |
| 40% | 40.0% | 2,307,310 | 2,307,384 |
| 30% | 30.0% | 1,730,482 | 1,731,949 |
| 20% | 20.0% | 1,153,655 | 1,151,740 |
| 10% | 10.0% | 576,827 | 575,780 |
| Active Idle | 0 | 0 | |

| Target Load | Actual Load | ssj_ops | |
|---|---|---|---|
| Target | Actual | ||
| Calibration 1 | 5,730,161 | ||
| Calibration 2 | 5,718,088 | ||
| Calibration 3 | 5,726,396 | ||
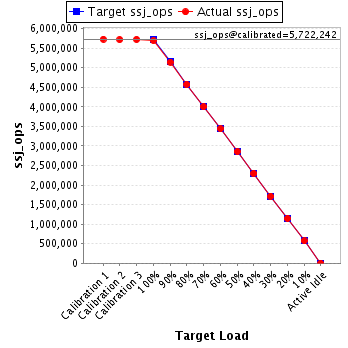
| ssj_ops@calibrated=5,722,242 | |||
| 100% | 99.5% | 5,722,242 | 5,693,845 |
| 90% | 89.9% | 5,150,017 | 5,144,588 |
| 80% | 79.9% | 4,577,793 | 4,574,348 |
| 70% | 69.9% | 4,005,569 | 4,000,836 |
| 60% | 60.0% | 3,433,345 | 3,435,253 |
| 50% | 49.9% | 2,861,121 | 2,855,373 |
| 40% | 40.1% | 2,288,897 | 2,294,091 |
| 30% | 30.0% | 1,716,672 | 1,715,428 |
| 20% | 20.0% | 1,144,448 | 1,144,669 |
| 10% | 10.0% | 572,224 | 573,085 |
| Active Idle | 0 | 0 | |
| Target Load | Actual Load | ssj_ops | |
|---|---|---|---|
| Target | Actual | ||
| Calibration 1 | 5,753,221 | ||
| Calibration 2 | 5,752,410 | ||
| Calibration 3 | 5,763,914 | ||
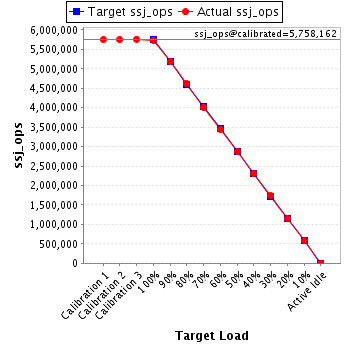
| ssj_ops@calibrated=5,758,162 | |||
| 100% | 99.6% | 5,758,162 | 5,732,798 |
| 90% | 90.1% | 5,182,346 | 5,190,272 |
| 80% | 80.2% | 4,606,530 | 4,616,498 |
| 70% | 69.7% | 4,030,713 | 4,012,898 |
| 60% | 59.9% | 3,454,897 | 3,450,335 |
| 50% | 50.0% | 2,879,081 | 2,878,184 |
| 40% | 40.1% | 2,303,265 | 2,306,208 |
| 30% | 30.1% | 1,727,449 | 1,731,234 |
| 20% | 19.9% | 1,151,632 | 1,148,033 |
| 10% | 10.0% | 575,816 | 576,401 |
| Active Idle | 0 | 0 | |
| Target Load | Actual Load | ssj_ops | |
|---|---|---|---|
| Target | Actual | ||
| Calibration 1 | 5,714,725 | ||
| Calibration 2 | 5,711,116 | ||
| Calibration 3 | 5,714,131 | ||
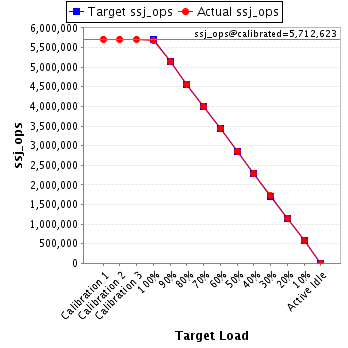
| ssj_ops@calibrated=5,712,623 | |||
| 100% | 99.7% | 5,712,623 | 5,692,863 |
| 90% | 89.9% | 5,141,361 | 5,133,372 |
| 80% | 80.0% | 4,570,099 | 4,568,110 |
| 70% | 70.1% | 3,998,836 | 4,003,911 |
| 60% | 60.1% | 3,427,574 | 3,430,841 |
| 50% | 50.1% | 2,856,312 | 2,861,094 |
| 40% | 40.0% | 2,285,049 | 2,283,824 |
| 30% | 30.0% | 1,713,787 | 1,716,601 |
| 20% | 20.0% | 1,142,525 | 1,145,201 |
| 10% | 10.0% | 571,262 | 570,770 |
| Active Idle | 0 | 0 | |
| Target Load | Actual Load | ssj_ops | |
|---|---|---|---|
| Target | Actual | ||
| Calibration 1 | 5,729,275 | ||
| Calibration 2 | 5,736,864 | ||
| Calibration 3 | 5,740,525 | ||
| ssj_ops@calibrated=5,738,695 | |||
| 100% | 99.7% | 5,738,695 | 5,719,135 |
| 90% | 90.0% | 5,164,825 | 5,167,405 |
| 80% | 80.0% | 4,590,956 | 4,591,303 |
| 70% | 70.0% | 4,017,086 | 4,018,350 |
| 60% | 60.1% | 3,443,217 | 3,447,784 |
| 50% | 49.9% | 2,869,347 | 2,862,808 |
| 40% | 39.9% | 2,295,478 | 2,292,567 |
| 30% | 30.0% | 1,721,608 | 1,719,876 |
| 20% | 20.0% | 1,147,739 | 1,146,774 |
| 10% | 10.0% | 573,869 | 575,609 |
| Active Idle | 0 | 0 | |

| Target Load | Actual Load | ssj_ops | |
|---|---|---|---|
| Target | Actual | ||
| Calibration 1 | 5,740,672 | ||
| Calibration 2 | 5,737,111 | ||
| Calibration 3 | 5,742,787 | ||
| ssj_ops@calibrated=5,739,949 | |||
| 100% | 99.7% | 5,739,949 | 5,720,146 |
| 90% | 90.1% | 5,165,954 | 5,171,789 |
| 80% | 79.9% | 4,591,959 | 4,588,787 |
| 70% | 70.0% | 4,017,964 | 4,015,834 |
| 60% | 59.9% | 3,443,969 | 3,436,053 |
| 50% | 50.0% | 2,869,974 | 2,870,116 |
| 40% | 40.0% | 2,295,980 | 2,298,639 |
| 30% | 30.0% | 1,721,985 | 1,723,640 |
| 20% | 20.0% | 1,147,990 | 1,149,571 |
| 10% | 10.0% | 573,995 | 572,434 |
| Active Idle | 0 | 0 | |

| Target Load | Actual Load | ssj_ops | |
|---|---|---|---|
| Target | Actual | ||
| Calibration 1 | 5,760,787 | ||
| Calibration 2 | 5,755,079 | ||
| Calibration 3 | 5,763,632 | ||
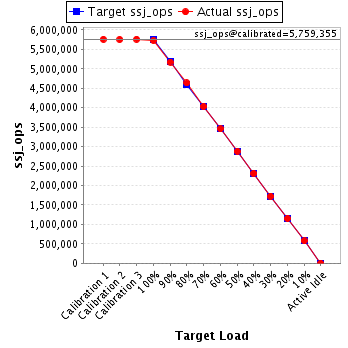
| ssj_ops@calibrated=5,759,355 | |||
| 100% | 99.5% | 5,759,355 | 5,728,556 |
| 90% | 89.9% | 5,183,420 | 5,175,096 |
| 80% | 80.5% | 4,607,484 | 4,637,732 |
| 70% | 70.0% | 4,031,549 | 4,034,338 |
| 60% | 60.0% | 3,455,613 | 3,454,750 |
| 50% | 50.0% | 2,879,678 | 2,880,204 |
| 40% | 40.1% | 2,303,742 | 2,309,532 |
| 30% | 30.0% | 1,727,807 | 1,727,382 |
| 20% | 20.0% | 1,151,871 | 1,150,468 |
| 10% | 10.0% | 575,936 | 576,829 |
| Active Idle | 0 | 0 | |
| Target Load | Actual Load | ssj_ops | |
|---|---|---|---|
| Target | Actual | ||
| Calibration 1 | 5,748,107 | ||
| Calibration 2 | 5,738,931 | ||
| Calibration 3 | 5,748,939 | ||
| ssj_ops@calibrated=5,743,935 | |||
| 100% | 99.5% | 5,743,935 | 5,716,109 |
| 90% | 89.8% | 5,169,542 | 5,160,694 |
| 80% | 80.1% | 4,595,148 | 4,603,492 |
| 70% | 69.9% | 4,020,755 | 4,014,219 |
| 60% | 60.0% | 3,446,361 | 3,444,570 |
| 50% | 50.0% | 2,871,968 | 2,873,743 |
| 40% | 40.0% | 2,297,574 | 2,296,823 |
| 30% | 30.0% | 1,723,181 | 1,722,865 |
| 20% | 20.0% | 1,148,787 | 1,150,379 |
| 10% | 10.0% | 574,394 | 574,845 |
| Active Idle | 0 | 0 | |

| Target Load | Actual Load | ssj_ops | |
|---|---|---|---|
| Target | Actual | ||
| Calibration 1 | 5,766,824 | ||
| Calibration 2 | 5,762,708 | ||
| Calibration 3 | 5,774,128 | ||
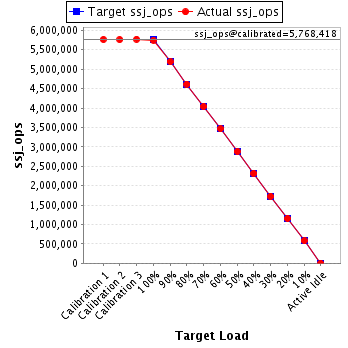
| ssj_ops@calibrated=5,768,418 | |||
| 100% | 99.7% | 5,768,418 | 5,749,115 |
| 90% | 90.0% | 5,191,576 | 5,191,842 |
| 80% | 80.0% | 4,614,734 | 4,617,213 |
| 70% | 70.1% | 4,037,892 | 4,041,482 |
| 60% | 60.0% | 3,461,051 | 3,461,273 |
| 50% | 49.9% | 2,884,209 | 2,879,571 |
| 40% | 40.1% | 2,307,367 | 2,313,718 |
| 30% | 29.9% | 1,730,525 | 1,727,284 |
| 20% | 20.0% | 1,153,684 | 1,153,191 |
| 10% | 10.0% | 576,842 | 578,640 |
| Active Idle | 0 | 0 | |