SPECpower_ssj2008
Aggregate Performance Report
Copyright © 2007-2018 Standard Performance Evaluation Corporation
| Hewlett Packard Enterprise Synergy 480 Gen10 Compute Module | ssj_ops@100% = 40,093,763 ssj_ops@100% per Host = 5,727,680 ssj_ops@100% per JVM = 1,431,920 |
||||
| Test Sponsor: | Hewlett Packard Enterprise | SPEC License #: | 3 | Test Method: | Multi Node |
| Tested By: | Hewlett Packard Enterprise | Test Location: | Houston, TX, USA | Test Date: | Aug 26, 2018 |
| Hardware Availability: | Jun-2018 | Software Availability: | Mar-2018 | Publication: | Sep 12, 2018 |
| System Source: | Single Supplier | System Designation: | Server | Power Provisioning: | Line-powered |
| Target Load | Actual Load | ssj_ops | |
|---|---|---|---|
| Target | Actual | ||
| Calibration 1 | 40,219,375 | ||
| Calibration 2 | 40,178,197 | ||
| Calibration 3 | 40,252,014 | ||
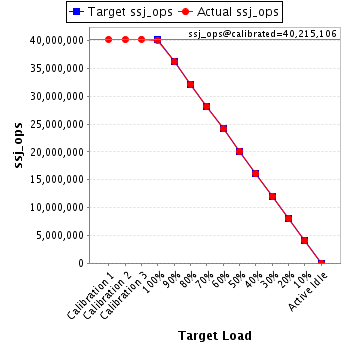
| ssj_ops@calibrated=40,215,106 | |||
| 100% | 99.7% | 40,215,106 | 40,093,763 |
| 90% | 90.0% | 36,193,595 | 36,198,419 |
| 80% | 80.0% | 32,172,084 | 32,185,690 |
| 70% | 70.0% | 28,150,574 | 28,163,591 |
| 60% | 60.0% | 24,129,063 | 24,123,321 |
| 50% | 50.0% | 20,107,553 | 20,109,890 |
| 40% | 40.0% | 16,086,042 | 16,089,006 |
| 30% | 30.0% | 12,064,532 | 12,062,401 |
| 20% | 20.0% | 8,043,021 | 8,048,252 |
| 10% | 10.0% | 4,021,511 | 4,020,426 |
| Active Idle | 0 | 0 | |
| # of Nodes | # of Chips | # of Cores | # of Threads | Total RAM (GB) | # of OS Images | # of JVM Instances |
|---|---|---|---|---|---|---|
| 7 | 14 | 392 | 784 | 1,344 | 7 | 28 |
| Set Identifier: | SUT |
| Set Description: | System Under Test |
| # of Identical Nodes: | 7 |
| Comment: | SUT |
| Hardware per Node | |
|---|---|
| Hardware Vendor: | Hewlett Packard Enterprise |
| Model: | Synergy 480 Gen10 Compute Module |
| Form Factor: | Other |
| CPU Name: | Intel Xeon Platinum 8180 2.50GHz |
| CPU Characteristics: | 28-Core, 2.50 GHz, 38.5 MB L3 Cache |
| CPU Frequency (MHz): | 2500 |
| CPU(s) Enabled: | 56 cores, 2 chips, 28 cores/chip |
| Hardware Threads: | 112 (2 / core) |
| CPU(s) Orderable: | 1,2 chips |
| Primary Cache: | 32 KB I + 32 KB D on chip per core |
| Secondary Cache: | 1 MB I+D on chip per core |
| Tertiary Cache: | 39424 KB I+D on chip per chip |
| Other Cache: | None |
| Memory Amount (GB): | 192 |
| # and size of DIMM: | 12 x 16384 MB |
| Memory Details: | 12 x 16GB 2Rx8 PC4-2666-V ECC; slots 1, 3, 5, 8, 10 and 12 populated on each CPU socket |
| Power Supply Quantity and Rating (W): | None |
| Power Supply Details: | Shared |
| Disk Drive: | 1 x HPE Synergy 480 Gen10 M.2 FIO Adapter Board Kit (873165-B21); 1 x HPE 480GB SATA 6G Read Intensive M.2 2280 SSD (875498-B21) |
| Disk Controller: | 1 x HPE Smart Array S100i SR Gen10 |
| # and type of Network Interface Cards (NICs) Installed: | 1 x HPE Synergy 3820C 10/20Gb 2-port Converged Network Adapter (777430-B21) |
| NICs Enabled in Firmware / OS / Connected: | 2/1/1 |
| Network Speed (Mbit): | 10000 |
| Keyboard: | None |
| Mouse: | None |
| Monitor: | None |
| Optical Drives: | No |
| Other Hardware: | None |
| Software per Node | |
|---|---|
| Power Management: | Enabled (see SUT Notes) |
| Operating System (OS): | Windows Server 2012 R2 Datacenter |
| OS Version: | 6.3 (Build 9600) |
| Filesystem: | NTFS |
| JVM Vendor: | Oracle Corporation |
| JVM Version: | Java HotSpot(TM) 64-Bit Server VM (build 24.80-b11, mixed mode), version 1.7.0_80 |
| JVM Command-line Options: | -server -Xmn19g -Xms21g -Xmx21g -XX:SurvivorRatio=1 -XX:TargetSurvivorRatio=99 -XX:ParallelGCThreads=28 -XX:AllocatePrefetchDistance=256 -XX:AllocatePrefetchLines=4 -XX:LoopUnrollLimit=45 -XX:InitialTenuringThreshold=12 -XX:MaxTenuringThreshold=15 -XX:InlineSmallCode=9000 -XX:MaxInlineSize=270 -XX:FreqInlineSize=6000 -XX:+UseLargePages -XX:+UseParallelOldGC -XX:+AggressiveOpts |
| JVM Affinity: | start /NODE [0,1,2,3] /AFFINITY [0xFFFFFFF] |
| JVM Instances: | 4 |
| JVM Initial Heap (MB): | 21000 |
| JVM Maximum Heap (MB): | 21000 |
| JVM Address Bits: | 64 |
| Boot Firmware Version: | I42 v1.32 (02/01/2018) |
| Management Firmware Version: | 1.15 Aug 17 2017 |
| Workload Version: | SSJ 1.2.10 |
| Director Location: | Controller |
| Other Software: | HPE Composer Version 3.10.07 (HPE OneView) with HPE Synergy Custom SPP Bundle 2017.10.20180323; Microsoft Windows KB4054519, KB4056898 |
| Host | ssj_ops@100% |
|---|---|
| NODE01 | 5,744,003 |
| NODE02 | 5,727,435 |
| NODE03 | 5,762,662 |
| NODE04 | 5,703,449 |
| NODE05 | 5,689,156 |
| NODE06 | 5,753,703 |
| NODE07 | 5,713,355 |
| ssj_ops@100% | 40,093,763 |
| ssj_ops@100% per Host | 5,727,680 |
| ssj_ops@100% per JVM | 1,431,920 |

| Target Load | Actual Load | ssj_ops | |
|---|---|---|---|
| Target | Actual | ||
| Calibration 1 | 5,779,241 | ||
| Calibration 2 | 5,754,757 | ||
| Calibration 3 | 5,772,483 | ||
| ssj_ops@calibrated=5,763,620 | |||
| 100% | 99.7% | 5,763,620 | 5,744,003 |
| 90% | 90.0% | 5,187,258 | 5,185,363 |
| 80% | 80.1% | 4,610,896 | 4,617,409 |
| 70% | 70.1% | 4,034,534 | 4,040,761 |
| 60% | 59.9% | 3,458,172 | 3,453,529 |
| 50% | 49.9% | 2,881,810 | 2,878,750 |
| 40% | 40.0% | 2,305,448 | 2,306,559 |
| 30% | 30.0% | 1,729,086 | 1,729,839 |
| 20% | 20.1% | 1,152,724 | 1,158,305 |
| 10% | 10.0% | 576,362 | 574,990 |
| Active Idle | 0 | 0 | |

| Target Load | Actual Load | ssj_ops | |
|---|---|---|---|
| Target | Actual | ||
| Calibration 1 | 5,751,106 | ||
| Calibration 2 | 5,735,499 | ||
| Calibration 3 | 5,750,682 | ||
| ssj_ops@calibrated=5,743,090 | |||
| 100% | 99.7% | 5,743,090 | 5,727,435 |
| 90% | 90.0% | 5,168,781 | 5,171,265 |
| 80% | 80.1% | 4,594,472 | 4,599,617 |
| 70% | 70.1% | 4,020,163 | 4,026,971 |
| 60% | 60.0% | 3,445,854 | 3,447,122 |
| 50% | 50.0% | 2,871,545 | 2,871,049 |
| 40% | 40.1% | 2,297,236 | 2,302,251 |
| 30% | 29.9% | 1,722,927 | 1,719,395 |
| 20% | 20.0% | 1,148,618 | 1,148,565 |
| 10% | 10.0% | 574,309 | 575,751 |
| Active Idle | 0 | 0 | |

| Target Load | Actual Load | ssj_ops | |
|---|---|---|---|
| Target | Actual | ||
| Calibration 1 | 5,777,969 | ||
| Calibration 2 | 5,773,560 | ||
| Calibration 3 | 5,783,160 | ||
| ssj_ops@calibrated=5,778,360 | |||
| 100% | 99.7% | 5,778,360 | 5,762,662 |
| 90% | 89.9% | 5,200,524 | 5,194,300 |
| 80% | 80.1% | 4,622,688 | 4,629,304 |
| 70% | 70.0% | 4,044,852 | 4,044,149 |
| 60% | 60.0% | 3,467,016 | 3,465,924 |
| 50% | 50.1% | 2,889,180 | 2,893,625 |
| 40% | 40.0% | 2,311,344 | 2,313,266 |
| 30% | 30.0% | 1,733,508 | 1,733,065 |
| 20% | 19.9% | 1,155,672 | 1,152,586 |
| 10% | 10.0% | 577,836 | 578,828 |
| Active Idle | 0 | 0 | |

| Target Load | Actual Load | ssj_ops | |
|---|---|---|---|
| Target | Actual | ||
| Calibration 1 | 5,720,722 | ||
| Calibration 2 | 5,719,573 | ||
| Calibration 3 | 5,729,146 | ||
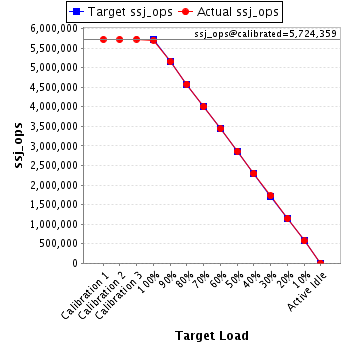
| ssj_ops@calibrated=5,724,359 | |||
| 100% | 99.6% | 5,724,359 | 5,703,449 |
| 90% | 90.1% | 5,151,923 | 5,156,239 |
| 80% | 80.0% | 4,579,488 | 4,576,692 |
| 70% | 70.0% | 4,007,052 | 4,006,043 |
| 60% | 60.0% | 3,434,616 | 3,435,783 |
| 50% | 50.0% | 2,862,180 | 2,862,743 |
| 40% | 40.0% | 2,289,744 | 2,291,495 |
| 30% | 30.1% | 1,717,308 | 1,721,871 |
| 20% | 20.0% | 1,144,872 | 1,143,723 |
| 10% | 10.0% | 572,436 | 571,237 |
| Active Idle | 0 | 0 | |
| Target Load | Actual Load | ssj_ops | |
|---|---|---|---|
| Target | Actual | ||
| Calibration 1 | 5,703,488 | ||
| Calibration 2 | 5,703,471 | ||
| Calibration 3 | 5,714,350 | ||
| ssj_ops@calibrated=5,708,910 | |||
| 100% | 99.7% | 5,708,910 | 5,689,156 |
| 90% | 90.1% | 5,138,019 | 5,144,376 |
| 80% | 80.0% | 4,567,128 | 4,565,254 |
| 70% | 70.0% | 3,996,237 | 3,996,502 |
| 60% | 59.9% | 3,425,346 | 3,422,204 |
| 50% | 50.0% | 2,854,455 | 2,852,553 |
| 40% | 39.9% | 2,283,564 | 2,280,367 |
| 30% | 30.0% | 1,712,673 | 1,711,251 |
| 20% | 20.0% | 1,141,782 | 1,141,350 |
| 10% | 10.0% | 570,891 | 571,776 |
| Active Idle | 0 | 0 | |

| Target Load | Actual Load | ssj_ops | |
|---|---|---|---|
| Target | Actual | ||
| Calibration 1 | 5,753,921 | ||
| Calibration 2 | 5,768,013 | ||
| Calibration 3 | 5,767,702 | ||
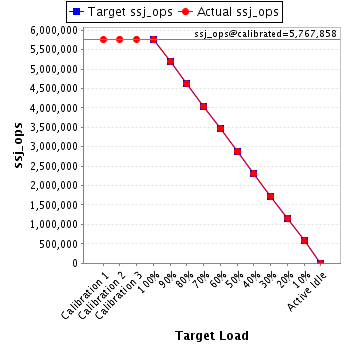
| ssj_ops@calibrated=5,767,858 | |||
| 100% | 99.8% | 5,767,858 | 5,753,703 |
| 90% | 90.0% | 5,191,072 | 5,189,616 |
| 80% | 80.0% | 4,614,286 | 4,616,686 |
| 70% | 70.0% | 4,037,500 | 4,038,400 |
| 60% | 60.1% | 3,460,715 | 3,465,771 |
| 50% | 50.0% | 2,883,929 | 2,882,657 |
| 40% | 40.0% | 2,307,143 | 2,305,237 |
| 30% | 30.0% | 1,730,357 | 1,730,044 |
| 20% | 20.0% | 1,153,572 | 1,156,349 |
| 10% | 10.0% | 576,786 | 576,919 |
| Active Idle | 0 | 0 | |
| Target Load | Actual Load | ssj_ops | |
|---|---|---|---|
| Target | Actual | ||
| Calibration 1 | 5,732,928 | ||
| Calibration 2 | 5,723,325 | ||
| Calibration 3 | 5,734,491 | ||
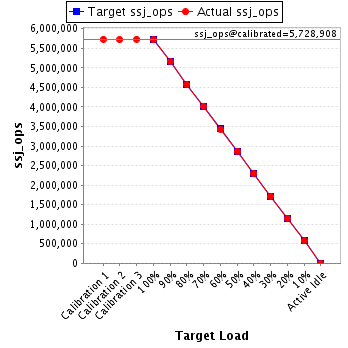
| ssj_ops@calibrated=5,728,908 | |||
| 100% | 99.7% | 5,728,908 | 5,713,355 |
| 90% | 90.0% | 5,156,017 | 5,157,261 |
| 80% | 80.0% | 4,583,126 | 4,580,729 |
| 70% | 70.0% | 4,010,235 | 4,010,765 |
| 60% | 59.9% | 3,437,345 | 3,432,988 |
| 50% | 50.1% | 2,864,454 | 2,868,514 |
| 40% | 40.0% | 2,291,563 | 2,289,831 |
| 30% | 30.0% | 1,718,672 | 1,716,937 |
| 20% | 20.0% | 1,145,782 | 1,147,375 |
| 10% | 10.0% | 572,891 | 570,924 |
| Active Idle | 0 | 0 | |