SPECpower_ssj2008
Aggregate Performance Report
Copyright © 2007-2021 Standard Performance Evaluation Corporation
| Fujitsu FUJITSU Server PRIMERGY CX2560 M6 | ssj_ops@100% = 19,762,291 ssj_ops@100% per Host = 4,940,573 ssj_ops@100% per JVM = 1,235,143 |
||||
| Test Sponsor: | Fujitsu | SPEC License #: | 19 | Test Method: | Multi Node |
| Tested By: | Fujitsu | Test Location: | Kawasaki, Kanagawa, Japan | Test Date: | Aug 6, 2021 |
| Hardware Availability: | Sep-2021 | Software Availability: | Dec-2020 | Publication: | Sep 1, 2021 |
| System Source: | Single Supplier | System Designation: | Server | Power Provisioning: | Line-powered |
| Target Load | Actual Load | ssj_ops | |
|---|---|---|---|
| Target | Actual | ||
| Calibration 1 | 14,490,974 | ||
| Calibration 2 | 19,828,902 | ||
| Calibration 3 | 19,802,051 | ||
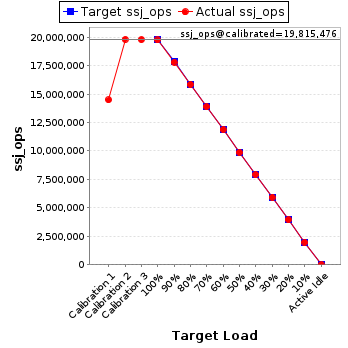
| ssj_ops@calibrated=19,815,476 | |||
| 100% | 99.7% | 19,815,476 | 19,762,291 |
| 90% | 89.9% | 17,833,929 | 17,822,302 |
| 80% | 80.0% | 15,852,381 | 15,860,766 |
| 70% | 70.2% | 13,870,833 | 13,904,810 |
| 60% | 60.0% | 11,889,286 | 11,895,706 |
| 50% | 50.0% | 9,907,738 | 9,899,337 |
| 40% | 40.0% | 7,926,191 | 7,920,473 |
| 30% | 30.0% | 5,944,643 | 5,940,102 |
| 20% | 20.0% | 3,963,095 | 3,961,149 |
| 10% | 10.0% | 1,981,548 | 1,980,785 |
| Active Idle | 0 | 0 | |
| # of Nodes | # of Chips | # of Cores | # of Threads | Total RAM (GB) | # of OS Images | # of JVM Instances |
|---|---|---|---|---|---|---|
| 4 | 8 | 192 | 384 | 1,024 | 4 | 16 |
| Set Identifier: | CX2560M6 |
| Set Description: | System Under Test |
| # of Identical Nodes: | 4 |
| Comment: | Multi Node |
| Hardware per Node | |
|---|---|
| Hardware Vendor: | Fujitsu |
| Model: | FUJITSU Server PRIMERGY CX2560 M6 |
| Form Factor: | Blade |
| CPU Name: | Intel Xeon Gold 5318Y |
| CPU Characteristics: | 24-Core, 2.10GHz, 36MB L3 Cache |
| CPU Frequency (MHz): | 2100 |
| CPU(s) Enabled: | 48 cores, 2 chips, 24 cores/chip |
| Hardware Threads: | 96 (2 / core) |
| CPU(s) Orderable: | 1,2 chips |
| Primary Cache: | 32 KB I + 48 KB D on chip per core |
| Secondary Cache: | 1280 KB I+D on chip per core |
| Tertiary Cache: | 36 MB I+D on chip per chip |
| Other Cache: | None |
| Memory Amount (GB): | 256 |
| # and size of DIMM: | 16 x 16384 MB |
| Memory Details: | 16 x 16 GB 2Rx8 PC4-3200Y-R; slots 1A, 1B, 1C, 1D, 1E, 1F, 1G, 1H, 1J, 1K, 1L, 1M, 1N, 1P, 1Q, 1R populated |
| Power Supply Quantity and Rating (W): | None |
| Power Supply Details: | N/A |
| Disk Drive: | 1 x SSD M.2 240GB, S26361-F5787-E240 |
| Disk Controller: | Integrated sSATA Controller |
| # and type of Network Interface Cards (NICs) Installed: | 1 x Intel(R) 10Gb X550T Gigabit Network Connection (onboard) |
| NICs Enabled in Firmware / OS / Connected: | 1/1/1 |
| Network Speed (Mbit): | 10000 |
| Keyboard: | None |
| Mouse: | None |
| Monitor: | None |
| Optical Drives: | No |
| Other Hardware: | None |
| Software per Node | |
|---|---|
| Power Management: | Enabled (see SUT Notes) |
| Operating System (OS): | SUSE Linux Enterprise Server 15 SP2 |
| OS Version: | 5.3.18-24.43-default |
| Filesystem: | btrfs |
| JVM Vendor: | Oracle Corporation |
| JVM Version: | Oracle Java HotSpot(TM) 64-Bit Server VM 18.9 (build 11.0.9+7-LTS, mixed mode) |
| JVM Command-line Options: | -server -Xmn20000m -Xms22000m -Xmx22000m -XX:+UseHugeTLBFS -XX:+UseLargePages -XX:+UseTransparentHugePages -XX:AllocatePrefetchDistance=256 -XX:AllocatePrefetchInstr=0 -XX:AllocatePrefetchLines=4 -XX:InlineSmallCode=3900 -XX:MaxInlineSize=270 -XX:ParallelGCThreads=8 -XX:SurvivorRatio=1 -XX:TargetSurvivorRatio=99 -XX:+UseParallelOldGC -XX:FreqInlineSize=2500 -XX:MinJumpTableSize=18 -XX:UseAVX=0 -XX:+UseBiasedLocking |
| JVM Affinity: | chrt -r 1 taskset -c [(0,1,2,3,4,5,6,7,8,9,10,11,48,49,50,51,52,53,54,55,56,57,58), (12,13,14,15,16,17,18,19,20,21,22,23,60,61,62,63,64,65,66,67,68,69,70), (24,25,26,27,28,29,30,31,32,33,34,35,72,73,74,75,76,77,78,79,80,81,82), (36,37,38,39,40,41,42,43,44,45,46,47,84,85,86,87,88,89,90,91,92,93,94)] numactl --membind=[0-3] |
| JVM Instances: | 4 |
| JVM Initial Heap (MB): | 22000 |
| JVM Maximum Heap (MB): | 22000 |
| JVM Address Bits: | 64 |
| Boot Firmware Version: | R1.23.0 |
| Management Firmware Version: | 3.26P |
| Workload Version: | SSJ 1.2.10 |
| Director Location: | Controller |
| Other Software: | None |
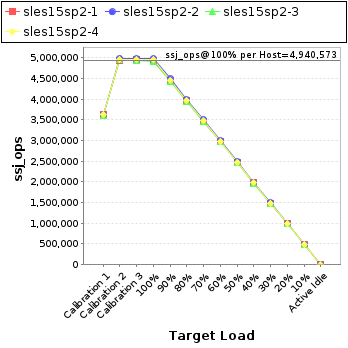
| Host | ssj_ops@100% |
|---|---|
| sles15sp2-1 | 4,924,096 |
| sles15sp2-2 | 4,978,215 |
| sles15sp2-3 | 4,909,458 |
| sles15sp2-4 | 4,950,523 |
| ssj_ops@100% | 19,762,291 |
| ssj_ops@100% per Host | 4,940,573 |
| ssj_ops@100% per JVM | 1,235,143 |
| Target Load | Actual Load | ssj_ops | |
|---|---|---|---|
| Target | Actual | ||
| Calibration 1 | 3,623,106 | ||
| Calibration 2 | 4,938,455 | ||
| Calibration 3 | 4,943,805 | ||
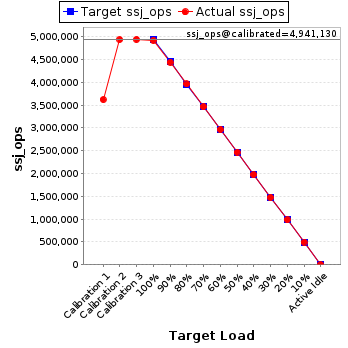
| ssj_ops@calibrated=4,941,130 | |||
| 100% | 99.7% | 4,941,130 | 4,924,096 |
| 90% | 89.9% | 4,447,017 | 4,441,852 |
| 80% | 80.2% | 3,952,904 | 3,962,335 |
| 70% | 70.2% | 3,458,791 | 3,466,420 |
| 60% | 60.1% | 2,964,678 | 2,968,225 |
| 50% | 50.0% | 2,470,565 | 2,469,109 |
| 40% | 40.0% | 1,976,452 | 1,974,378 |
| 30% | 29.9% | 1,482,339 | 1,478,760 |
| 20% | 19.9% | 988,226 | 984,797 |
| 10% | 10.1% | 494,113 | 497,007 |
| Active Idle | 0 | 0 | |
| Target Load | Actual Load | ssj_ops | |
|---|---|---|---|
| Target | Actual | ||
| Calibration 1 | 3,631,407 | ||
| Calibration 2 | 4,985,457 | ||
| Calibration 3 | 4,976,007 | ||
| ssj_ops@calibrated=4,980,732 | |||
| 100% | 99.9% | 4,980,732 | 4,978,215 |
| 90% | 90.1% | 4,482,659 | 4,485,353 |
| 80% | 79.9% | 3,984,585 | 3,980,478 |
| 70% | 70.3% | 3,486,512 | 3,503,680 |
| 60% | 60.0% | 2,988,439 | 2,988,472 |
| 50% | 50.0% | 2,490,366 | 2,489,686 |
| 40% | 40.0% | 1,992,293 | 1,990,091 |
| 30% | 30.0% | 1,494,220 | 1,492,150 |
| 20% | 20.0% | 996,146 | 996,827 |
| 10% | 10.0% | 498,073 | 498,054 |
| Active Idle | 0 | 0 | |

| Target Load | Actual Load | ssj_ops | |
|---|---|---|---|
| Target | Actual | ||
| Calibration 1 | 3,599,554 | ||
| Calibration 2 | 4,945,006 | ||
| Calibration 3 | 4,923,086 | ||
| ssj_ops@calibrated=4,934,046 | |||
| 100% | 99.5% | 4,934,046 | 4,909,458 |
| 90% | 89.9% | 4,440,641 | 4,435,401 |
| 80% | 79.9% | 3,947,237 | 3,943,860 |
| 70% | 70.2% | 3,453,832 | 3,463,803 |
| 60% | 60.1% | 2,960,428 | 2,963,617 |
| 50% | 49.9% | 2,467,023 | 2,462,354 |
| 40% | 39.9% | 1,973,618 | 1,969,746 |
| 30% | 30.0% | 1,480,214 | 1,479,921 |
| 20% | 20.0% | 986,809 | 986,907 |
| 10% | 10.0% | 493,405 | 491,118 |
| Active Idle | 0 | 0 | |

| Target Load | Actual Load | ssj_ops | |
|---|---|---|---|
| Target | Actual | ||
| Calibration 1 | 3,636,907 | ||
| Calibration 2 | 4,959,985 | ||
| Calibration 3 | 4,959,153 | ||
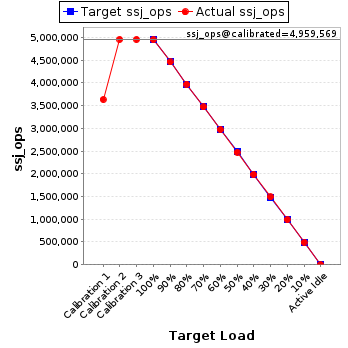
| ssj_ops@calibrated=4,959,569 | |||
| 100% | 99.8% | 4,959,569 | 4,950,523 |
| 90% | 89.9% | 4,463,612 | 4,459,696 |
| 80% | 80.1% | 3,967,655 | 3,974,094 |
| 70% | 70.0% | 3,471,698 | 3,470,907 |
| 60% | 60.0% | 2,975,741 | 2,975,392 |
| 50% | 50.0% | 2,479,784 | 2,478,188 |
| 40% | 40.0% | 1,983,828 | 1,986,258 |
| 30% | 30.0% | 1,487,871 | 1,489,272 |
| 20% | 20.0% | 991,914 | 992,618 |
| 10% | 10.0% | 495,957 | 494,605 |
| Active Idle | 0 | 0 | |