SPECpower_ssj2008
Aggregate Performance Report
Copyright © 2007-2009 Standard Performance Evaluation Corporation
| Hewlett-Packard Company ProLiant SL2x170z G6 (2.4 GHz, Intel Xeon L5530) | ssj_ops@100% = 2,111,524 ssj_ops@100% per Host = 527,881 ssj_ops@100% per JVM = 131,970 |
||||
| Test Sponsor: | Hewlett-Packard Company | SPEC License #: | 3 | Test Method: | Multi Node |
| Tested By: | Hewlett-Packard Company | Test Location: | Houston, TX, USA | Test Date: | Sep 3, 2009 |
| Hardware Availability: | Oct-2009 | Software Availability: | Jul-2009 | Publication: | Nov 4, 2009 |
| System Source: | Single Supplier | System Designation: | Server | Power Provisioning: | Line-powered |
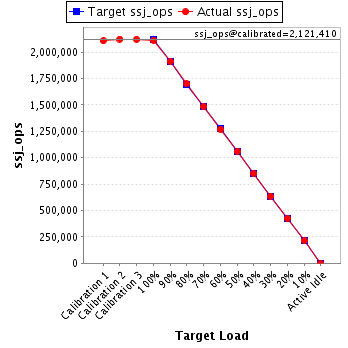
| Target Load | Actual Load | ssj_ops | |
|---|---|---|---|
| Target | Actual | ||
| Calibration 1 | 2,106,041 | ||
| Calibration 2 | 2,122,065 | ||
| Calibration 3 | 2,120,756 | ||
| ssj_ops@calibrated=2,121,410 | |||
| 100% | 99.5% | 2,121,410 | 2,111,524 |
| 90% | 90.2% | 1,909,269 | 1,913,028 |
| 80% | 80.1% | 1,697,128 | 1,698,956 |
| 70% | 69.9% | 1,484,987 | 1,482,850 |
| 60% | 59.9% | 1,272,846 | 1,271,199 |
| 50% | 50.0% | 1,060,705 | 1,060,015 |
| 40% | 40.0% | 848,564 | 847,741 |
| 30% | 30.0% | 636,423 | 636,631 |
| 20% | 20.1% | 424,282 | 425,742 |
| 10% | 10.1% | 212,141 | 213,974 |
| Active Idle | 0 | 0 | |
| # of Nodes | # of Chips | # of Cores | # of Threads | Total RAM (GB) | # of OS Images | # of JVM Instances |
|---|---|---|---|---|---|---|
| 4 | 8 | 32 | 64 | 32.0 | 4 | 16 |
| Set Identifier: | sut |
| Set Description: | ProLiant SL2x170z G6 |
| # of Identical Nodes: | 4 |
| Comment: | None |
| Hardware per Node | |
|---|---|
| Hardware Vendor: | Hewlett-Packard Company |
| Model: | ProLiant SL2x170z G6 (2.4 GHz, Intel Xeon L5530) |
| Form Factor: | 2U |
| CPU Name: | Intel Xeon L5530 |
| CPU Characteristics: | Quad-Core, 2.40 GHz, 8 MB L3 cache |
| CPU Frequency (MHz): | 2400 |
| CPU(s) Enabled: | 8 cores, 2 chips, 4 cores/chip |
| Hardware Threads: | 16 (2 / core) |
| CPU(s) Orderable: | 1,2 chips |
| Primary Cache: | 32 KB I + 32 KB D on chip per core |
| Secondary Cache: | 256 KB I+D on chip per core |
| Tertiary Cache: | 8 MB I+D on chip per chip |
| Other Cache: | None |
| Memory Amount (GB): | 8 |
| # and size of DIMM: | 4 x 2048 MB |
| Memory Details: | 2GB 2Rx8 PC3-10600E; slots 1 and 4 are populated on each processor |
| Power Supply Quantity and Rating (W): | None |
| Power Supply Details: | Shared |
| Disk Drive: | 1 x 60GB SSD 2.5" SATA, HP part #:586585-B21 |
| Disk Controller: | Integrated SATA |
| # and type of Network Interface Cards (NICs) Installed: | 2 x HP NC362i Dual Port Multifunction Gigabit Server Adapters |
| NICs Enabled in Firmware / OS / Connected: | 2/2/1 |
| Network Speed (Mbit): | 1000 |
| Keyboard: | None |
| Mouse: | None |
| Monitor: | None |
| Optical Drives: | No |
| Other Hardware: | None |
| Software per Node | |
|---|---|
| Power Management: | Power saver plan in OS |
| Operating System (OS): | Windows Server 2008 x64, Enterprise Edition |
| OS Version: | SP2 |
| Filesystem: | NTFS |
| JVM Vendor: | IBM Corporation |
| JVM Version: | IBM J9 VM (build 2.4, J2RE 1.6.0 IBM J9 2.4 Windows Server 2008 amd64-64 jvmwa6460sr5-20090519_35743 (JIT enabled, AOT enabled) |
| JVM Command-line Options: | -Xaggressive -Xcompressedrefs -Xgcpolicy:gencon -Xmn1100m -Xms1600m -Xmx1600m -XlockReservation -Xnoloa -XtlhPrefetch -Xlp -Xgcthreads4 |
| JVM Affinity: | start /affinity [0xF, 0xF0, 0xF00, 0xF000] |
| JVM Instances: | 4 |
| JVM Initial Heap (MB): | 1600 |
| JVM Maximum Heap (MB): | 1600 |
| JVM Address Bits: | 64 |
| Boot Firmware Version: | O34 8/25/09 |
| Management Firmware Version: | 4.04 7/1/09 |
| Workload Version: | SSJ 1.2.6 |
| Director Location: | Controller |
| Other Software: | NIC driver, HP component cp010296.exe. Driver version: 10.3.49.400 |
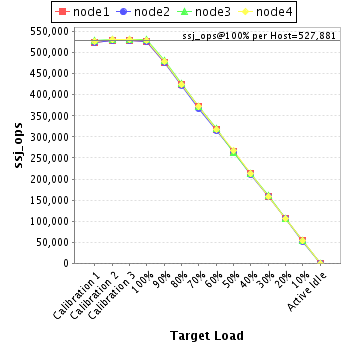
| Host | ssj_ops@100% |
|---|---|
| node1 | 525,961 |
| node2 | 526,118 |
| node3 | 530,294 |
| node4 | 529,152 |
| ssj_ops@100% | 2,111,524 |
| ssj_ops@100% per Host | 527,881 |
| ssj_ops@100% per JVM | 131,970 |
| Target Load | Actual Load | ssj_ops | |
|---|---|---|---|
| Target | Actual | ||
| Calibration 1 | 525,181 | ||
| Calibration 2 | 529,957 | ||
| Calibration 3 | 529,509 | ||
| ssj_ops@calibrated=529,733 | |||
| 100% | 99.3% | 529,733 | 525,961 |
| 90% | 90.0% | 476,760 | 476,700 |
| 80% | 80.3% | 423,786 | 425,525 |
| 70% | 70.1% | 370,813 | 371,486 |
| 60% | 60.2% | 317,840 | 318,734 |
| 50% | 50.2% | 264,866 | 265,815 |
| 40% | 40.0% | 211,893 | 212,044 |
| 30% | 30.0% | 158,920 | 158,985 |
| 20% | 20.1% | 105,947 | 106,664 |
| 10% | 10.2% | 52,973 | 54,182 |
| Active Idle | 0 | 0 | |

| Target Load | Actual Load | ssj_ops | |
|---|---|---|---|
| Target | Actual | ||
| Calibration 1 | 524,703 | ||
| Calibration 2 | 528,837 | ||
| Calibration 3 | 528,183 | ||
| ssj_ops@calibrated=528,510 | |||
| 100% | 99.5% | 528,510 | 526,118 |
| 90% | 90.2% | 475,659 | 476,857 |
| 80% | 80.0% | 422,808 | 422,923 |
| 70% | 69.5% | 369,957 | 367,233 |
| 60% | 59.5% | 317,106 | 314,653 |
| 50% | 50.0% | 264,255 | 264,264 |
| 40% | 40.0% | 211,404 | 211,473 |
| 30% | 30.1% | 158,553 | 159,308 |
| 20% | 20.1% | 105,702 | 106,148 |
| 10% | 9.9% | 52,851 | 52,080 |
| Active Idle | 0 | 0 | |

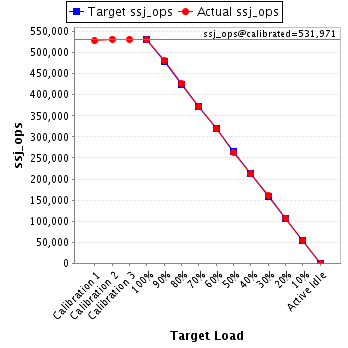
| Target Load | Actual Load | ssj_ops | |
|---|---|---|---|
| Target | Actual | ||
| Calibration 1 | 528,532 | ||
| Calibration 2 | 532,028 | ||
| Calibration 3 | 531,913 | ||
| ssj_ops@calibrated=531,971 | |||
| 100% | 99.7% | 531,971 | 530,294 |
| 90% | 90.3% | 478,773 | 480,285 |
| 80% | 80.2% | 425,576 | 426,484 |
| 70% | 69.8% | 372,379 | 371,379 |
| 60% | 60.1% | 319,182 | 319,961 |
| 50% | 49.5% | 265,985 | 263,330 |
| 40% | 39.9% | 212,788 | 212,020 |
| 30% | 30.0% | 159,591 | 159,690 |
| 20% | 20.0% | 106,394 | 106,568 |
| 10% | 10.3% | 53,197 | 54,714 |
| Active Idle | 0 | 0 | |
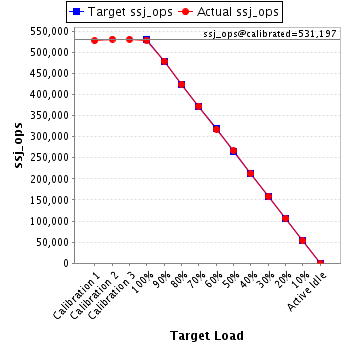
| Target Load | Actual Load | ssj_ops | |
|---|---|---|---|
| Target | Actual | ||
| Calibration 1 | 527,626 | ||
| Calibration 2 | 531,243 | ||
| Calibration 3 | 531,150 | ||
| ssj_ops@calibrated=531,197 | |||
| 100% | 99.6% | 531,197 | 529,152 |
| 90% | 90.2% | 478,077 | 479,186 |
| 80% | 79.8% | 424,957 | 424,023 |
| 70% | 70.2% | 371,838 | 372,752 |
| 60% | 59.8% | 318,718 | 317,851 |
| 50% | 50.2% | 265,598 | 266,606 |
| 40% | 39.9% | 212,479 | 212,204 |
| 30% | 29.9% | 159,359 | 158,648 |
| 20% | 20.0% | 106,239 | 106,363 |
| 10% | 10.0% | 53,120 | 52,998 |
| Active Idle | 0 | 0 | |