
SPECpower_ssj2008
Host 'DL360GEN10' Performance Report
Copyright © 2007-2017 Standard Performance Evaluation Corporation
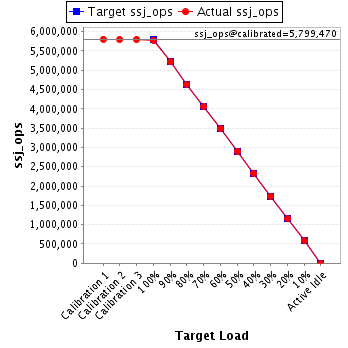
| Hewlett Packard Enterprise ProLiant DL360 Gen10 | ssj_ops@100% = 5,779,630 ssj_ops@100% per JVM = 1,444,907 |
||||
| Test Sponsor: | Hewlett Packard Enterprise | SPEC License #: | 3 | Test Method: | Single Node |
| Tested By: | Hewlett Packard Enterprise | Test Location: | Houston, TX, USA | Test Date: | Jun 28, 2017 |
| Hardware Availability: | Sep-2017 | Software Availability: | Jan-2015 | Publication: | Jul 19, 2017 |
| System Source: | Single Supplier | System Designation: | Server | Power Provisioning: | Line-powered |
| Target Load | Actual Load | ssj_ops | |
|---|---|---|---|
| Target | Actual | ||
| Calibration 1 | 5,805,185 | ||
| Calibration 2 | 5,798,570 | ||
| Calibration 3 | 5,800,370 | ||
| ssj_ops@calibrated=5,799,470 | |||
| 100% | 99.7% | 5,799,470 | 5,779,630 |
| 90% | 89.9% | 5,219,523 | 5,214,638 |
| 80% | 79.8% | 4,639,576 | 4,629,746 |
| 70% | 70.0% | 4,059,629 | 4,061,208 |
| 60% | 60.1% | 3,479,682 | 3,483,129 |
| 50% | 50.0% | 2,899,735 | 2,901,407 |
| 40% | 40.0% | 2,319,788 | 2,321,436 |
| 30% | 30.0% | 1,739,841 | 1,737,318 |
| 20% | 20.0% | 1,159,894 | 1,162,148 |
| 10% | 10.0% | 579,947 | 581,133 |
| Active Idle | 0 | 0 | |
| Set Identifier: | SUT |
| Set Description: | System Under Test |
| # of Identical Nodes: | 1 |
| Comment: | SUT |
| Hardware | |
|---|---|
| Hardware Vendor: | Hewlett Packard Enterprise |
| Model: | ProLiant DL360 Gen10 |
| Form Factor: | 1U |
| CPU Name: | Intel Xeon Platinum 8180 2.50GHz |
| CPU Characteristics: | 28-Core, 2.50 GHz, 38.5MB L3 Cache |
| CPU Frequency (MHz): | 2500 |
| CPU(s) Enabled: | 56 cores, 2 chips, 28 cores/chip |
| Hardware Threads: | 112 (2 / core) |
| CPU(s) Orderable: | 1,2 chip |
| Primary Cache: | 32 KB I + 32 KB D on chip per core |
| Secondary Cache: | 1 MB I+D on chip per core |
| Tertiary Cache: | 39424 KB I+D on chip per chip |
| Other Cache: | None |
| Memory Amount (GB): | 96 |
| # and size of DIMM: | 12 x 8182 MB |
| Memory Details: | 12 x 8GB 2Rx8 PC4-2666V-R; slots 1, 3, 5, 8, 10, and 12 populated in each socket |
| Power Supply Quantity and Rating (W): | 1 x 800 |
| Power Supply Details: | DPS-800AB (865438-B21) 96% |
| Disk Drive: | 1 x HPE 340GB SATA RI UFF M.2 Kit (815606-B21) |
| Disk Controller: | Embedded SATA Controller |
| # and type of Network Interface Cards (NICs) Installed: | 1 x HPE Ethernet 1Gb 4-port 331i Adapter |
| NICs Enabled in Firmware / OS / Connected: | 4/1/1 |
| Network Speed (Mbit): | 1000 |
| Keyboard: | None |
| Mouse: | None |
| Monitor: | None |
| Optical Drives: | No |
| Other Hardware: | None |
| Software | |
|---|---|
| Power Management: | Enabled (see SUT Notes) |
| Operating System (OS): | Windows Server 2012 R2 Datacenter |
| OS Version: | Version 6.3 (Build 9600) |
| Filesystem: | NTFS |
| JVM Vendor: | Oracle Corporation |
| JVM Version: | Java HotSpot(TM) 64-Bit Server VM (build 24.80-b11, mixed mode), version 1.7.0_80 |
| JVM Command-line Options: | -server -Xmn17000m -Xms19000m -Xmx19000m -Xmn11g -XX:SurvivorRatio=1 -XX:TargetSurvivorRatio=99 -XX:ParallelGCThreads=24 -XX:AllocatePrefetchDistance=256 -XX:AllocatePrefetchLines=4 -XX:LoopUnrollLimit=45 -XX:InitialTenuringThreshold=12 -XX:MaxTenuringThreshold=15 -XX:InlineSmallCode=9000 -XX:MaxInlineSize=270 -XX:FreqInlineSize=6000 -XX:+UseLargePages -XX:+UseParallelOldGC -XX:+AggressiveOpts -XX:+OptimizeStringConcat -XX:+UseStringCache |
| JVM Affinity: | start /NODE [0,1,2,3] /AFFINITY [0xFFFFFFF] |
| JVM Instances: | 4 |
| JVM Initial Heap (MB): | 19000 |
| JVM Maximum Heap (MB): | 19000 |
| JVM Address Bits: | 64 |
| Boot Firmware Version: | U32 v1.00 (05/22/2017) |
| Management Firmware Version: | 1.10 pass 67 May 05 2017 |
| Workload Version: | SSJ 1.2.10 |
| Director Location: | Controller |
| Other Software: | None |
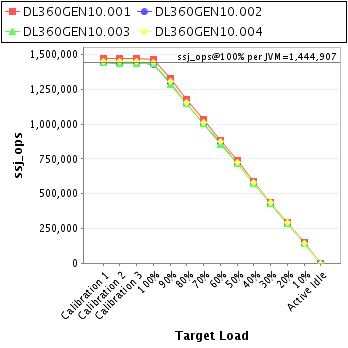
| JVM Instance | ssj_ops@100% |
|---|---|
| DL360GEN10.001 | 1,468,382 |
| DL360GEN10.002 | 1,431,829 |
| DL360GEN10.003 | 1,435,229 |
| DL360GEN10.004 | 1,444,189 |
| ssj_ops@100% | 5,779,630 |
| ssj_ops@100% per JVM | 1,444,907 |
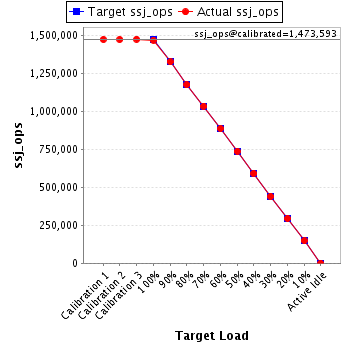
| Target Load | Actual Load | ssj_ops | |
|---|---|---|---|
| Target | Actual | ||
| Calibration 1 | 1,472,946 | ||
| Calibration 2 | 1,472,375 | ||
| Calibration 3 | 1,474,810 | ||
| ssj_ops@calibrated=1,473,593 | |||
| 100% | 99.6% | 1,473,593 | 1,468,382 |
| 90% | 90.0% | 1,326,233 | 1,325,588 |
| 80% | 79.7% | 1,178,874 | 1,174,768 |
| 70% | 70.2% | 1,031,515 | 1,034,812 |
| 60% | 60.1% | 884,156 | 886,229 |
| 50% | 50.0% | 736,796 | 737,386 |
| 40% | 40.1% | 589,437 | 590,421 |
| 30% | 29.9% | 442,078 | 439,904 |
| 20% | 20.0% | 294,719 | 294,948 |
| 10% | 10.0% | 147,359 | 148,081 |
| Active Idle | 0 | 0 | |
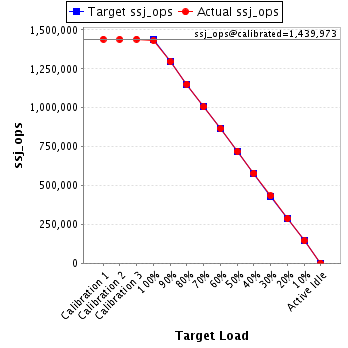
| Target Load | Actual Load | ssj_ops | |
|---|---|---|---|
| Target | Actual | ||
| Calibration 1 | 1,440,401 | ||
| Calibration 2 | 1,439,158 | ||
| Calibration 3 | 1,440,788 | ||
| ssj_ops@calibrated=1,439,973 | |||
| 100% | 99.4% | 1,439,973 | 1,431,829 |
| 90% | 90.0% | 1,295,975 | 1,296,385 |
| 80% | 79.9% | 1,151,978 | 1,150,708 |
| 70% | 69.8% | 1,007,981 | 1,005,664 |
| 60% | 60.2% | 863,984 | 866,331 |
| 50% | 50.0% | 719,986 | 719,485 |
| 40% | 40.1% | 575,989 | 577,982 |
| 30% | 30.1% | 431,992 | 432,802 |
| 20% | 20.0% | 287,995 | 287,889 |
| 10% | 10.1% | 143,997 | 145,177 |
| Active Idle | 0 | 0 | |
| Target Load | Actual Load | ssj_ops | |
|---|---|---|---|
| Target | Actual | ||
| Calibration 1 | 1,440,430 | ||
| Calibration 2 | 1,435,350 | ||
| Calibration 3 | 1,434,184 | ||
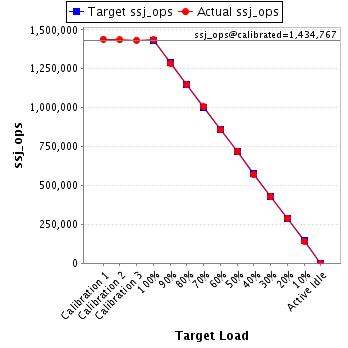
| ssj_ops@calibrated=1,434,767 | |||
| 100% | 100.0% | 1,434,767 | 1,435,229 |
| 90% | 89.6% | 1,291,290 | 1,286,158 |
| 80% | 79.9% | 1,147,814 | 1,145,983 |
| 70% | 70.1% | 1,004,337 | 1,005,664 |
| 60% | 59.7% | 860,860 | 856,833 |
| 50% | 50.1% | 717,383 | 719,145 |
| 40% | 39.8% | 573,907 | 571,326 |
| 30% | 29.9% | 430,430 | 428,916 |
| 20% | 20.2% | 286,953 | 289,516 |
| 10% | 10.0% | 143,477 | 143,067 |
| Active Idle | 0 | 0 | |
| Target Load | Actual Load | ssj_ops | |
|---|---|---|---|
| Target | Actual | ||
| Calibration 1 | 1,451,409 | ||
| Calibration 2 | 1,451,687 | ||
| Calibration 3 | 1,450,588 | ||
| ssj_ops@calibrated=1,451,138 | |||
| 100% | 99.5% | 1,451,138 | 1,444,189 |
| 90% | 90.0% | 1,306,024 | 1,306,507 |
| 80% | 79.8% | 1,160,910 | 1,158,287 |
| 70% | 69.9% | 1,015,796 | 1,015,068 |
| 60% | 60.2% | 870,683 | 873,736 |
| 50% | 50.0% | 725,569 | 725,392 |
| 40% | 40.1% | 580,455 | 581,707 |
| 30% | 30.0% | 435,341 | 435,695 |
| 20% | 20.0% | 290,228 | 289,795 |
| 10% | 10.0% | 145,114 | 144,808 |
| Active Idle | 0 | 0 | |
