
SPECpower_ssj2008
Aggregate Performance Report
Copyright © 2007-2018 Standard Performance Evaluation Corporation
| Hewlett Packard Enterprise Synergy 480 Gen10 Compute Module | ssj_ops@100% = 51,525,769 ssj_ops@100% per Host = 5,725,085 ssj_ops@100% per JVM = 1,431,271 |
||||
| Test Sponsor: | Hewlett Packard Enterprise | SPEC License #: | 3 | Test Method: | Multi Node |
| Tested By: | Hewlett Packard Enterprise | Test Location: | Houston, TX, USA | Test Date: | Aug 26, 2018 |
| Hardware Availability: | Jun-2018 | Software Availability: | Mar-2018 | Publication: | Sep 12, 2018 |
| System Source: | Single Supplier | System Designation: | Server | Power Provisioning: | Line-powered |
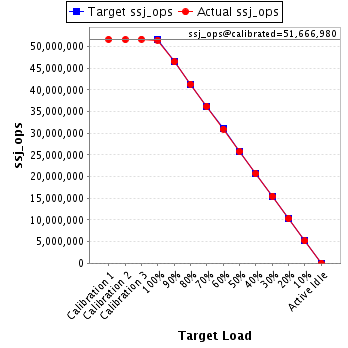
| Target Load | Actual Load | ssj_ops | |
|---|---|---|---|
| Target | Actual | ||
| Calibration 1 | 51,676,308 | ||
| Calibration 2 | 51,615,642 | ||
| Calibration 3 | 51,718,319 | ||
| ssj_ops@calibrated=51,666,980 | |||
| 100% | 99.7% | 51,666,980 | 51,525,769 |
| 90% | 90.0% | 46,500,282 | 46,514,542 |
| 80% | 80.0% | 41,333,584 | 41,342,285 |
| 70% | 70.0% | 36,166,886 | 36,167,741 |
| 60% | 59.9% | 31,000,188 | 30,972,778 |
| 50% | 50.0% | 25,833,490 | 25,824,345 |
| 40% | 40.0% | 20,666,792 | 20,660,753 |
| 30% | 30.0% | 15,500,094 | 15,486,508 |
| 20% | 20.0% | 10,333,396 | 10,343,727 |
| 10% | 10.0% | 5,166,698 | 5,162,153 |
| Active Idle | 0 | 0 | |
| # of Nodes | # of Chips | # of Cores | # of Threads | Total RAM (GB) | # of OS Images | # of JVM Instances |
|---|---|---|---|---|---|---|
| 9 | 18 | 504 | 1,008 | 1,728 | 9 | 36 |
| Set Identifier: | SUT |
| Set Description: | System Under Test |
| # of Identical Nodes: | 9 |
| Comment: | SUT |
| Hardware per Node | |
|---|---|
| Hardware Vendor: | Hewlett Packard Enterprise |
| Model: | Synergy 480 Gen10 Compute Module |
| Form Factor: | Other |
| CPU Name: | Intel Xeon Platinum 8180 2.50GHz |
| CPU Characteristics: | 28-Core, 2.50 GHz, 38.5 MB L3 Cache |
| CPU Frequency (MHz): | 2500 |
| CPU(s) Enabled: | 56 cores, 2 chips, 28 cores/chip |
| Hardware Threads: | 112 (2 / core) |
| CPU(s) Orderable: | 1,2 chips |
| Primary Cache: | 32 KB I + 32 KB D on chip per core |
| Secondary Cache: | 1 MB I+D on chip per core |
| Tertiary Cache: | 39424 KB I+D on chip per chip |
| Other Cache: | None |
| Memory Amount (GB): | 192 |
| # and size of DIMM: | 12 x 16384 MB |
| Memory Details: | 12 x 16GB 2Rx8 PC4-2666-V ECC; slots 1, 3, 5, 8, 10 and 12 populated on each CPU socket |
| Power Supply Quantity and Rating (W): | None |
| Power Supply Details: | Shared |
| Disk Drive: | 1 x HPE Synergy 480 Gen10 M.2 FIO Adapter Board Kit (873165-B21); 1 x HPE 480GB SATA 6G Read Intensive M.2 2280 SSD (875498-B21) |
| Disk Controller: | 1 x HPE Smart Array S100i SR Gen10 |
| # and type of Network Interface Cards (NICs) Installed: | 1 x HPE Synergy 3820C 10/20Gb 2-port Converged Network Adapter (777430-B21) |
| NICs Enabled in Firmware / OS / Connected: | 2/1/1 |
| Network Speed (Mbit): | 10000 |
| Keyboard: | None |
| Mouse: | None |
| Monitor: | None |
| Optical Drives: | No |
| Other Hardware: | None |
| Software per Node | |
|---|---|
| Power Management: | Enabled (see SUT Notes) |
| Operating System (OS): | Windows Server 2012 R2 Datacenter |
| OS Version: | 6.3 (Build 9600) |
| Filesystem: | NTFS |
| JVM Vendor: | Oracle Corporation |
| JVM Version: | Java HotSpot(TM) 64-Bit Server VM (build 24.80-b11, mixed mode), version 1.7.0_80 |
| JVM Command-line Options: | -server -Xmn19g -Xms21g -Xmx21g -XX:SurvivorRatio=1 -XX:TargetSurvivorRatio=99 -XX:ParallelGCThreads=28 -XX:AllocatePrefetchDistance=256 -XX:AllocatePrefetchLines=4 -XX:LoopUnrollLimit=45 -XX:InitialTenuringThreshold=12 -XX:MaxTenuringThreshold=15 -XX:InlineSmallCode=9000 -XX:MaxInlineSize=270 -XX:FreqInlineSize=6000 -XX:+UseLargePages -XX:+UseParallelOldGC -XX:+AggressiveOpts |
| JVM Affinity: | start /NODE [0,1,2,3] /AFFINITY [0xFFFFFFF] |
| JVM Instances: | 4 |
| JVM Initial Heap (MB): | 21000 |
| JVM Maximum Heap (MB): | 21000 |
| JVM Address Bits: | 64 |
| Boot Firmware Version: | I42 v1.32 (02/01/2018) |
| Management Firmware Version: | 1.15 Aug 17 2017 |
| Workload Version: | SSJ 1.2.10 |
| Director Location: | Controller |
| Other Software: | HPE Composer Version 3.10.07 (HPE OneView) with HPE Synergy Custom SPP Bundle 2017.10.20180323; Microsoft Windows KB4054519, KB4056898 |
| Host | ssj_ops@100% |
|---|---|
| NODE01 | 5,756,094 |
| NODE02 | 5,721,337 |
| NODE03 | 5,709,759 |
| NODE04 | 5,747,101 |
| NODE05 | 5,687,420 |
| NODE06 | 5,730,461 |
| NODE07 | 5,700,624 |
| NODE08 | 5,718,172 |
| NODE09 | 5,754,801 |
| ssj_ops@100% | 51,525,769 |
| ssj_ops@100% per Host | 5,725,085 |
| ssj_ops@100% per JVM | 1,431,271 |
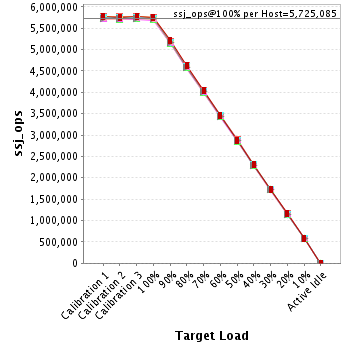
| Target Load | Actual Load | ssj_ops | |
|---|---|---|---|
| Target | Actual | ||
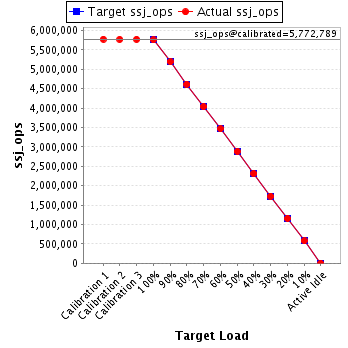
| Calibration 1 | 5,777,214 | ||
| Calibration 2 | 5,771,210 | ||
| Calibration 3 | 5,774,369 | ||
| ssj_ops@calibrated=5,772,789 | |||
| 100% | 99.7% | 5,772,789 | 5,756,094 |
| 90% | 90.0% | 5,195,510 | 5,195,490 |
| 80% | 80.0% | 4,618,231 | 4,616,323 |
| 70% | 69.9% | 4,040,953 | 4,037,051 |
| 60% | 60.0% | 3,463,674 | 3,464,672 |
| 50% | 50.0% | 2,886,395 | 2,884,614 |
| 40% | 40.0% | 2,309,116 | 2,308,463 |
| 30% | 30.0% | 1,731,837 | 1,732,257 |
| 20% | 20.0% | 1,154,558 | 1,155,921 |
| 10% | 10.0% | 577,279 | 576,342 |
| Active Idle | 0 | 0 | |
| Target Load | Actual Load | ssj_ops | |
|---|---|---|---|
| Target | Actual | ||
| Calibration 1 | 5,741,086 | ||
| Calibration 2 | 5,731,413 | ||
| Calibration 3 | 5,746,102 | ||
| ssj_ops@calibrated=5,738,758 | |||
| 100% | 99.7% | 5,738,758 | 5,721,337 |
| 90% | 89.9% | 5,164,882 | 5,161,327 |
| 80% | 79.9% | 4,591,006 | 4,583,151 |
| 70% | 70.1% | 4,017,130 | 4,020,501 |
| 60% | 59.9% | 3,443,255 | 3,436,789 |
| 50% | 50.0% | 2,869,379 | 2,867,551 |
| 40% | 40.0% | 2,295,503 | 2,297,007 |
| 30% | 30.0% | 1,721,627 | 1,722,182 |
| 20% | 20.0% | 1,147,752 | 1,146,971 |
| 10% | 10.0% | 573,876 | 573,313 |
| Active Idle | 0 | 0 | |

| Target Load | Actual Load | ssj_ops | |
|---|---|---|---|
| Target | Actual | ||
| Calibration 1 | 5,732,161 | ||
| Calibration 2 | 5,713,803 | ||
| Calibration 3 | 5,726,184 | ||
| ssj_ops@calibrated=5,719,993 | |||
| 100% | 99.8% | 5,719,993 | 5,709,759 |
| 90% | 90.0% | 5,147,994 | 5,146,399 |
| 80% | 80.1% | 4,575,995 | 4,579,612 |
| 70% | 70.0% | 4,003,995 | 4,002,216 |
| 60% | 59.9% | 3,431,996 | 3,427,784 |
| 50% | 50.0% | 2,859,997 | 2,859,427 |
| 40% | 39.9% | 2,287,997 | 2,284,709 |
| 30% | 30.0% | 1,715,998 | 1,715,067 |
| 20% | 20.0% | 1,143,999 | 1,144,841 |
| 10% | 10.0% | 571,999 | 570,943 |
| Active Idle | 0 | 0 | |

| Target Load | Actual Load | ssj_ops | |
|---|---|---|---|
| Target | Actual | ||
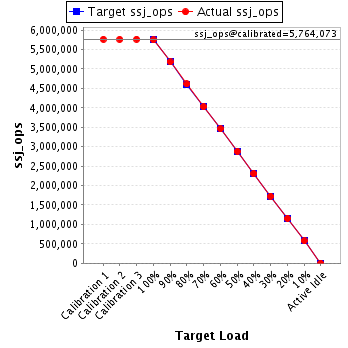
| Calibration 1 | 5,765,190 | ||
| Calibration 2 | 5,760,763 | ||
| Calibration 3 | 5,767,384 | ||
| ssj_ops@calibrated=5,764,073 | |||
| 100% | 99.7% | 5,764,073 | 5,747,101 |
| 90% | 89.9% | 5,187,666 | 5,180,753 |
| 80% | 80.0% | 4,611,259 | 4,614,091 |
| 70% | 69.9% | 4,034,851 | 4,028,596 |
| 60% | 60.0% | 3,458,444 | 3,459,072 |
| 50% | 50.0% | 2,882,037 | 2,881,098 |
| 40% | 40.0% | 2,305,629 | 2,303,485 |
| 30% | 30.0% | 1,729,222 | 1,727,590 |
| 20% | 20.0% | 1,152,815 | 1,152,416 |
| 10% | 10.0% | 576,407 | 575,413 |
| Active Idle | 0 | 0 | |
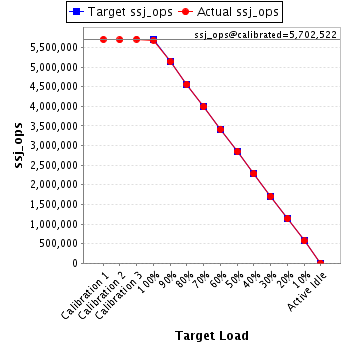
| Target Load | Actual Load | ssj_ops | |
|---|---|---|---|
| Target | Actual | ||
| Calibration 1 | 5,703,277 | ||
| Calibration 2 | 5,693,057 | ||
| Calibration 3 | 5,711,986 | ||
| ssj_ops@calibrated=5,702,522 | |||
| 100% | 99.7% | 5,702,522 | 5,687,420 |
| 90% | 90.1% | 5,132,269 | 5,139,661 |
| 80% | 79.9% | 4,562,017 | 4,558,552 |
| 70% | 69.9% | 3,991,765 | 3,988,171 |
| 60% | 59.9% | 3,421,513 | 3,415,776 |
| 50% | 50.0% | 2,851,261 | 2,849,869 |
| 40% | 40.0% | 2,281,009 | 2,279,284 |
| 30% | 29.9% | 1,710,756 | 1,707,413 |
| 20% | 20.0% | 1,140,504 | 1,138,267 |
| 10% | 10.0% | 570,252 | 569,412 |
| Active Idle | 0 | 0 | |
| Target Load | Actual Load | ssj_ops | |
|---|---|---|---|
| Target | Actual | ||
| Calibration 1 | 5,743,792 | ||
| Calibration 2 | 5,740,566 | ||
| Calibration 3 | 5,755,293 | ||
| ssj_ops@calibrated=5,747,929 | |||
| 100% | 99.7% | 5,747,929 | 5,730,461 |
| 90% | 90.0% | 5,173,136 | 5,175,230 |
| 80% | 80.1% | 4,598,343 | 4,604,997 |
| 70% | 70.0% | 4,023,550 | 4,024,658 |
| 60% | 60.1% | 3,448,758 | 3,454,001 |
| 50% | 49.9% | 2,873,965 | 2,870,386 |
| 40% | 40.0% | 2,299,172 | 2,299,220 |
| 30% | 30.0% | 1,724,379 | 1,724,511 |
| 20% | 20.0% | 1,149,586 | 1,152,197 |
| 10% | 10.0% | 574,793 | 574,863 |
| Active Idle | 0 | 0 | |

| Target Load | Actual Load | ssj_ops | |
|---|---|---|---|
| Target | Actual | ||
| Calibration 1 | 5,712,026 | ||
| Calibration 2 | 5,712,593 | ||
| Calibration 3 | 5,722,967 | ||
| ssj_ops@calibrated=5,717,780 | |||
| 100% | 99.7% | 5,717,780 | 5,700,624 |
| 90% | 90.0% | 5,146,002 | 5,148,050 |
| 80% | 80.1% | 4,574,224 | 4,579,141 |
| 70% | 70.0% | 4,002,446 | 4,002,895 |
| 60% | 59.9% | 3,430,668 | 3,425,473 |
| 50% | 50.0% | 2,858,890 | 2,861,235 |
| 40% | 39.9% | 2,287,112 | 2,284,164 |
| 30% | 30.0% | 1,715,334 | 1,713,664 |
| 20% | 20.0% | 1,143,556 | 1,145,290 |
| 10% | 10.0% | 571,778 | 570,429 |
| Active Idle | 0 | 0 | |

| Target Load | Actual Load | ssj_ops | |
|---|---|---|---|
| Target | Actual | ||
| Calibration 1 | 5,737,243 | ||
| Calibration 2 | 5,730,957 | ||
| Calibration 3 | 5,737,887 | ||
| ssj_ops@calibrated=5,734,422 | |||
| 100% | 99.7% | 5,734,422 | 5,718,172 |
| 90% | 90.1% | 5,160,980 | 5,164,587 |
| 80% | 80.0% | 4,587,538 | 4,588,878 |
| 70% | 70.1% | 4,014,095 | 4,021,668 |
| 60% | 59.9% | 3,440,653 | 3,435,020 |
| 50% | 50.0% | 2,867,211 | 2,869,630 |
| 40% | 40.1% | 2,293,769 | 2,296,721 |
| 30% | 30.0% | 1,720,327 | 1,720,233 |
| 20% | 20.1% | 1,146,884 | 1,152,238 |
| 10% | 10.0% | 573,442 | 573,193 |
| Active Idle | 0 | 0 | |

| Target Load | Actual Load | ssj_ops | |
|---|---|---|---|
| Target | Actual | ||
| Calibration 1 | 5,764,320 | ||
| Calibration 2 | 5,761,281 | ||
| Calibration 3 | 5,776,147 | ||
| ssj_ops@calibrated=5,768,714 | |||
| 100% | 99.8% | 5,768,714 | 5,754,801 |
| 90% | 90.2% | 5,191,842 | 5,203,045 |
| 80% | 80.0% | 4,614,971 | 4,617,540 |
| 70% | 70.1% | 4,038,100 | 4,041,986 |
| 60% | 59.9% | 3,461,228 | 3,454,190 |
| 50% | 49.9% | 2,884,357 | 2,880,534 |
| 40% | 40.0% | 2,307,485 | 2,307,700 |
| 30% | 29.9% | 1,730,614 | 1,723,591 |
| 20% | 20.0% | 1,153,743 | 1,155,587 |
| 10% | 10.0% | 576,871 | 578,245 |
| Active Idle | 0 | 0 | |
