
SPECpower_ssj2008
Aggregate Performance Report
Copyright © 2007-2019 Standard Performance Evaluation Corporation
| Hewlett Packard Enterprise Synergy 480 Gen10 Compute Module | ssj_ops@100% = 63,338,893 ssj_ops@100% per Host = 5,758,081 ssj_ops@100% per JVM = 1,439,520 |
||||
| Test Sponsor: | Hewlett Packard Enterprise | SPEC License #: | 3 | Test Method: | Multi Node |
| Tested By: | Hewlett Packard Enterprise | Test Location: | Houston, TX, USA | Test Date: | Mar 26, 2019 |
| Hardware Availability: | Apr-2019 | Software Availability: | Mar-2019 | Publication: | May 8, 2019 |
| System Source: | Single Supplier | System Designation: | Server | Power Provisioning: | Line-powered |
| Target Load | Actual Load | ssj_ops | |
|---|---|---|---|
| Target | Actual | ||
| Calibration 1 | 63,541,662 | ||
| Calibration 2 | 63,490,283 | ||
| Calibration 3 | 63,542,489 | ||
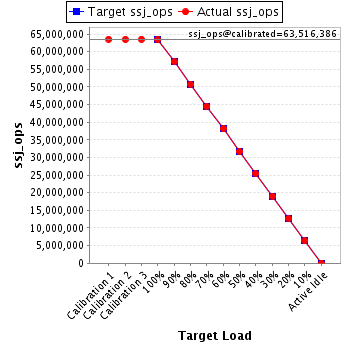
| ssj_ops@calibrated=63,516,386 | |||
| 100% | 99.7% | 63,516,386 | 63,338,893 |
| 90% | 90.0% | 57,164,747 | 57,163,162 |
| 80% | 80.0% | 50,813,109 | 50,786,144 |
| 70% | 70.0% | 44,461,470 | 44,477,482 |
| 60% | 60.0% | 38,109,832 | 38,128,514 |
| 50% | 50.0% | 31,758,193 | 31,737,073 |
| 40% | 40.0% | 25,406,554 | 25,412,847 |
| 30% | 30.0% | 19,054,916 | 19,051,847 |
| 20% | 20.0% | 12,703,277 | 12,701,938 |
| 10% | 10.0% | 6,351,639 | 6,354,532 |
| Active Idle | 0 | 0 | |
| # of Nodes | # of Chips | # of Cores | # of Threads | Total RAM (GB) | # of OS Images | # of JVM Instances |
|---|---|---|---|---|---|---|
| 11 | 22 | 616 | 1,232 | 2,112 | 11 | 44 |
| Set Identifier: | SUT |
| Set Description: | System Under Test |
| # of Identical Nodes: | 11 |
| Comment: | SUT |
| Hardware per Node | |
|---|---|
| Hardware Vendor: | Hewlett Packard Enterprise |
| Model: | Synergy 480 Gen10 Compute Module |
| Form Factor: | 7U |
| CPU Name: | Intel Xeon Platinum 8280 @ 2.70GHz (Intel Turbo Boost Technology up to 4.00 GHz) |
| CPU Characteristics: | 28-Core, 2.70 GHz, 38.5MB L3 Cache |
| CPU Frequency (MHz): | 2700 |
| CPU(s) Enabled: | 56 cores, 2 chips, 28 cores/chip |
| Hardware Threads: | 112 (2 / core) |
| CPU(s) Orderable: | 1,2 chips |
| Primary Cache: | 32 KB I + 32 KB D on chip per core |
| Secondary Cache: | 1 MB I+D on chip per core |
| Tertiary Cache: | 39424 KB I+D on chip per chip |
| Other Cache: | None |
| Memory Amount (GB): | 192 |
| # and size of DIMM: | 12 x 16384 MB |
| Memory Details: | 12 x 16GB 2Rx8 PC4-2933Y-R; slots 1, 3, 5, 8, 10 and 12 populated in each socket |
| Power Supply Quantity and Rating (W): | None |
| Power Supply Details: | N/A |
| Disk Drive: | 1 x HPE 240GB 6G SATA M.2 SSD (875488-B21) |
| Disk Controller: | HPE Smart Array S100i SR Gen10 |
| # and type of Network Interface Cards (NICs) Installed: | 1 x HPE Synergy 3820C 10/20Gb CNA |
| NICs Enabled in Firmware / OS / Connected: | 2/2/1 |
| Network Speed (Mbit): | 1000 |
| Keyboard: | None |
| Mouse: | None |
| Monitor: | None |
| Optical Drives: | No |
| Other Hardware: | H/S: Standard |
| Software per Node | |
|---|---|
| Power Management: | Enabled (see SUT Notes) |
| Operating System (OS): | Windows Server 2012 R2 Datacenter |
| OS Version: | Version 6.3 (Build 9600) |
| Filesystem: | NTFS |
| JVM Vendor: | Oracle Corporation |
| JVM Version: | Oracle Java HotSpot(TM) 64-Bit Server VM (build 24.80-b11, mixed mode), version 1.7.0_80 |
| JVM Command-line Options: | -server -Xmn21000m -Xms24000m -Xmx24000m -XX:SurvivorRatio=1 -XX:TargetSurvivorRatio=99 -XX:AllocatePrefetchDistance=256 -XX:AllocatePrefetchLines=4 -XX:LoopUnrollLimit=45 -XX:InitialTenuringThreshold=12 -XX:MaxTenuringThreshold=15 -XX:ParallelGCThreads=28 -XX:InlineSmallCode=3900 -XX:MaxInlineSize=270 -XX:FreqInlineSize=2500 -XX:+AggressiveOpts -XX:+UseLargePages -XX:+UseParallelOldGC |
| JVM Affinity: | start /NODE [0,1,2,3] /AFFINITY [0xFFFFFFF] |
| JVM Instances: | 4 |
| JVM Initial Heap (MB): | 24000 |
| JVM Maximum Heap (MB): | 24000 |
| JVM Address Bits: | 64 |
| Boot Firmware Version: | I42 v2.00 (02/02/2019) |
| Management Firmware Version: | 1.40 Feb 05 2019 |
| Workload Version: | SSJ 1.2.10 |
| Director Location: | Controller |
| Other Software: | HPE Service Pack for ProLiant (SPP) Version: 2019.03.0, Microsoft Windows KB4056898, KB4338815 |
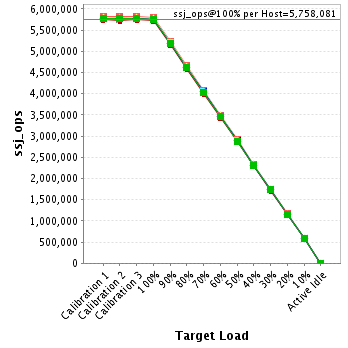
| Host | ssj_ops@100% |
|---|---|
| NODE01 | 5,799,368 |
| NODE02 | 5,766,301 |
| NODE03 | 5,772,636 |
| NODE04 | 5,764,716 |
| NODE05 | 5,739,236 |
| NODE06 | 5,759,319 |
| NODE07 | 5,757,526 |
| NODE08 | 5,751,003 |
| NODE09 | 5,724,040 |
| NODE10 | 5,753,223 |
| NODE11 | 5,751,525 |
| ssj_ops@100% | 63,338,893 |
| ssj_ops@100% per Host | 5,758,081 |
| ssj_ops@100% per JVM | 1,439,520 |
| Target Load | Actual Load | ssj_ops | |
|---|---|---|---|
| Target | Actual | ||
| Calibration 1 | 5,823,785 | ||
| Calibration 2 | 5,815,313 | ||
| Calibration 3 | 5,822,093 | ||
| ssj_ops@calibrated=5,818,703 | |||
| 100% | 99.7% | 5,818,703 | 5,799,368 |
| 90% | 90.0% | 5,236,832 | 5,237,418 |
| 80% | 80.1% | 4,654,962 | 4,661,934 |
| 70% | 70.0% | 4,073,092 | 4,074,771 |
| 60% | 59.9% | 3,491,222 | 3,484,352 |
| 50% | 50.0% | 2,909,351 | 2,907,590 |
| 40% | 40.0% | 2,327,481 | 2,327,825 |
| 30% | 30.0% | 1,745,611 | 1,743,234 |
| 20% | 20.0% | 1,163,741 | 1,164,890 |
| 10% | 10.0% | 581,870 | 581,017 |
| Active Idle | 0 | 0 | |

| Target Load | Actual Load | ssj_ops | |
|---|---|---|---|
| Target | Actual | ||
| Calibration 1 | 5,780,677 | ||
| Calibration 2 | 5,781,209 | ||
| Calibration 3 | 5,782,097 | ||
| ssj_ops@calibrated=5,781,653 | |||
| 100% | 99.7% | 5,781,653 | 5,766,301 |
| 90% | 90.0% | 5,203,488 | 5,200,847 |
| 80% | 80.1% | 4,625,323 | 4,628,963 |
| 70% | 70.0% | 4,047,157 | 4,044,568 |
| 60% | 60.1% | 3,468,992 | 3,473,717 |
| 50% | 50.0% | 2,890,827 | 2,888,617 |
| 40% | 40.0% | 2,312,661 | 2,309,910 |
| 30% | 30.0% | 1,734,496 | 1,736,605 |
| 20% | 20.0% | 1,156,331 | 1,155,274 |
| 10% | 10.0% | 578,165 | 576,958 |
| Active Idle | 0 | 0 | |

| Target Load | Actual Load | ssj_ops | |
|---|---|---|---|
| Target | Actual | ||
| Calibration 1 | 5,794,299 | ||
| Calibration 2 | 5,790,476 | ||
| Calibration 3 | 5,791,281 | ||
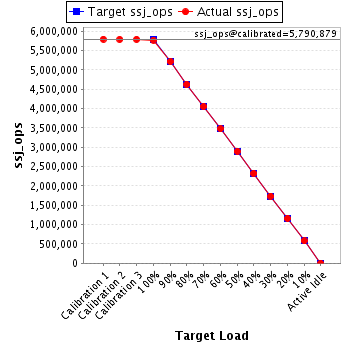
| ssj_ops@calibrated=5,790,879 | |||
| 100% | 99.7% | 5,790,879 | 5,772,636 |
| 90% | 90.1% | 5,211,791 | 5,215,256 |
| 80% | 79.9% | 4,632,703 | 4,625,972 |
| 70% | 70.1% | 4,053,615 | 4,056,747 |
| 60% | 60.0% | 3,474,527 | 3,473,968 |
| 50% | 50.0% | 2,895,439 | 2,895,220 |
| 40% | 40.1% | 2,316,351 | 2,321,793 |
| 30% | 30.0% | 1,737,264 | 1,738,090 |
| 20% | 20.0% | 1,158,176 | 1,160,187 |
| 10% | 10.0% | 579,088 | 578,867 |
| Active Idle | 0 | 0 | |
| Target Load | Actual Load | ssj_ops | |
|---|---|---|---|
| Target | Actual | ||
| Calibration 1 | 5,788,835 | ||
| Calibration 2 | 5,783,846 | ||
| Calibration 3 | 5,795,421 | ||
| ssj_ops@calibrated=5,789,634 | |||
| 100% | 99.6% | 5,789,634 | 5,764,716 |
| 90% | 90.0% | 5,210,670 | 5,213,531 |
| 80% | 80.0% | 4,631,707 | 4,634,435 |
| 70% | 70.1% | 4,052,744 | 4,058,912 |
| 60% | 60.1% | 3,473,780 | 3,476,980 |
| 50% | 50.0% | 2,894,817 | 2,894,750 |
| 40% | 40.0% | 2,315,854 | 2,316,951 |
| 30% | 29.9% | 1,736,890 | 1,733,693 |
| 20% | 20.0% | 1,157,927 | 1,156,228 |
| 10% | 10.0% | 578,963 | 579,756 |
| Active Idle | 0 | 0 | |

| Target Load | Actual Load | ssj_ops | |
|---|---|---|---|
| Target | Actual | ||
| Calibration 1 | 5,756,682 | ||
| Calibration 2 | 5,751,645 | ||
| Calibration 3 | 5,758,253 | ||
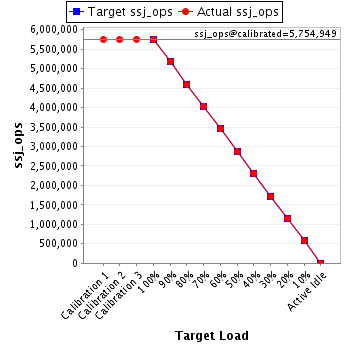
| ssj_ops@calibrated=5,754,949 | |||
| 100% | 99.7% | 5,754,949 | 5,739,236 |
| 90% | 89.9% | 5,179,454 | 5,175,501 |
| 80% | 79.8% | 4,603,959 | 4,594,089 |
| 70% | 70.0% | 4,028,464 | 4,031,093 |
| 60% | 60.0% | 3,452,969 | 3,450,649 |
| 50% | 49.8% | 2,877,474 | 2,865,364 |
| 40% | 40.0% | 2,301,979 | 2,303,566 |
| 30% | 29.9% | 1,726,485 | 1,722,536 |
| 20% | 19.9% | 1,150,990 | 1,148,066 |
| 10% | 10.0% | 575,495 | 576,611 |
| Active Idle | 0 | 0 | |
| Target Load | Actual Load | ssj_ops | |
|---|---|---|---|
| Target | Actual | ||
| Calibration 1 | 5,778,994 | ||
| Calibration 2 | 5,772,698 | ||
| Calibration 3 | 5,779,211 | ||
| ssj_ops@calibrated=5,775,955 | |||
| 100% | 99.7% | 5,775,955 | 5,759,319 |
| 90% | 90.0% | 5,198,359 | 5,195,592 |
| 80% | 80.0% | 4,620,764 | 4,622,700 |
| 70% | 70.0% | 4,043,168 | 4,044,988 |
| 60% | 60.1% | 3,465,573 | 3,469,902 |
| 50% | 50.1% | 2,887,977 | 2,892,283 |
| 40% | 40.0% | 2,310,382 | 2,313,180 |
| 30% | 30.0% | 1,732,786 | 1,732,496 |
| 20% | 20.0% | 1,155,191 | 1,156,543 |
| 10% | 10.0% | 577,595 | 577,652 |
| Active Idle | 0 | 0 | |

| Target Load | Actual Load | ssj_ops | |
|---|---|---|---|
| Target | Actual | ||
| Calibration 1 | 5,772,116 | ||
| Calibration 2 | 5,772,423 | ||
| Calibration 3 | 5,772,510 | ||
| ssj_ops@calibrated=5,772,466 | |||
| 100% | 99.7% | 5,772,466 | 5,757,526 |
| 90% | 90.1% | 5,195,220 | 5,199,634 |
| 80% | 79.9% | 4,617,973 | 4,610,382 |
| 70% | 70.0% | 4,040,726 | 4,041,764 |
| 60% | 60.0% | 3,463,480 | 3,465,619 |
| 50% | 49.9% | 2,886,233 | 2,882,977 |
| 40% | 40.0% | 2,308,987 | 2,311,299 |
| 30% | 30.1% | 1,731,740 | 1,734,863 |
| 20% | 20.0% | 1,154,493 | 1,156,294 |
| 10% | 10.0% | 577,247 | 578,104 |
| Active Idle | 0 | 0 | |

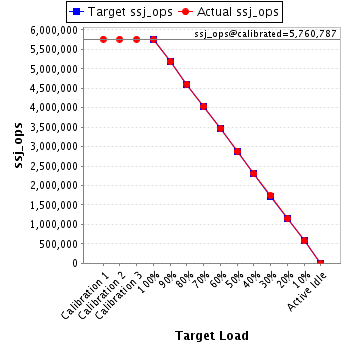
| Target Load | Actual Load | ssj_ops | |
|---|---|---|---|
| Target | Actual | ||
| Calibration 1 | 5,763,441 | ||
| Calibration 2 | 5,759,907 | ||
| Calibration 3 | 5,761,667 | ||
| ssj_ops@calibrated=5,760,787 | |||
| 100% | 99.8% | 5,760,787 | 5,751,003 |
| 90% | 90.0% | 5,184,709 | 5,182,295 |
| 80% | 80.0% | 4,608,630 | 4,606,854 |
| 70% | 70.0% | 4,032,551 | 4,033,732 |
| 60% | 60.0% | 3,456,472 | 3,458,235 |
| 50% | 50.0% | 2,880,394 | 2,879,857 |
| 40% | 40.0% | 2,304,315 | 2,304,134 |
| 30% | 30.1% | 1,728,236 | 1,731,822 |
| 20% | 20.0% | 1,152,157 | 1,150,209 |
| 10% | 10.0% | 576,079 | 574,837 |
| Active Idle | 0 | 0 | |
| Target Load | Actual Load | ssj_ops | |
|---|---|---|---|
| Target | Actual | ||
| Calibration 1 | 5,745,023 | ||
| Calibration 2 | 5,730,513 | ||
| Calibration 3 | 5,739,365 | ||
| ssj_ops@calibrated=5,734,939 | |||
| 100% | 99.8% | 5,734,939 | 5,724,040 |
| 90% | 90.0% | 5,161,445 | 5,160,121 |
| 80% | 79.9% | 4,587,951 | 4,583,206 |
| 70% | 70.0% | 4,014,457 | 4,012,852 |
| 60% | 60.0% | 3,440,963 | 3,440,846 |
| 50% | 49.9% | 2,867,469 | 2,862,724 |
| 40% | 40.0% | 2,293,976 | 2,296,167 |
| 30% | 30.0% | 1,720,482 | 1,718,217 |
| 20% | 20.0% | 1,146,988 | 1,146,587 |
| 10% | 10.0% | 573,494 | 573,002 |
| Active Idle | 0 | 0 | |

| Target Load | Actual Load | ssj_ops | |
|---|---|---|---|
| Target | Actual | ||
| Calibration 1 | 5,771,525 | ||
| Calibration 2 | 5,768,130 | ||
| Calibration 3 | 5,769,969 | ||
| ssj_ops@calibrated=5,769,050 | |||
| 100% | 99.7% | 5,769,050 | 5,753,223 |
| 90% | 90.0% | 5,192,145 | 5,189,486 |
| 80% | 79.9% | 4,615,240 | 4,607,922 |
| 70% | 70.1% | 4,038,335 | 4,045,518 |
| 60% | 60.2% | 3,461,430 | 3,470,456 |
| 50% | 50.0% | 2,884,525 | 2,886,454 |
| 40% | 39.9% | 2,307,620 | 2,302,318 |
| 30% | 30.0% | 1,730,715 | 1,729,423 |
| 20% | 20.0% | 1,153,810 | 1,154,730 |
| 10% | 10.1% | 576,905 | 580,337 |
| Active Idle | 0 | 0 | |

| Target Load | Actual Load | ssj_ops | |
|---|---|---|---|
| Target | Actual | ||
| Calibration 1 | 5,766,287 | ||
| Calibration 2 | 5,764,124 | ||
| Calibration 3 | 5,770,621 | ||
| ssj_ops@calibrated=5,767,372 | |||
| 100% | 99.7% | 5,767,372 | 5,751,525 |
| 90% | 90.0% | 5,190,635 | 5,193,479 |
| 80% | 79.9% | 4,613,898 | 4,609,686 |
| 70% | 69.9% | 4,037,161 | 4,032,536 |
| 60% | 60.1% | 3,460,423 | 3,463,789 |
| 50% | 50.0% | 2,883,686 | 2,881,237 |
| 40% | 40.0% | 2,306,949 | 2,305,705 |
| 30% | 30.0% | 1,730,212 | 1,730,867 |
| 20% | 20.0% | 1,153,474 | 1,152,930 |
| 10% | 10.0% | 576,737 | 577,391 |
| Active Idle | 0 | 0 | |
