
SPECpower_ssj2008
Aggregate Performance Report
Copyright © 2007-2019 Standard Performance Evaluation Corporation
| Lenovo Global Technology ThinkSystem SD530 | ssj_ops@100% = 19,698,461 ssj_ops@100% per Host = 4,924,615 ssj_ops@100% per JVM = 87,940 |
||||
| Test Sponsor: | Lenovo Global Technology | SPEC License #: | 9017 | Test Method: | Multi Node |
| Tested By: | Lenovo Global Technology | Test Location: | Beijing, China | Test Date: | Jun 11, 2019 |
| Hardware Availability: | Apr-2019 | Software Availability: | Dec-2018 | Publication: | Jul 17, 2019 |
| System Source: | Single Supplier | System Designation: | Server | Power Provisioning: | Line-powered |
| Target Load | Actual Load | ssj_ops | |
|---|---|---|---|
| Target | Actual | ||
| Calibration 1 | 19,844,925 | ||
| Calibration 2 | 19,741,421 | ||
| Calibration 3 | 19,786,092 | ||
| ssj_ops@calibrated=19,763,756 | |||
| 100% | 99.7% | 19,763,756 | 19,698,461 |
| 90% | 90.0% | 17,787,381 | 17,788,858 |
| 80% | 80.0% | 15,811,005 | 15,801,198 |
| 70% | 69.9% | 13,834,630 | 13,817,315 |
| 60% | 58.9% | 11,858,254 | 11,645,254 |
| 50% | 50.0% | 9,881,878 | 9,888,549 |
| 40% | 40.0% | 7,905,503 | 7,906,751 |
| 30% | 29.9% | 5,929,127 | 5,918,370 |
| 20% | 20.0% | 3,952,751 | 3,950,544 |
| 10% | 10.0% | 1,976,376 | 1,976,596 |
| Active Idle | 0 | 0 | |

| # of Nodes | # of Chips | # of Cores | # of Threads | Total RAM (GB) | # of OS Images | # of JVM Instances |
|---|---|---|---|---|---|---|
| 4 | 8 | 224 | 448 | 768 | 4 | 224 |
| Set Identifier: | sut |
| Set Description: | System Under Test |
| # of Identical Nodes: | 4 |
| Comment: | 'SUT' |
| Hardware per Node | |
|---|---|
| Hardware Vendor: | Lenovo Global Technology |
| Model: | ThinkSystem SD530 |
| Form Factor: | 2U |
| CPU Name: | Intel Xeon Platinum 8276L |
| CPU Characteristics: | 28-Core, 2.20 GHz, 39424 KB L3 Cache |
| CPU Frequency (MHz): | 2200 |
| CPU(s) Enabled: | 56 cores, 2 chips, 28 cores/chip |
| Hardware Threads: | 112 (2 / core) |
| CPU(s) Orderable: | 1,2 chips |
| Primary Cache: | 32 KB I + 32 KB D on chip per core |
| Secondary Cache: | 1 MB I+D on chip per core |
| Tertiary Cache: | 39424 KB I+D on chip per chip |
| Other Cache: | None |
| Memory Amount (GB): | 192 |
| # and size of DIMM: | 12 x 16 GB |
| Memory Details: | 16GB 2Rx8 PC4-2933V-RE1-12-MA0; slots 1,2,3,6,7,8,9,10,11,14,15 and 16 for each processor |
| Power Supply Quantity and Rating (W): | None |
| Power Supply Details: | Shared |
| Disk Drive: | 1 x 128GB M.2 SSD (Lenovo P/N 7N47A00130) |
| Disk Controller: | Integrated SATA controller |
| # and type of Network Interface Cards (NICs) Installed: | 1 x Intel Ethernet Connection X722 for 10GBASE-T |
| NICs Enabled in Firmware / OS / Connected: | 2/2/1 |
| Network Speed (Mbit): | 10000 |
| Keyboard: | None |
| Mouse: | None |
| Monitor: | None |
| Optical Drives: | No |
| Other Hardware: | None |
| Software per Node | |
|---|---|
| Power Management: | Enabled (see SUT Notes) |
| Operating System (OS): | SUSE Linux Enterprise Server 12 SP4 |
| OS Version: | Kernel 4.12.14-94.41-default |
| Filesystem: | btrfs |
| JVM Vendor: | Oracle Corporation |
| JVM Version: | Oracle Java HotSpot(TM) 64-Bit Server VM (build 24.80-b11, mixed mode), version 1.7.0_80 |
| JVM Command-line Options: | -server -Xmn1300m -Xms1550m -Xmx1550m -XX:SurvivorRatio=1 -XX:TargetSurvivorRatio=99 -XX:AllocatePrefetchDistance=256 -XX:AllocatePrefetchLines=4 -XX:LoopUnrollLimit=45 -XX:InitialTenuringThreshold=12 -XX:MaxTenuringThreshold=15 -XX:ParallelGCThreads=2 -XX:InlineSmallCode=3900 -XX:MaxInlineSize=270 -XX:FreqInlineSize=2500 -XX:+AggressiveOpts -XX:+UseLargePages -XX:+UseParallelOldGC -XX:LargePageSizeInBytes=2m |
| JVM Affinity: | for each physicalCore { numactl -C physicalCoreId, physicalCoreId + 56 } |
| JVM Instances: | 56 |
| JVM Initial Heap (MB): | 1550 |
| JVM Maximum Heap (MB): | 1550 |
| JVM Address Bits: | 64 |
| Boot Firmware Version: | TEE135K |
| Management Firmware Version: | TEI341K |
| Workload Version: | SSJ 1.2.10 |
| Director Location: | Controller |
| Other Software: | None |
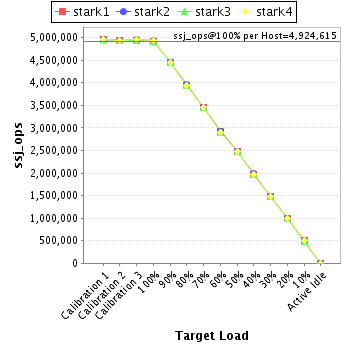
| Host | ssj_ops@100% |
|---|---|
| stark1 | 4,924,567 |
| stark2 | 4,933,503 |
| stark3 | 4,913,017 |
| stark4 | 4,927,373 |
| ssj_ops@100% | 19,698,461 |
| ssj_ops@100% per Host | 4,924,615 |
| ssj_ops@100% per JVM | 87,940 |
| Target Load | Actual Load | ssj_ops | |
|---|---|---|---|
| Target | Actual | ||
| Calibration 1 | 4,963,908 | ||
| Calibration 2 | 4,938,561 | ||
| Calibration 3 | 4,945,519 | ||
| ssj_ops@calibrated=4,942,040 | |||
| 100% | 99.6% | 4,942,040 | 4,924,567 |
| 90% | 90.0% | 4,447,836 | 4,449,374 |
| 80% | 79.9% | 3,953,632 | 3,949,779 |
| 70% | 69.9% | 3,459,428 | 3,455,527 |
| 60% | 58.9% | 2,965,224 | 2,912,595 |
| 50% | 50.0% | 2,471,020 | 2,473,385 |
| 40% | 40.0% | 1,976,816 | 1,976,225 |
| 30% | 29.9% | 1,482,612 | 1,480,099 |
| 20% | 20.0% | 988,408 | 988,730 |
| 10% | 10.0% | 494,204 | 493,551 |
| Active Idle | 0 | 0 | |

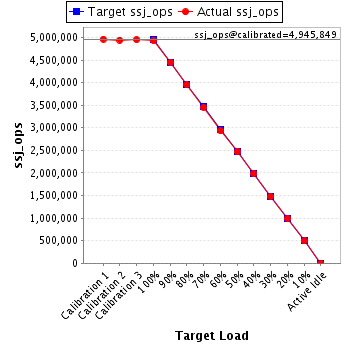
| Target Load | Actual Load | ssj_ops | |
|---|---|---|---|
| Target | Actual | ||
| Calibration 1 | 4,962,230 | ||
| Calibration 2 | 4,942,150 | ||
| Calibration 3 | 4,949,549 | ||
| ssj_ops@calibrated=4,945,849 | |||
| 100% | 99.8% | 4,945,849 | 4,933,503 |
| 90% | 90.0% | 4,451,265 | 4,449,296 |
| 80% | 80.0% | 3,956,680 | 3,954,251 |
| 70% | 69.9% | 3,462,095 | 3,456,679 |
| 60% | 59.2% | 2,967,510 | 2,929,812 |
| 50% | 50.0% | 2,472,925 | 2,474,282 |
| 40% | 40.1% | 1,978,340 | 1,982,363 |
| 30% | 30.0% | 1,483,755 | 1,483,700 |
| 20% | 20.0% | 989,170 | 989,329 |
| 10% | 10.0% | 494,585 | 493,189 |
| Active Idle | 0 | 0 | |
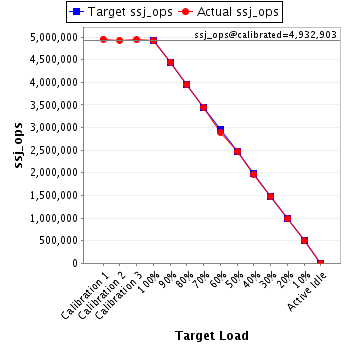
| Target Load | Actual Load | ssj_ops | |
|---|---|---|---|
| Target | Actual | ||
| Calibration 1 | 4,952,331 | ||
| Calibration 2 | 4,926,938 | ||
| Calibration 3 | 4,938,868 | ||
| ssj_ops@calibrated=4,932,903 | |||
| 100% | 99.6% | 4,932,903 | 4,913,017 |
| 90% | 90.1% | 4,439,613 | 4,443,835 |
| 80% | 80.0% | 3,946,322 | 3,946,500 |
| 70% | 69.9% | 3,453,032 | 3,446,587 |
| 60% | 58.7% | 2,959,742 | 2,895,367 |
| 50% | 50.0% | 2,466,452 | 2,467,496 |
| 40% | 40.0% | 1,973,161 | 1,972,145 |
| 30% | 29.9% | 1,479,871 | 1,475,670 |
| 20% | 19.9% | 986,581 | 982,318 |
| 10% | 10.0% | 493,290 | 492,813 |
| Active Idle | 0 | 0 | |
| Target Load | Actual Load | ssj_ops | |
|---|---|---|---|
| Target | Actual | ||
| Calibration 1 | 4,966,456 | ||
| Calibration 2 | 4,933,771 | ||
| Calibration 3 | 4,952,157 | ||
| ssj_ops@calibrated=4,942,964 | |||
| 100% | 99.7% | 4,942,964 | 4,927,373 |
| 90% | 90.0% | 4,448,667 | 4,446,353 |
| 80% | 79.9% | 3,954,371 | 3,950,668 |
| 70% | 70.0% | 3,460,075 | 3,458,521 |
| 60% | 58.8% | 2,965,778 | 2,907,480 |
| 50% | 50.0% | 2,471,482 | 2,473,387 |
| 40% | 40.0% | 1,977,186 | 1,976,019 |
| 30% | 29.9% | 1,482,889 | 1,478,901 |
| 20% | 20.0% | 988,593 | 990,168 |
| 10% | 10.1% | 494,296 | 497,043 |
| Active Idle | 0 | 0 | |
