SPECpower_ssj2008
Host 'localhost' Performance Report
Copyright © 2007-2021 Standard Performance Evaluation Corporation
| Fujitsu PRIMERGY RX2540 M6 | ssj_ops@100% = 7,594,068 ssj_ops@100% per JVM = 949,259 |
||||
| Test Sponsor: | Fujitsu | SPEC License #: | 19 | Test Method: | Single Node |
| Tested By: | Fujitsu | Test Location: | Kawasaki, Kanagawa, Japan | Test Date: | May 18, 2021 |
| Hardware Availability: | May-2021 | Software Availability: | Dec-2020 | Publication: | Jun 9, 2021 |
| System Source: | Single Supplier | System Designation: | Server | Power Provisioning: | Line-powered |
| Target Load | Actual Load | ssj_ops | |
|---|---|---|---|
| Target | Actual | ||
| Calibration 1 | 5,743,389 | ||
| Calibration 2 | 7,591,639 | ||
| Calibration 3 | 7,592,199 | ||
| ssj_ops@calibrated=7,591,919 | |||
| 100% | 100.0% | 7,591,919 | 7,594,068 |
| 90% | 89.9% | 6,832,727 | 6,823,877 |
| 80% | 79.9% | 6,073,535 | 6,068,791 |
| 70% | 70.1% | 5,314,343 | 5,320,946 |
| 60% | 60.0% | 4,555,151 | 4,554,273 |
| 50% | 50.1% | 3,795,959 | 3,801,003 |
| 40% | 40.1% | 3,036,768 | 3,041,484 |
| 30% | 29.9% | 2,277,576 | 2,273,651 |
| 20% | 20.0% | 1,518,384 | 1,517,770 |
| 10% | 10.0% | 759,192 | 759,382 |
| Active Idle | 0 | 0 | |

| Set Identifier: | RX2540M6 |
| Set Description: | System Under Test |
| # of Identical Nodes: | 1 |
| Comment: | Single Node |
| Hardware | |
|---|---|
| Hardware Vendor: | Fujitsu |
| Model: | PRIMERGY RX2540 M6 |
| Form Factor: | 2U |
| CPU Name: | Intel Xeon Platinum 8380 |
| CPU Characteristics: | 40-Core, 2.30GHz, 60MB L3 Cache |
| CPU Frequency (MHz): | 2300 |
| CPU(s) Enabled: | 80 cores, 2 chips, 40 cores/chip |
| Hardware Threads: | 160 (2 / core) |
| CPU(s) Orderable: | 2 chips |
| Primary Cache: | 32 KB I + 48 KB D on chip per core |
| Secondary Cache: | 1280 KB I+D on chip per core |
| Tertiary Cache: | 60 MB I+D on chip per chip |
| Other Cache: | None |
| Memory Amount (GB): | 256 |
| # and size of DIMM: | 16 x 16384 MB |
| Memory Details: | 16 x 16 GB 2Rx8 PC4-3200Y-R; slots 1A, 1B, 1C, 1D, 1E, 1F, 1G, 1H, 1J, 1K, 1L, 1M, 1N, 1P, 1Q, 1R populated |
| Power Supply Quantity and Rating (W): | 1 x 900 |
| Power Supply Details: | S26113-E629-V50-1 |
| Disk Drive: | 1 x SSD M.2 240GB, S26361-F5787-E240 |
| Disk Controller: | Integrated SATA Controller |
| # and type of Network Interface Cards (NICs) Installed: | 1 x PLAN CP I350-T4 4X 1000BASE-T OCPv3, PYBLA274U |
| NICs Enabled in Firmware / OS / Connected: | 4/4/1 |
| Network Speed (Mbit): | 1000 |
| Keyboard: | None |
| Mouse: | None |
| Monitor: | None |
| Optical Drives: | No |
| Other Hardware: | None |
| Software | |
|---|---|
| Power Management: | Enabled (see SUT Notes) |
| Operating System (OS): | SUSE Linux Enterprise Server 15 SP2 |
| OS Version: | 5.3.18-24.43-default |
| Filesystem: | btrfs |
| JVM Vendor: | Oracle Corporation |
| JVM Version: | Oracle Java HotSpot(TM) 64-Bit Server VM 18.9 (build 11.0.9+7-LTS, mixed mode) |
| JVM Command-line Options: | -server -Xmn16000m -Xms18000m -Xmx18000m -XX:+UseHugeTLBFS -XX:+UseLargePages -XX:+UseTransparentHugePages -XX:AllocatePrefetchDistance=256 -XX:AllocatePrefetchInstr=0 -XX:AllocatePrefetchLines=4 -XX:InlineSmallCode=3900 -XX:MaxInlineSize=270 -XX:ParallelGCThreads=8 -XX:SurvivorRatio=1 -XX:TargetSurvivorRatio=99 -XX:+UseParallelOldGC -XX:FreqInlineSize=2500 -XX:MinJumpTableSize=18 -XX:UseAVX=0 -XX:+UseBiasedLocking |
| JVM Affinity: | chrt -r 1 taskset -c [(0,1,2,3,4,5,6,7,8,9,80,81,82,83,84,85,86,87,88,89),(10,11,12,13,14,15,16,17,18,19,90,91,92,93,94,95,96,97,98),(20,21,22,23,24,25,26,27,28,29,100,101,102,103,104,105,106,107,108,109),(30,31,32,33,34,35,36,37,38,39,110,111,112,113,114,115,116,117,118),(40,41,42,43,44,45,46,47,48,49,120,121,122,123,124,125,126,127,128,129),(50,51,52,53,54,55,56,57,58,59,130,131,132,133,134,135,136,137,138),(60,61,62,63,64,65,66,67,68,69,140,141,142,143,144,145,146,147,148,149),(70,71,72,73,74,75,76,77,78,79,150,151,152,153,154,155,156,157,158)] numactl --membind=[0-3] |
| JVM Instances: | 8 |
| JVM Initial Heap (MB): | 18000 |
| JVM Maximum Heap (MB): | 18000 |
| JVM Address Bits: | 64 |
| Boot Firmware Version: | R1.4.0 |
| Management Firmware Version: | 3.22P |
| Workload Version: | SSJ 1.2.10 |
| Director Location: | Controller |
| Other Software: | None |
| JVM Instance | ssj_ops@100% |
|---|---|
| localhost.001 | 964,893 |
| localhost.002 | 946,293 |
| localhost.003 | 961,796 |
| localhost.004 | 942,716 |
| localhost.005 | 962,580 |
| localhost.006 | 928,400 |
| localhost.007 | 958,095 |
| localhost.008 | 929,295 |
| ssj_ops@100% | 7,594,068 |
| ssj_ops@100% per JVM | 949,259 |

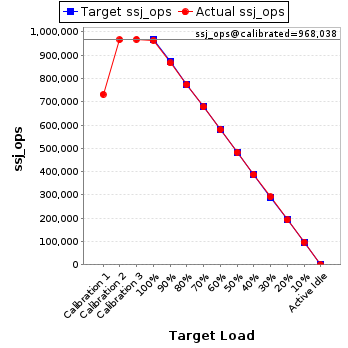
| Target Load | Actual Load | ssj_ops | |
|---|---|---|---|
| Target | Actual | ||
| Calibration 1 | 732,710 | ||
| Calibration 2 | 967,282 | ||
| Calibration 3 | 968,795 | ||
| ssj_ops@calibrated=968,038 | |||
| 100% | 99.7% | 968,038 | 964,893 |
| 90% | 89.6% | 871,235 | 867,162 |
| 80% | 80.0% | 774,431 | 774,268 |
| 70% | 70.1% | 677,627 | 678,203 |
| 60% | 59.9% | 580,823 | 580,330 |
| 50% | 49.9% | 484,019 | 483,373 |
| 40% | 40.0% | 387,215 | 387,188 |
| 30% | 30.1% | 290,412 | 291,473 |
| 20% | 19.9% | 193,608 | 192,401 |
| 10% | 10.0% | 96,804 | 97,170 |
| Active Idle | 0 | 0 | |
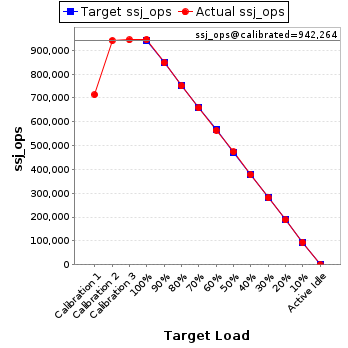
| Target Load | Actual Load | ssj_ops | |
|---|---|---|---|
| Target | Actual | ||
| Calibration 1 | 713,931 | ||
| Calibration 2 | 941,190 | ||
| Calibration 3 | 943,337 | ||
| ssj_ops@calibrated=942,264 | |||
| 100% | 100.4% | 942,264 | 946,293 |
| 90% | 90.0% | 848,038 | 848,090 |
| 80% | 79.7% | 753,811 | 751,012 |
| 70% | 69.9% | 659,585 | 658,399 |
| 60% | 59.9% | 565,358 | 564,304 |
| 50% | 50.3% | 471,132 | 473,766 |
| 40% | 40.1% | 376,906 | 377,506 |
| 30% | 29.8% | 282,679 | 281,126 |
| 20% | 19.9% | 188,453 | 187,908 |
| 10% | 10.1% | 94,226 | 94,814 |
| Active Idle | 0 | 0 | |
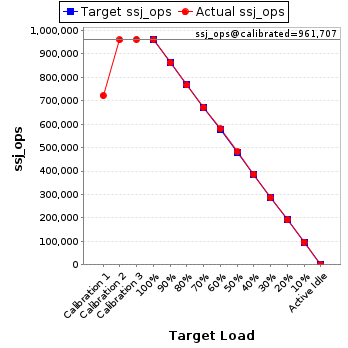
| Target Load | Actual Load | ssj_ops | |
|---|---|---|---|
| Target | Actual | ||
| Calibration 1 | 722,772 | ||
| Calibration 2 | 960,648 | ||
| Calibration 3 | 962,765 | ||
| ssj_ops@calibrated=961,707 | |||
| 100% | 100.0% | 961,707 | 961,796 |
| 90% | 89.7% | 865,536 | 862,988 |
| 80% | 79.8% | 769,365 | 767,426 |
| 70% | 70.0% | 673,195 | 672,927 |
| 60% | 60.3% | 577,024 | 579,739 |
| 50% | 50.1% | 480,853 | 482,247 |
| 40% | 40.3% | 384,683 | 387,134 |
| 30% | 29.9% | 288,512 | 287,653 |
| 20% | 20.1% | 192,341 | 192,999 |
| 10% | 10.0% | 96,171 | 96,453 |
| Active Idle | 0 | 0 | |
| Target Load | Actual Load | ssj_ops | |
|---|---|---|---|
| Target | Actual | ||
| Calibration 1 | 717,059 | ||
| Calibration 2 | 939,073 | ||
| Calibration 3 | 945,066 | ||
| ssj_ops@calibrated=942,070 | |||
| 100% | 100.1% | 942,070 | 942,716 |
| 90% | 90.0% | 847,863 | 847,661 |
| 80% | 80.2% | 753,656 | 755,335 |
| 70% | 69.8% | 659,449 | 657,516 |
| 60% | 60.1% | 565,242 | 566,130 |
| 50% | 50.0% | 471,035 | 470,855 |
| 40% | 40.0% | 376,828 | 377,267 |
| 30% | 30.0% | 282,621 | 283,002 |
| 20% | 20.0% | 188,414 | 188,116 |
| 10% | 10.0% | 94,207 | 94,107 |
| Active Idle | 0 | 0 | |

| Target Load | Actual Load | ssj_ops | |
|---|---|---|---|
| Target | Actual | ||
| Calibration 1 | 731,857 | ||
| Calibration 2 | 964,985 | ||
| Calibration 3 | 959,485 | ||
| ssj_ops@calibrated=962,235 | |||
| 100% | 100.0% | 962,235 | 962,580 |
| 90% | 89.9% | 866,012 | 864,843 |
| 80% | 79.8% | 769,788 | 767,853 |
| 70% | 69.9% | 673,565 | 672,519 |
| 60% | 59.7% | 577,341 | 574,890 |
| 50% | 50.1% | 481,118 | 481,638 |
| 40% | 39.8% | 384,894 | 383,304 |
| 30% | 30.0% | 288,671 | 288,473 |
| 20% | 20.1% | 192,447 | 193,026 |
| 10% | 10.1% | 96,224 | 96,985 |
| Active Idle | 0 | 0 | |

| Target Load | Actual Load | ssj_ops | |
|---|---|---|---|
| Target | Actual | ||
| Calibration 1 | 701,369 | ||
| Calibration 2 | 928,532 | ||
| Calibration 3 | 927,772 | ||
| ssj_ops@calibrated=928,152 | |||
| 100% | 100.0% | 928,152 | 928,400 |
| 90% | 90.1% | 835,337 | 835,935 |
| 80% | 79.9% | 742,522 | 741,238 |
| 70% | 70.5% | 649,706 | 654,364 |
| 60% | 60.1% | 556,891 | 557,507 |
| 50% | 50.2% | 464,076 | 465,485 |
| 40% | 39.8% | 371,261 | 369,178 |
| 30% | 29.9% | 278,446 | 277,078 |
| 20% | 20.1% | 185,630 | 186,318 |
| 10% | 9.9% | 92,815 | 92,249 |
| Active Idle | 0 | 0 | |

| Target Load | Actual Load | ssj_ops | |
|---|---|---|---|
| Target | Actual | ||
| Calibration 1 | 725,048 | ||
| Calibration 2 | 958,251 | ||
| Calibration 3 | 959,773 | ||
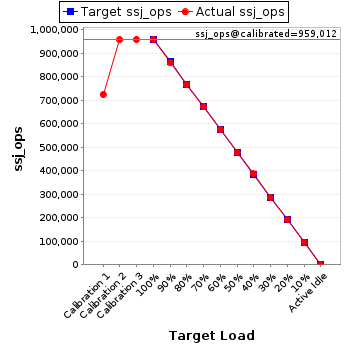
| ssj_ops@calibrated=959,012 | |||
| 100% | 99.9% | 959,012 | 958,095 |
| 90% | 89.7% | 863,111 | 860,428 |
| 80% | 80.0% | 767,210 | 767,368 |
| 70% | 70.2% | 671,308 | 672,789 |
| 60% | 60.1% | 575,407 | 575,941 |
| 50% | 49.9% | 479,506 | 478,405 |
| 40% | 40.3% | 383,605 | 386,390 |
| 30% | 30.0% | 287,704 | 287,936 |
| 20% | 20.0% | 191,802 | 191,469 |
| 10% | 10.0% | 95,901 | 95,719 |
| Active Idle | 0 | 0 | |
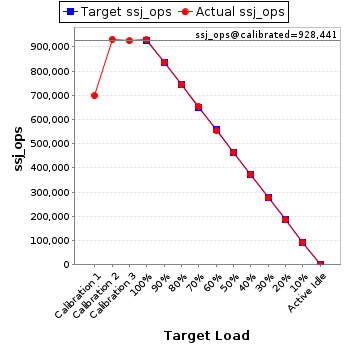
| Target Load | Actual Load | ssj_ops | |
|---|---|---|---|
| Target | Actual | ||
| Calibration 1 | 698,644 | ||
| Calibration 2 | 931,677 | ||
| Calibration 3 | 925,205 | ||
| ssj_ops@calibrated=928,441 | |||
| 100% | 100.1% | 928,441 | 929,295 |
| 90% | 90.1% | 835,597 | 836,770 |
| 80% | 80.2% | 742,753 | 744,291 |
| 70% | 70.5% | 649,909 | 654,229 |
| 60% | 59.8% | 557,065 | 555,432 |
| 50% | 50.1% | 464,221 | 465,234 |
| 40% | 40.2% | 371,376 | 373,518 |
| 30% | 29.8% | 278,532 | 276,911 |
| 20% | 20.0% | 185,688 | 185,534 |
| 10% | 9.9% | 92,844 | 91,884 |
| Active Idle | 0 | 0 | |