
SPECpower_ssj2008
Aggregate Performance Report
Copyright © 2007-2022 Standard Performance Evaluation Corporation
| Hewlett Packard Enterprise Synergy 480 Gen10 Plus Compute Module | ssj_ops@100% = 76,183,750 ssj_ops@100% per Host = 8,464,861 ssj_ops@100% per JVM = 105,811 |
||||
| Test Sponsor: | Hewlett Packard Enterprise | SPEC License #: | 3 | Test Method: | Multi Node |
| Tested By: | Hewlett Packard Enterprise | Test Location: | Houston, TX, USA | Test Date: | Dec 5, 2021 |
| Hardware Availability: | Apr-2021 | Software Availability: | Sep-2021 | Publication: | Feb 3, 2022 |
| System Source: | Single Supplier | System Designation: | Server | Power Provisioning: | Line-powered |
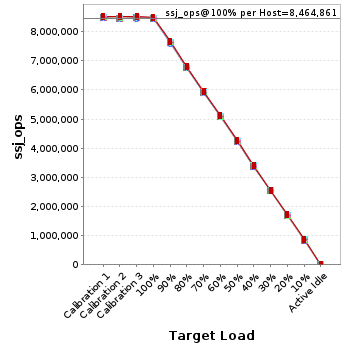
| Target Load | Actual Load | ssj_ops | |
|---|---|---|---|
| Target | Actual | ||
| Calibration 1 | 76,497,541 | ||
| Calibration 2 | 76,358,644 | ||
| Calibration 3 | 76,434,180 | ||
| ssj_ops@calibrated=76,396,412 | |||
| 100% | 99.7% | 76,396,412 | 76,183,750 |
| 90% | 90.0% | 68,756,771 | 68,767,496 |
| 80% | 80.0% | 61,117,130 | 61,107,819 |
| 70% | 70.0% | 53,477,488 | 53,459,233 |
| 60% | 60.0% | 45,837,847 | 45,843,914 |
| 50% | 50.0% | 38,198,206 | 38,202,708 |
| 40% | 40.0% | 30,558,565 | 30,547,665 |
| 30% | 30.0% | 22,918,924 | 22,910,059 |
| 20% | 20.0% | 15,279,282 | 15,279,524 |
| 10% | 10.0% | 7,639,641 | 7,636,319 |
| Active Idle | 0 | 0 | |

| # of Nodes | # of Chips | # of Cores | # of Threads | Total RAM (GB) | # of OS Images | # of JVM Instances |
|---|---|---|---|---|---|---|
| 9 | 18 | 720 | 1,440 | 2,304 | 9 | 720 |
| Set Identifier: | SUT |
| Set Description: | System Under Test |
| # of Identical Nodes: | 9 |
| Comment: | SUT |
| Hardware per Node | |
|---|---|
| Hardware Vendor: | Hewlett Packard Enterprise |
| Model: | Synergy 480 Gen10 Plus Compute Module |
| Form Factor: | Blade |
| CPU Name: | Intel Xeon Platinum 8380 CPU @ 2.30GHz (Intel Turbo Boost Technology up to 3.4GHz) |
| CPU Characteristics: | 40-Core, 2.30 GHz, 60MB L3 Cache |
| CPU Frequency (MHz): | 2300 |
| CPU(s) Enabled: | 80 cores, 2 chips, 40 cores/chip |
| Hardware Threads: | 160 (2 / core) |
| CPU(s) Orderable: | 1,2 chips |
| Primary Cache: | 32 KB I + 48 KB D on chip per core |
| Secondary Cache: | 1280 KB I+D on chip per core |
| Tertiary Cache: | 60 MB I+D on chip per chip |
| Other Cache: | None |
| Memory Amount (GB): | 256 |
| # and size of DIMM: | 16 x 16384 MB |
| Memory Details: | 16 x 16GB 2Rx8 PC4-3200-T; slots 1, 3, 5, 7, 10, 12, 14 & 16 on each socket |
| Power Supply Quantity and Rating (W): | None |
| Power Supply Details: | Shared |
| Disk Drive: | HPE 240GB SATA 6G Read Intensive SFF (P18420-B21) |
| Disk Controller: | Embedded SATA Controller |
| # and type of Network Interface Cards (NICs) Installed: | 1 x HPE Synergy 4820C 10/20/25Gb CNA |
| NICs Enabled in Firmware / OS / Connected: | 2/1/1 |
| Network Speed (Mbit): | 10000 |
| Keyboard: | None |
| Mouse: | None |
| Monitor: | None |
| Optical Drives: | No |
| Other Hardware: | None |
| Software per Node | |
|---|---|
| Power Management: | Enabled (see SUT Notes) |
| Operating System (OS): | Windows Server 2019 Datacenter |
| OS Version: | Version 1809 (Build 17763.2183) |
| Filesystem: | NTFS |
| JVM Vendor: | Oracle Corporation |
| JVM Version: | Oracle Java HotSpot(TM) 64-Bit Server VM 18.9 (build 11.0.11+9-LTS-194, mixed mode) |
| JVM Command-line Options: | -server -Xmn1700m -Xms1950m -Xmx1950m -XX:SurvivorRatio=1 -XX:TargetSurvivorRatio=99 -XX:ParallelGCThreads=2 -XX:AllocatePrefetchDistance=256 -XX:AllocatePrefetchLines=4 -XX:LoopUnrollLimit=45 -XX:InitialTenuringThreshold=12 -XX:MaxTenuringThreshold=15 -XX:InlineSmallCode=3900 -XX:MaxInlineSize=270 -XX:FreqInlineSize=2500 -XX:+UseLargePages -XX:+UseParallelOldGC -XX:UseAVX=0 -XX:-UseAdaptiveSizePolicy -XX:-ThreadLocalHandshakes |
| JVM Affinity: | start /NODE [0,1,2,3] /AFFINITY [3,C,30,C0,300,C00,3000,C000,30000,C0000,300000,C00000,3000000,C000000,30000000,C0000000,300000000,C00000000,3000000000,C000000000] |
| JVM Instances: | 80 |
| JVM Initial Heap (MB): | 1950 |
| JVM Maximum Heap (MB): | 1950 |
| JVM Address Bits: | 64 |
| Boot Firmware Version: | I44 v1.40 (03/05/2021) |
| Management Firmware Version: | 2.40 pass 31 Jan 05 2021 |
| Workload Version: | SSJ 1.2.10 |
| Director Location: | Controller |
| Other Software: | KB5005568 |
| Host | ssj_ops@100% |
|---|---|
| SUT-01 | 8,445,347 |
| SUT-02 | 8,440,621 |
| SUT-03 | 8,482,630 |
| SUT-04 | 8,481,824 |
| SUT-05 | 8,477,498 |
| SUT-06 | 8,450,473 |
| SUT-07 | 8,459,043 |
| SUT-08 | 8,449,989 |
| SUT-09 | 8,496,325 |
| ssj_ops@100% | 76,183,750 |
| ssj_ops@100% per Host | 8,464,861 |
| ssj_ops@100% per JVM | 105,811 |
| Target Load | Actual Load | ssj_ops | |
|---|---|---|---|
| Target | Actual | ||
| Calibration 1 | 8,481,896 | ||
| Calibration 2 | 8,459,322 | ||
| Calibration 3 | 8,477,612 | ||
| ssj_ops@calibrated=8,468,467 | |||
| 100% | 99.7% | 8,468,467 | 8,445,347 |
| 90% | 90.2% | 7,621,620 | 7,634,478 |
| 80% | 80.1% | 6,774,774 | 6,780,713 |
| 70% | 70.0% | 5,927,927 | 5,930,717 |
| 60% | 59.9% | 5,081,080 | 5,076,479 |
| 50% | 50.0% | 4,234,233 | 4,230,705 |
| 40% | 40.0% | 3,387,387 | 3,384,959 |
| 30% | 30.0% | 2,540,540 | 2,539,230 |
| 20% | 20.0% | 1,693,693 | 1,694,809 |
| 10% | 10.0% | 846,847 | 845,543 |
| Active Idle | 0 | 0 | |

| Target Load | Actual Load | ssj_ops | |
|---|---|---|---|
| Target | Actual | ||
| Calibration 1 | 8,472,677 | ||
| Calibration 2 | 8,453,221 | ||
| Calibration 3 | 8,467,494 | ||
| ssj_ops@calibrated=8,460,357 | |||
| 100% | 99.8% | 8,460,357 | 8,440,621 |
| 90% | 89.9% | 7,614,322 | 7,606,540 |
| 80% | 80.0% | 6,768,286 | 6,766,232 |
| 70% | 70.0% | 5,922,250 | 5,918,449 |
| 60% | 60.0% | 5,076,214 | 5,077,172 |
| 50% | 50.0% | 4,230,179 | 4,233,169 |
| 40% | 39.9% | 3,384,143 | 3,379,907 |
| 30% | 30.0% | 2,538,107 | 2,534,857 |
| 20% | 20.0% | 1,692,071 | 1,694,404 |
| 10% | 10.0% | 846,036 | 845,708 |
| Active Idle | 0 | 0 | |

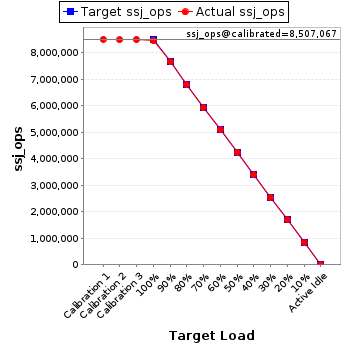
| Target Load | Actual Load | ssj_ops | |
|---|---|---|---|
| Target | Actual | ||
| Calibration 1 | 8,515,585 | ||
| Calibration 2 | 8,501,104 | ||
| Calibration 3 | 8,513,031 | ||
| ssj_ops@calibrated=8,507,067 | |||
| 100% | 99.7% | 8,507,067 | 8,482,630 |
| 90% | 90.1% | 7,656,361 | 7,661,159 |
| 80% | 80.0% | 6,805,654 | 6,807,982 |
| 70% | 69.9% | 5,954,947 | 5,945,481 |
| 60% | 59.9% | 5,104,240 | 5,099,896 |
| 50% | 50.0% | 4,253,534 | 4,251,485 |
| 40% | 40.0% | 3,402,827 | 3,402,715 |
| 30% | 30.0% | 2,552,120 | 2,552,070 |
| 20% | 20.0% | 1,701,413 | 1,700,337 |
| 10% | 10.0% | 850,707 | 849,002 |
| Active Idle | 0 | 0 | |
| Target Load | Actual Load | ssj_ops | |
|---|---|---|---|
| Target | Actual | ||
| Calibration 1 | 8,518,837 | ||
| Calibration 2 | 8,500,835 | ||
| Calibration 3 | 8,505,547 | ||
| ssj_ops@calibrated=8,503,191 | |||
| 100% | 99.7% | 8,503,191 | 8,481,824 |
| 90% | 89.8% | 7,652,872 | 7,637,933 |
| 80% | 80.0% | 6,802,553 | 6,801,147 |
| 70% | 70.0% | 5,952,233 | 5,949,209 |
| 60% | 60.0% | 5,101,914 | 5,104,603 |
| 50% | 50.0% | 4,251,595 | 4,249,391 |
| 40% | 39.9% | 3,401,276 | 3,393,834 |
| 30% | 30.0% | 2,550,957 | 2,548,470 |
| 20% | 20.0% | 1,700,638 | 1,699,456 |
| 10% | 10.0% | 850,319 | 847,892 |
| Active Idle | 0 | 0 | |

| Target Load | Actual Load | ssj_ops | |
|---|---|---|---|
| Target | Actual | ||
| Calibration 1 | 8,501,225 | ||
| Calibration 2 | 8,501,077 | ||
| Calibration 3 | 8,506,275 | ||
| ssj_ops@calibrated=8,503,676 | |||
| 100% | 99.7% | 8,503,676 | 8,477,498 |
| 90% | 90.0% | 7,653,309 | 7,650,720 |
| 80% | 80.0% | 6,802,941 | 6,805,347 |
| 70% | 70.0% | 5,952,573 | 5,951,364 |
| 60% | 60.1% | 5,102,206 | 5,107,166 |
| 50% | 50.0% | 4,251,838 | 4,254,930 |
| 40% | 40.0% | 3,401,471 | 3,399,200 |
| 30% | 30.0% | 2,551,103 | 2,548,782 |
| 20% | 20.0% | 1,700,735 | 1,700,786 |
| 10% | 10.0% | 850,368 | 852,996 |
| Active Idle | 0 | 0 | |

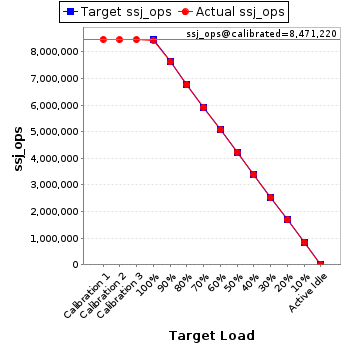
| Target Load | Actual Load | ssj_ops | |
|---|---|---|---|
| Target | Actual | ||
| Calibration 1 | 8,479,740 | ||
| Calibration 2 | 8,468,621 | ||
| Calibration 3 | 8,473,820 | ||
| ssj_ops@calibrated=8,471,220 | |||
| 100% | 99.8% | 8,471,220 | 8,450,473 |
| 90% | 90.0% | 7,624,098 | 7,626,956 |
| 80% | 80.0% | 6,776,976 | 6,778,190 |
| 70% | 69.9% | 5,929,854 | 5,925,019 |
| 60% | 60.0% | 5,082,732 | 5,079,003 |
| 50% | 50.0% | 4,235,610 | 4,237,036 |
| 40% | 40.0% | 3,388,488 | 3,388,952 |
| 30% | 30.0% | 2,541,366 | 2,539,852 |
| 20% | 20.0% | 1,694,244 | 1,694,468 |
| 10% | 10.0% | 847,122 | 850,675 |
| Active Idle | 0 | 0 | |
| Target Load | Actual Load | ssj_ops | |
|---|---|---|---|
| Target | Actual | ||
| Calibration 1 | 8,504,767 | ||
| Calibration 2 | 8,489,379 | ||
| Calibration 3 | 8,486,776 | ||
| ssj_ops@calibrated=8,488,077 | |||
| 100% | 99.7% | 8,488,077 | 8,459,043 |
| 90% | 90.0% | 7,639,270 | 7,639,110 |
| 80% | 80.0% | 6,790,462 | 6,788,554 |
| 70% | 70.1% | 5,941,654 | 5,951,828 |
| 60% | 60.1% | 5,092,846 | 5,105,135 |
| 50% | 50.0% | 4,244,039 | 4,244,422 |
| 40% | 40.0% | 3,395,231 | 3,396,045 |
| 30% | 30.0% | 2,546,423 | 2,547,601 |
| 20% | 20.0% | 1,697,615 | 1,697,370 |
| 10% | 10.0% | 848,808 | 845,806 |
| Active Idle | 0 | 0 | |

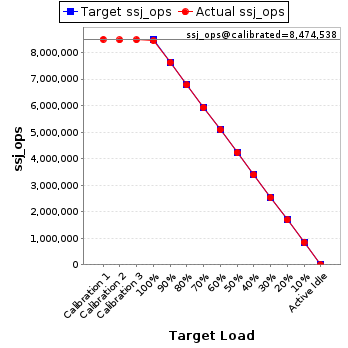
| Target Load | Actual Load | ssj_ops | |
|---|---|---|---|
| Target | Actual | ||
| Calibration 1 | 8,499,755 | ||
| Calibration 2 | 8,471,595 | ||
| Calibration 3 | 8,477,481 | ||
| ssj_ops@calibrated=8,474,538 | |||
| 100% | 99.7% | 8,474,538 | 8,449,989 |
| 90% | 90.1% | 7,627,084 | 7,633,186 |
| 80% | 80.0% | 6,779,630 | 6,777,860 |
| 70% | 69.9% | 5,932,177 | 5,926,687 |
| 60% | 60.0% | 5,084,723 | 5,084,847 |
| 50% | 50.0% | 4,237,269 | 4,234,737 |
| 40% | 40.0% | 3,389,815 | 3,387,771 |
| 30% | 30.0% | 2,542,361 | 2,542,612 |
| 20% | 20.0% | 1,694,908 | 1,691,503 |
| 10% | 10.0% | 847,454 | 848,764 |
| Active Idle | 0 | 0 | |
| Target Load | Actual Load | ssj_ops | |
|---|---|---|---|
| Target | Actual | ||
| Calibration 1 | 8,523,059 | ||
| Calibration 2 | 8,513,491 | ||
| Calibration 3 | 8,526,144 | ||
| ssj_ops@calibrated=8,519,817 | |||
| 100% | 99.7% | 8,519,817 | 8,496,325 |
| 90% | 90.1% | 7,667,836 | 7,677,413 |
| 80% | 79.8% | 6,815,854 | 6,801,792 |
| 70% | 70.0% | 5,963,872 | 5,960,480 |
| 60% | 60.0% | 5,111,890 | 5,109,614 |
| 50% | 50.1% | 4,259,909 | 4,266,834 |
| 40% | 40.1% | 3,407,927 | 3,414,284 |
| 30% | 30.0% | 2,555,945 | 2,556,585 |
| 20% | 20.0% | 1,703,963 | 1,706,392 |
| 10% | 10.0% | 851,982 | 849,934 |
| Active Idle | 0 | 0 | |
