SPECpower_ssj2008
Aggregate Performance Report
Copyright © 2007-2022 Standard Performance Evaluation Corporation
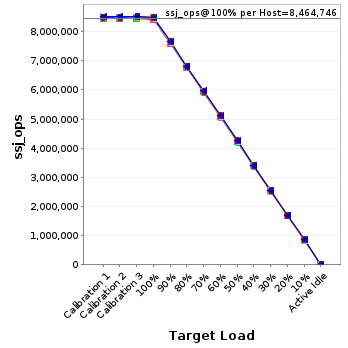
| Hewlett Packard Enterprise Synergy 480 Gen10 Plus Compute Module | ssj_ops@100% = 84,647,457 ssj_ops@100% per Host = 8,464,746 ssj_ops@100% per JVM = 105,809 |
||||
| Test Sponsor: | Hewlett Packard Enterprise | SPEC License #: | 3 | Test Method: | Multi Node |
| Tested By: | Hewlett Packard Enterprise | Test Location: | Houston, TX, USA | Test Date: | Dec 5, 2021 |
| Hardware Availability: | Apr-2021 | Software Availability: | Sep-2021 | Publication: | Feb 3, 2022 |
| System Source: | Single Supplier | System Designation: | Server | Power Provisioning: | Line-powered |
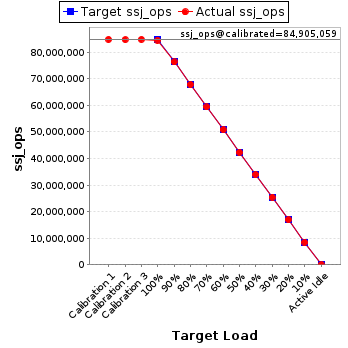
| Target Load | Actual Load | ssj_ops | |
|---|---|---|---|
| Target | Actual | ||
| Calibration 1 | 84,943,042 | ||
| Calibration 2 | 84,857,135 | ||
| Calibration 3 | 84,952,983 | ||
| ssj_ops@calibrated=84,905,059 | |||
| 100% | 99.7% | 84,905,059 | 84,647,457 |
| 90% | 90.0% | 76,414,553 | 76,384,029 |
| 80% | 80.0% | 67,924,047 | 67,909,743 |
| 70% | 70.0% | 59,433,541 | 59,432,664 |
| 60% | 60.0% | 50,943,035 | 50,924,501 |
| 50% | 50.0% | 42,452,530 | 42,423,693 |
| 40% | 40.0% | 33,962,024 | 33,966,281 |
| 30% | 30.0% | 25,471,518 | 25,475,816 |
| 20% | 20.0% | 16,981,012 | 16,979,966 |
| 10% | 10.0% | 8,490,506 | 8,485,963 |
| Active Idle | 0 | 0 | |
| # of Nodes | # of Chips | # of Cores | # of Threads | Total RAM (GB) | # of OS Images | # of JVM Instances |
|---|---|---|---|---|---|---|
| 10 | 20 | 800 | 1,600 | 2,560 | 10 | 800 |
| Set Identifier: | SUT |
| Set Description: | System Under Test |
| # of Identical Nodes: | 10 |
| Comment: | SUT |
| Hardware per Node | |
|---|---|
| Hardware Vendor: | Hewlett Packard Enterprise |
| Model: | Synergy 480 Gen10 Plus Compute Module |
| Form Factor: | Blade |
| CPU Name: | Intel Xeon Platinum 8380 CPU @ 2.30GHz (Intel Turbo Boost Technology up to 3.4GHz) |
| CPU Characteristics: | 40-Core, 2.30 GHz, 60MB L3 Cache |
| CPU Frequency (MHz): | 2300 |
| CPU(s) Enabled: | 80 cores, 2 chips, 40 cores/chip |
| Hardware Threads: | 160 (2 / core) |
| CPU(s) Orderable: | 1,2 chips |
| Primary Cache: | 32 KB I + 48 KB D on chip per core |
| Secondary Cache: | 1280 KB I+D on chip per core |
| Tertiary Cache: | 60 MB I+D on chip per chip |
| Other Cache: | None |
| Memory Amount (GB): | 256 |
| # and size of DIMM: | 16 x 16384 MB |
| Memory Details: | 16 x 16GB 2Rx8 PC4-3200-T; slots 1, 3, 5, 7, 10, 12, 14 & 16 on each socket |
| Power Supply Quantity and Rating (W): | None |
| Power Supply Details: | Shared |
| Disk Drive: | HPE 240GB SATA 6G Read Intensive SFF (P18420-B21) |
| Disk Controller: | Embedded SATA Controller |
| # and type of Network Interface Cards (NICs) Installed: | 1 x HPE Synergy 4820C 10/20/25Gb CNA |
| NICs Enabled in Firmware / OS / Connected: | 2/1/1 |
| Network Speed (Mbit): | 10000 |
| Keyboard: | None |
| Mouse: | None |
| Monitor: | None |
| Optical Drives: | No |
| Other Hardware: | None |
| Software per Node | |
|---|---|
| Power Management: | Enabled (see SUT Notes) |
| Operating System (OS): | Windows Server 2019 Datacenter |
| OS Version: | Version 1809 (Build 17763.2183) |
| Filesystem: | NTFS |
| JVM Vendor: | Oracle Corporation |
| JVM Version: | Oracle Java HotSpot(TM) 64-Bit Server VM 18.9 (build 11.0.11+9-LTS-194, mixed mode) |
| JVM Command-line Options: | -server -Xmn1700m -Xms1950m -Xmx1950m -XX:SurvivorRatio=1 -XX:TargetSurvivorRatio=99 -XX:ParallelGCThreads=2 -XX:AllocatePrefetchDistance=256 -XX:AllocatePrefetchLines=4 -XX:LoopUnrollLimit=45 -XX:InitialTenuringThreshold=12 -XX:MaxTenuringThreshold=15 -XX:InlineSmallCode=3900 -XX:MaxInlineSize=270 -XX:FreqInlineSize=2500 -XX:+UseLargePages -XX:+UseParallelOldGC -XX:UseAVX=0 -XX:-UseAdaptiveSizePolicy -XX:-ThreadLocalHandshakes |
| JVM Affinity: | start /NODE [0,1,2,3] /AFFINITY [3,C,30,C0,300,C00,3000,C000,30000,C0000,300000,C00000,3000000,C000000,30000000,C0000000,300000000,C00000000,3000000000,C000000000] |
| JVM Instances: | 80 |
| JVM Initial Heap (MB): | 1950 |
| JVM Maximum Heap (MB): | 1950 |
| JVM Address Bits: | 64 |
| Boot Firmware Version: | I44 v1.40 (03/05/2021) |
| Management Firmware Version: | 2.40 pass 31 Jan 05 2021 |
| Workload Version: | SSJ 1.2.10 |
| Director Location: | Controller |
| Other Software: | KB5005568 |
| Host | ssj_ops@100% |
|---|---|
| SUT-01 | 8,429,528 |
| SUT-02 | 8,410,567 |
| SUT-03 | 8,455,569 |
| SUT-04 | 8,474,037 |
| SUT-05 | 8,496,406 |
| SUT-06 | 8,472,122 |
| SUT-07 | 8,475,682 |
| SUT-08 | 8,461,455 |
| SUT-09 | 8,484,135 |
| SUT-10 | 8,487,955 |
| ssj_ops@100% | 84,647,457 |
| ssj_ops@100% per Host | 8,464,746 |
| ssj_ops@100% per JVM | 105,809 |
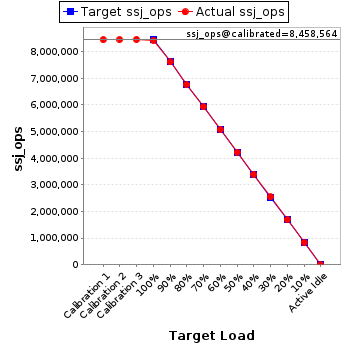
| Target Load | Actual Load | ssj_ops | |
|---|---|---|---|
| Target | Actual | ||
| Calibration 1 | 8,447,402 | ||
| Calibration 2 | 8,454,019 | ||
| Calibration 3 | 8,463,109 | ||
| ssj_ops@calibrated=8,458,564 | |||
| 100% | 99.7% | 8,458,564 | 8,429,528 |
| 90% | 90.0% | 7,612,708 | 7,609,899 |
| 80% | 80.0% | 6,766,851 | 6,763,024 |
| 70% | 70.1% | 5,920,995 | 5,930,568 |
| 60% | 60.0% | 5,075,138 | 5,078,572 |
| 50% | 50.0% | 4,229,282 | 4,227,038 |
| 40% | 40.1% | 3,383,426 | 3,392,633 |
| 30% | 30.1% | 2,537,569 | 2,544,355 |
| 20% | 20.0% | 1,691,713 | 1,693,220 |
| 10% | 10.0% | 845,856 | 841,770 |
| Active Idle | 0 | 0 | |
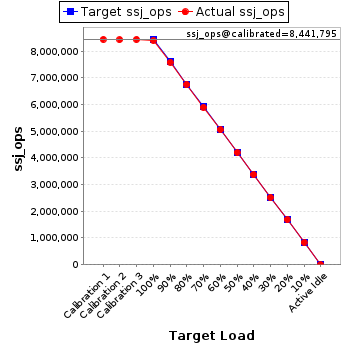
| Target Load | Actual Load | ssj_ops | |
|---|---|---|---|
| Target | Actual | ||
| Calibration 1 | 8,447,568 | ||
| Calibration 2 | 8,436,342 | ||
| Calibration 3 | 8,447,249 | ||
| ssj_ops@calibrated=8,441,795 | |||
| 100% | 99.6% | 8,441,795 | 8,410,567 |
| 90% | 89.9% | 7,597,616 | 7,589,401 |
| 80% | 80.1% | 6,753,436 | 6,758,913 |
| 70% | 70.0% | 5,909,257 | 5,906,195 |
| 60% | 60.0% | 5,065,077 | 5,064,288 |
| 50% | 49.9% | 4,220,898 | 4,208,854 |
| 40% | 40.0% | 3,376,718 | 3,378,386 |
| 30% | 29.9% | 2,532,539 | 2,527,393 |
| 20% | 20.1% | 1,688,359 | 1,694,237 |
| 10% | 9.9% | 844,180 | 838,934 |
| Active Idle | 0 | 0 | |
| Target Load | Actual Load | ssj_ops | |
|---|---|---|---|
| Target | Actual | ||
| Calibration 1 | 8,489,014 | ||
| Calibration 2 | 8,473,890 | ||
| Calibration 3 | 8,484,647 | ||
| ssj_ops@calibrated=8,479,269 | |||
| 100% | 99.7% | 8,479,269 | 8,455,569 |
| 90% | 90.0% | 7,631,342 | 7,632,659 |
| 80% | 80.1% | 6,783,415 | 6,792,896 |
| 70% | 70.0% | 5,935,488 | 5,935,070 |
| 60% | 60.0% | 5,087,561 | 5,085,670 |
| 50% | 49.9% | 4,239,634 | 4,234,173 |
| 40% | 40.0% | 3,391,707 | 3,388,569 |
| 30% | 30.0% | 2,543,781 | 2,546,677 |
| 20% | 20.0% | 1,695,854 | 1,694,093 |
| 10% | 10.0% | 847,927 | 846,234 |
| Active Idle | 0 | 0 | |

| Target Load | Actual Load | ssj_ops | |
|---|---|---|---|
| Target | Actual | ||
| Calibration 1 | 8,506,038 | ||
| Calibration 2 | 8,492,548 | ||
| Calibration 3 | 8,505,549 | ||
| ssj_ops@calibrated=8,499,048 | |||
| 100% | 99.7% | 8,499,048 | 8,474,037 |
| 90% | 89.9% | 7,649,144 | 7,641,067 |
| 80% | 79.9% | 6,799,239 | 6,789,267 |
| 70% | 70.0% | 5,949,334 | 5,945,265 |
| 60% | 60.0% | 5,099,429 | 5,098,238 |
| 50% | 50.0% | 4,249,524 | 4,249,941 |
| 40% | 40.0% | 3,399,619 | 3,398,858 |
| 30% | 30.1% | 2,549,715 | 2,554,736 |
| 20% | 20.0% | 1,699,810 | 1,698,532 |
| 10% | 10.0% | 849,905 | 847,363 |
| Active Idle | 0 | 0 | |

| Target Load | Actual Load | ssj_ops | |
|---|---|---|---|
| Target | Actual | ||
| Calibration 1 | 8,516,720 | ||
| Calibration 2 | 8,509,151 | ||
| Calibration 3 | 8,520,008 | ||
| ssj_ops@calibrated=8,514,580 | |||
| 100% | 99.8% | 8,514,580 | 8,496,406 |
| 90% | 89.9% | 7,663,122 | 7,657,504 |
| 80% | 80.0% | 6,811,664 | 6,814,660 |
| 70% | 70.0% | 5,960,206 | 5,955,949 |
| 60% | 59.9% | 5,108,748 | 5,097,369 |
| 50% | 50.0% | 4,257,290 | 4,258,039 |
| 40% | 40.0% | 3,405,832 | 3,402,676 |
| 30% | 30.0% | 2,554,374 | 2,553,793 |
| 20% | 20.0% | 1,702,916 | 1,699,654 |
| 10% | 10.0% | 851,458 | 848,466 |
| Active Idle | 0 | 0 | |

| Target Load | Actual Load | ssj_ops | |
|---|---|---|---|
| Target | Actual | ||
| Calibration 1 | 8,491,605 | ||
| Calibration 2 | 8,486,995 | ||
| Calibration 3 | 8,492,756 | ||
| ssj_ops@calibrated=8,489,875 | |||
| 100% | 99.8% | 8,489,875 | 8,472,122 |
| 90% | 89.9% | 7,640,888 | 7,635,494 |
| 80% | 79.8% | 6,791,900 | 6,774,946 |
| 70% | 70.0% | 5,942,913 | 5,941,985 |
| 60% | 59.9% | 5,093,925 | 5,088,882 |
| 50% | 50.0% | 4,244,938 | 4,242,596 |
| 40% | 40.0% | 3,395,950 | 3,393,739 |
| 30% | 30.0% | 2,546,963 | 2,547,948 |
| 20% | 20.0% | 1,697,975 | 1,698,177 |
| 10% | 10.0% | 848,988 | 847,425 |
| Active Idle | 0 | 0 | |

| Target Load | Actual Load | ssj_ops | |
|---|---|---|---|
| Target | Actual | ||
| Calibration 1 | 8,510,454 | ||
| Calibration 2 | 8,497,412 | ||
| Calibration 3 | 8,505,717 | ||
| ssj_ops@calibrated=8,501,564 | |||
| 100% | 99.7% | 8,501,564 | 8,475,682 |
| 90% | 90.0% | 7,651,408 | 7,652,970 |
| 80% | 80.0% | 6,801,252 | 6,805,310 |
| 70% | 70.1% | 5,951,095 | 5,956,444 |
| 60% | 59.9% | 5,100,939 | 5,094,275 |
| 50% | 50.0% | 4,250,782 | 4,249,351 |
| 40% | 40.0% | 3,400,626 | 3,403,468 |
| 30% | 30.0% | 2,550,469 | 2,553,176 |
| 20% | 20.0% | 1,700,313 | 1,700,754 |
| 10% | 10.1% | 850,156 | 855,877 |
| Active Idle | 0 | 0 | |

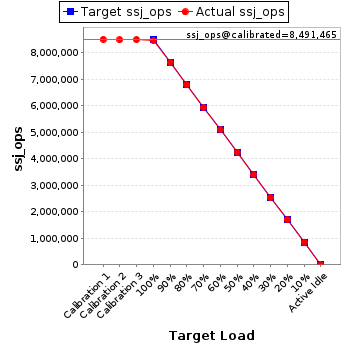
| Target Load | Actual Load | ssj_ops | |
|---|---|---|---|
| Target | Actual | ||
| Calibration 1 | 8,507,766 | ||
| Calibration 2 | 8,487,566 | ||
| Calibration 3 | 8,495,365 | ||
| ssj_ops@calibrated=8,491,465 | |||
| 100% | 99.6% | 8,491,465 | 8,461,455 |
| 90% | 90.0% | 7,642,319 | 7,643,013 |
| 80% | 80.0% | 6,793,172 | 6,792,103 |
| 70% | 69.9% | 5,944,026 | 5,938,488 |
| 60% | 60.0% | 5,094,879 | 5,096,463 |
| 50% | 50.0% | 4,245,733 | 4,244,286 |
| 40% | 40.0% | 3,396,586 | 3,394,176 |
| 30% | 30.0% | 2,547,440 | 2,543,584 |
| 20% | 20.1% | 1,698,293 | 1,702,696 |
| 10% | 10.1% | 849,147 | 853,623 |
| Active Idle | 0 | 0 | |
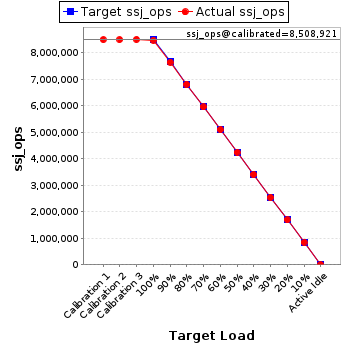
| Target Load | Actual Load | ssj_ops | |
|---|---|---|---|
| Target | Actual | ||
| Calibration 1 | 8,503,819 | ||
| Calibration 2 | 8,504,100 | ||
| Calibration 3 | 8,513,741 | ||
| ssj_ops@calibrated=8,508,921 | |||
| 100% | 99.7% | 8,508,921 | 8,484,135 |
| 90% | 89.9% | 7,658,029 | 7,650,593 |
| 80% | 80.1% | 6,807,137 | 6,816,697 |
| 70% | 70.0% | 5,956,244 | 5,958,347 |
| 60% | 60.0% | 5,105,352 | 5,106,112 |
| 50% | 49.9% | 4,254,460 | 4,249,594 |
| 40% | 40.0% | 3,403,568 | 3,406,584 |
| 30% | 29.9% | 2,552,676 | 2,546,531 |
| 20% | 19.9% | 1,701,784 | 1,694,299 |
| 10% | 10.0% | 850,892 | 851,086 |
| Active Idle | 0 | 0 | |
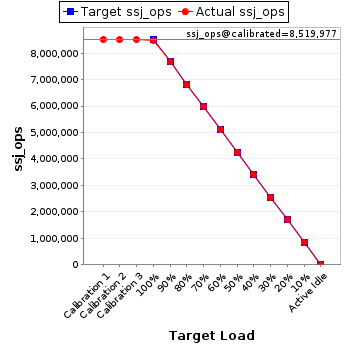
| Target Load | Actual Load | ssj_ops | |
|---|---|---|---|
| Target | Actual | ||
| Calibration 1 | 8,522,656 | ||
| Calibration 2 | 8,515,112 | ||
| Calibration 3 | 8,524,842 | ||
| ssj_ops@calibrated=8,519,977 | |||
| 100% | 99.6% | 8,519,977 | 8,487,955 |
| 90% | 90.0% | 7,667,979 | 7,671,428 |
| 80% | 79.8% | 6,815,982 | 6,801,927 |
| 70% | 70.0% | 5,963,984 | 5,964,354 |
| 60% | 60.0% | 5,111,986 | 5,114,634 |
| 50% | 50.0% | 4,259,989 | 4,259,820 |
| 40% | 40.0% | 3,407,991 | 3,407,193 |
| 30% | 30.0% | 2,555,993 | 2,557,623 |
| 20% | 20.0% | 1,703,995 | 1,704,303 |
| 10% | 10.0% | 851,998 | 855,185 |
| Active Idle | 0 | 0 | |