Click
 to go to an example.
| $Id: config.html 6753 2024-03-26 17:32:59Z JohnHenning $ | Latest: www.spec.org/cpu2017/Docs/ |
|---|
This document describes config files for SPEC CPU®2017, a product of the SPEC® non-profit corporation (about SPEC).
|
A. What is a config file? B. Benchmark selection C. Five consumers |
D. Config file syntax 1. Sections and scope 2. Comments 3. Whitespace 4. Quoting 5. Line continuation 6. Included files 7. Section markers E. Section merging |
F. Variables 1. Defining variables 2. $[square] substitution 3. Useful $[variables] 4. ${curly} interpolation 5. Useful ${variables} 6. Unsetting "%undef%" 7. Debug tips |
All variable types $(MAKEVAR)\$SHELLVAR $[startup] ${during_run}/$during_run %{macro} %{ENV_var} New with CPU 2017 |
II. Config file options for runcpu
A. Precedence: config file vs. runcpu command line
B. Options
action
allow_label_overrideNew
backup_config
basepeak
bind
check_version
command_add_redirect
copies
current_rangeNew
delay
deletework
difflines
enable_monitorNew
env_vars
expand_notes
expid
fail
fail_build
fail_run
feedback
flagsurl
force_monitorNew
http_proxy
http_timeout
idle_current_rangeNew
ignore_errors
ignore_sigint
info_wrap_columns
iterations
keeptmp
labelNew
line_width
locking
log_line_width
log_timestamp
mail_reports
mailcompress
mailmethod
mailport
mailserver
mailto
make
make_no_clobber
makeflags
mean_anyway
minimize_builddirs
minimize_rundirs
nobuild
no_input_handler
no_monitor
notes_wrap_columns
notes_wrap_indent
output_format
output_root
parallel_test
parallel_test_submit
parallel_test_workloadsNew
plain_train
powerNew
power_analyzerNew
preenv
rebuild
reportable
runlist
save_build_filesNew
section_specifier_fatal
setprocgroup
size
src.alt
strict_rundir_verify
sysinfo_program
table
teeout
temp_meterNew
threadsNew
train_single_threadNew
train_with
tune
use_submit_for_compareNew
use_submit_for_speed
verbose
verify_binariesNew
voltage_rangeNew
Power measurement was introduced as an experimental feature in CPU 2017 v1.0.
As of v1.1, more fields have been added, and the feature is now fully supported.
III. Config file options for specmake
|
A. Commonly used Make variables
CC, CXX, FC |
B. New with CPU 2017: Using OpenMP and/or Autopar 1. Summary 2. SPECrate: no OpenMP. No Autopar. 3. SPECspeed: your choice 4. Detail - conditions for enabling OpenMP |
C. Creating your own Make variables D. += is available but use with caution E. Using buildsetup to create a sandbox F. About Automatic Rebuilds |
|
{C|CXX|F}C_VERSION_OPTION New and required with CPU 2017 |
||
IV. Config file options for the shell
|
A. \$SHELLVAR variable substitution B. Shell Options bench_post_setup build_pre_bench build_post_bench fdo_make_clean_passN fdo_make_passN fdo_postN fdo_post_makeN fdo_pre0 fdo_preN fdo_pre_makeN fdo_runN monitor_X post_setup submit |
C. Using submit 1. Basic usage 2. Script generation 3. Quote traps 4. Debug tips 5. Maintainability 6. Reporting |
V. Config file options for human readers
VI. Using Feedback Directed Optimization (FDO)
|
A. Minimum required: PASSn or fdo_ B. Flexible build models C. The config file feedback option D. runcpu --feedback |
VII. The config file preprocessor
|
A. Introduction B. Preprocessor Syntax Basics 1. Column 1. Always Punch Column 1 2. One line per directive 3. Comments C. Macro Definition 1. Defining Macros 2. Undefining macros 3. Redefining macros |
D. Macro Usage E. Conditionals 1. %ifdef 2. %ifndef 3. %if and expression evaluation 4. %else 5. %elif 6. Preprocessor Example: Picking CPUs |
F. Informational Directives 1. %warning 2. %error 3. %info New with CPU 2017 4. %dumpmacros New with CPU 2017 G. Predefined macros and the environment New with CPU 2017 1. Automating output_root 2. Example: Adjusting the Environment |
VIII. Output files - and how they relate to your config file
|
A. Help, I've got too many config files! B. The log file 1. Useful Search Strings 2. About Temporary Debug Logs 3. Verbosity levels C. Deciphering an FDO log file |
D. Help, I've got too many log files! E. Finding the build directory F. Files in the build directory G. For more information |
A. Getting started with power measurement
B. PTD examples
C. Descriptive fields for power and temperature
D. Current ranges
E. Power questions?
A. Auxiliary benchmark sets
B. Troubleshooting
C. Obsolete/removed items
allow_extension_override company_name ext hw_cpu_char hw_cpu_mhz hw_cpu_ncoresperchip hw_fpu mach machine_name max_active_compares rate speed sw_auto_parallel test_date tester_name VENDOR
I.A. What is a config file?A SPEC CPU config file is a file that defines how to build, run, and report on the SPEC CPU benchmarks in a particular environment. It defines how SPEC CPU 2017 interacts with your test environment, and lets you describe that environment in human-readable form. A config file provides detailed control of testing, including:
Using your customized options, the SPEC CPU tools automatically create Makefiles, build the benchmarks, run them, generate reports, and write log files. Because they collect your options into one place, config files are key to result reproducibility. For example, if a vendor publishes CPU 2017 results for the SuperHero Model 42 at the SPEC web site www.spec.org/cpu2017, it is expected that a customer can demonstrate similar performance using only 3 ingredients:
|
q. This document looks big and intimidating. Where do I start? a. Don't start here. Start with the Overview and Using SPEC CPU 2017 - the 'runcpu' Command. Afer that, please read section I.C carefully, which explains that config files contain options for five (5) different consumers. You need to recognize which options are for which consumers. Please notice that config files have 3 kinds of sections. You need to know how named sections work. From that point on, you can probably skip around among topics as they may interest you. Tip: Most topics can be found by adding '#topic' to the URL for this document. Examples: #consumers #shell #readers #sw_compiler #OpenMP |
In a config file, you can reference: One or more individual benchmarks, such as 500.perlbench_r, or entire suites, using the Short Tags in the table below.
| Short Tag |
Suite | Contents | Metrics | How many copies? What do Higher Scores Mean? |
| intspeed | SPECspeed® 2017 Integer | 10 integer benchmarks | SPECspeed®2017_int_base SPECspeed®2017_int_peak SPECspeed®2017_int_energy_base SPECspeed®2017_int_energy_peak |
SPECspeed suites always run one copy of each benchmark.
Higher scores indicate that less time is needed. |
| fpspeed | SPECspeed® 2017 Floating Point | 10 floating point benchmarks | SPECspeed®2017_fp_base SPECspeed®2017_fp_peak SPECspeed®2017_fp_energy_base SPECspeed®2017_fp_energy_peak |
|
| intrate | SPECrate® 2017 Integer | 10 integer benchmarks | SPECrate®2017_int_base SPECrate®2017_int_peak SPECrate®2017_int_energy_base SPECrate®2017_int_energy_peak |
SPECrate suites run multiple concurrent copies of
each benchmark.
The tester selects how many. Higher scores indicate more throughput (work per unit of time). |
| fprate | SPECrate® 2017 Floating Point | 13 floating point benchmarks | SPECrate®2017_fp_base SPECrate®2017_fp_peak SPECrate®2017_fp_energy_base SPECrate®2017_fp_energy_peak |
|
|
The "Short Tag" is the canonical abbreviation for use with runcpu, where context
is defined by the tools. In a published document, context may not be clear.
To avoid ambiguity in published documents, the Suite Name or the Metrics should be spelled as shown above. |
||||
(Other benchmarks sets are available, but must be used with great caution. They are described in Appendix A.)
A config file has content for five (5) distinct consumers, as shown in the table.
To understand a config file, you must understand which consumer is addressed at any given
point.
Column 3 below provides a few examples for each; click the roman numerals in column 2 for many more.
| Consumer | List of options |
Examples | Brief description |
| runcpu | II |
copies
output_format reportable threads |
Options that change how runcpu itself works. Many should be familiar from Using SPEC CPU 2017. output_format = text,csv tune = base reportable = yes runlist = fpspeed then the defaults for the runcpu command would change as shown. Both of these would do the same thing: runcpu --config=michael runcpu --config=michael --output=text,csv --tune=base --reportable fpspeed |
|---|---|---|---|
| specmake | III |
OPTIMIZE
PORTABILITY |
Make variables, to control benchmark builds via specmake.
Commonly used specmake variables: section III
|
| shell (or cmd.exe) |
IV |
fdo_post1
fdo_run1 post_setup submit |
Commands to be executed by the Unix shell (/bin/sh) or the Windows command interpreter
(cmd.exe).
fdo_pre0 = rm -Rf /tmp/manmohan/feedback
fdo_pre1 = mkdir /tmp/manmohan/feedback
Above, a directory (and all its contents) are deleted, and a new one created, prior to a training run for feedback-directed optimization.
Warning: SPEC CPU config files can execute arbitrary
shell commands.
|
| readers | V | hw_model
notes100 sw_compiler |
System Under Test (SUT) description, with enough detail so that the reader can understand what was tested and can reproduce your results. If a SPEC CPU 2017 result is published (whether at SPEC or independently) it must be fully described. |
| preprocessor | VII | %define
%ifdef |
Preprocessing directives and definitions to adjust your config file prior to use. All preprocessor directives begin in column 1. Example:
%if %{bits} == 64
%   define model  -m64
%else
%   define model  -m32
%endif
CC  = gcc %{model}
|
A config file contains: a header section, named sections, and a HASH section.
Scope: Every line is considered to be within the scope of one of these three. Lines prior to the first section marker are in the scope of the header section. All other lines are either in the scope of the most recently preceding section marker or in the HASH section.
| Sections | Description | Example |
| header section |
The header section is the first section, prior to the any named section. Most attempts to address runcpu itself are done in the header section. In the example, lines 1 through 6 are in the header section. |
$ cat -n threeSections.cfg
 1  flagsurl             = $[top]/config/flags/gcc.xml
 2  iterations           = 1
 3  output_format        = text
 4  runlist              = 519.lbm_r
 5  size                 = test
 6  tune                 = peak
 7  fprate=peak:
 8     CC_VERSION_OPTION = -v
 9     CC                = gcc
10     OPTIMIZE          = -O2
11  519.lbm_r=peak:
12     OPTIMIZE          = -O3
13
14  __HASH__
15  519.lbm_r=peak=none:
16  # Last updated 2017-02-06 14:29:40
17  opthash=ff6059d6d9ec9577f7f49d05178c58688f31004089
18  baggage=
19  compiler_version=\
20  @eNo1jbEOgjAYhPc+RUcdaFEJIWwGHEhQjBLjRn7LLzapLWkL8
21  kpP9OCqkdX070hmtk0bTjMUspiuhQA9RFgfDki3brEkLdkCf0y
22  0NO36VHldDROLqTSzoNS2JfS5pT/DqUAH54cv4tAsjDEC6M9au
23  FuH/CZ+c5Q+pyRd+tUlX
24  compile_options=\
25  @eNp1T11PgzAUfe+vaPrOMjNfJGMJlLqhQBtLX3xptHYGBWoKM
26  vNp93Vjs3obadX2I+sHXZtD+0D3VXr9bX+8/InJBEMAeKBFZLq
27  KgWj06epUADLlCVqe+rFquJaKiHumJSaC1YWAuOAr/DPWvfu4I
28  mALF6zzeSpj96+RITFhJd3rG/dMaQTzEIJYV2T0DJl8RlGfl7Z
29  hjyd8vw+D9MirnY6z5LRW9NOC1yNkc/OfAJtxnuD
30  exehash=5290fe504238c6de1a13e275ab8ca11e035fbb4e7e
31
$
|
|---|---|---|
| or default: |
Options for the header section may also be entered in section default=default=default: or a shorter spelling thereof, such as default: This can be helpful if you need to effectively return to the header section, perhaps when using include. Tip: Nevertheless, it is usually easier to maintain a config files that keeps all runcpu options near the top, preferably in alphabetical order. |
|
| Named sections |
A named section is a portion of the config file that follows a line that contains a section marker. Briefly, a section marker is a 1-to-3 part string with equals signs in the middle and a colon at the end; see detail below. The example has 2 named sections, delimited by 2 section markers on lines 7 and 11. Notice that the example sets OPTIMIZE in both of the named sections. To understand which one gets used, see the precedence rules, which describe how sections interact. |
|
| HASH section |
The HASH Section is the final, automatically-generated section. It starts with __HASH__ and contains checksums. The example starts the HASH section at line 14. (For readability, the lines are truncated on the right.) The automatically-updated checksums ensure that binaries match their config file. You can optionally disable checking, but doing so is strongly discouraged. See verify_binaries. Config files printed by --output_format=config do not include the HASH section. |
Comments begin with '#'. There are two types:
| Syntax | Type | Saved? | Detail |
|---|---|---|---|
| # | Regular | Yes | Regular comments can be full-line or trailing. A copy of your config file is saved with the test results. If you submit your results to SPEC for publication, the regular comments can be read by anyone. |
| #> | Protected | No | A full-line comment that begins with #> is a protected comment and will not be saved with your results. You can use protected comments for proprietary information, for example: #> I didn't use the C++ beta because of Bob's big back-end bug. |
Both types of comments are ignored when processing the config file.
Full-line comments: If # is the first non-blank item on a line, then the whole line is a comment. Comment lines can be placed anywhere in a config file.
Trailing comments: If a line has non-blank items, you can (usually) add regular comments. You cannot write a protected trailing comment. If you try to use a protected comment after some other element, it is treated as a regular comment.
All comments below will be saved except the one that says 'NOT saved'.
                       # New optimizers.
default=base:          # Most optimizers go up to ten.
   OPTIMIZE   = -O11   #    These go to eleven.
                       #> This comment is NOT saved
   COPTIMIZE  = -std   #> This comment is saved
Not a comment: These instances of # do not start a comment:
\# To use a # without starting a comment, put a backslash in front of it:
hw_model = Mr. Lee's \#1 Semi-Autonomous Unit
notesN...# Config file notes are printed in reports as entered, including any instances of #
#notes100  = This note will not be printed, because # was the first item on the line.T
notes110   = This note will be printed in reports.  All of it.  # Even this part.
Blank lines can be placed anywhere in a config file. They are ignored.
Spaces at the beginning of lines are ignored, with the exception that preprocessor directives always begin with a percent sign (%) in the first column. You can put spaces after the percent sign, if you wish (example).
Spaces within a line are usually ignored. Don't try to break up a section marker, and you can't break up a single word (say 'OPTIMIZE' not 'OPT I MIZE'). If multiple spaces separate line elements, it is as if there were only one space. Each of these have the same meaning:
   OPTIMIZE=-O2 -noalias
   OPTIMIZE   =  -O2      -noalias
One place where spaces are considered significant is in notes, where you can use spaces to line up your comments. Notes are printed in a fixed-width font.
Trailing spaces and tabs are ignored, unless they are preceded by a backslash. For example, if space.cfg contains:
$ cat trailing_space.cfg
PATH1   = /path/without/any/trailer
FC      = $(PATH1)/f90
PATH2   = /path/with/trailing/space\
CC      = $(PATH2)/cc
$
then we can use fake to demonstrate the compile commands that would be generated (+ Unix commands grep, head, and cut to pick out one example).
$ cat trailing_space.sh
runcpu -c space --fake 527.cam4 | grep without/ | head -1 | cut -b 1-80
runcpu -c space --fake 527.cam4 | grep trailing | head -1 | cut -b 1-80
$
$ ./trailing_space.sh
/path/without/any/trailer/f90 -c -o ESMF_BaseMod.fppized.o -I. -Iinclude -Inetcd
/path/with/trailing/space /cc -c -o GPTLget_memusage.o -DSPEC -DSPEC_CPU -DNDEBU
$  (Notes about examples)
Notice that the PATH2 trailing space is preserved
If you use double (") or single (') quotes within a config file, runcpu leaves them alone. The assumption is that you put them there because one of the consumers (such as a shell) needs them. The quotes are not significant to runcpu but may be highly significant to the consumer. See the section on quote traps.
If you use a backslash (\) it is usually not significant. The exceptions are:
Many fields, including most reader fields, can be continued by adding a number:
sw_os1         = Turboblaster OS V1.0
sw_os2         = (Tested with Early Hardware Release 0.99
sw_os3         = and Patch 42.)
hw_disk105     = 42 TB on 6x 8 TB 10K RPM SAS Disks
hw_disk110     = arranged as 4x 2-way mirrors; plus
hw_disk115     = Turboblaster Disk Accelerator
The fields which cannot be continued are the ones that are expecting a simple integer, such as hw_nchips and license_num; and the ones that expect a date, such as hw_avail. You can pick your own style of numbering, as in the examples above. (Note: the stored results from your test always use three-digit numbers, and have slightly different syntax, as discussed in utility.html.)
Shell-style "here documents" with double angle brackets and a delimiter word (e.g. <<EOT) can be used to set multi-line values. Backslash-continued lines are also supported. For example:
$ cat continued_lines.cfg
expand_notes   = 1
output_format  = text
output_root    = /tmp/fake_lines
runlist        = 519.lbm_r

here_continued = <<EOT
      + This is +
       + a test  +
EOT

backslash_continued = + So is +\
 + this  +

notes1 = ${here_continued}
notes2 = ${backslash_continued}
$ cat continued_lines.sh
runcpu --config=continued_lines --fakereport | grep txt
grep '+' /tmp/fake_lines/result/CPU2017*txt
$ ./continued_lines.sh
    format: Text -> /tmp/fake_lines/result/CPU2017.001.fprate.refrate.txt
           + This is +
           + a test  +
     + So is +
     + this  +
$   (Notes about examples)
You can include other files in your config file using include:
Multiple files may be included.
Included files may use macros (and you can use configpp to check the effect).
Included files may write to arbitrary sections, including
(effectively) the header section.
Example: a config file is developed on one system, and applied on a different System Under Test (SUT). The compilers are, of course, installed on the development system. They might not be present on the SUT.
|
The compiler is described in the main config file on lines 10-12.
$ cat -n include.cfg
 1  iterations    = 1
 2  output_format = text
 3  output_root   = /tmp/example
 4  runlist       = 519.lbm_r
 5  size          = test
 6  include: SUT.inc
 7  default:
 8    CC                = gcc
 9    CC_VERSION_OPTION = -V
10    sw_compiler001    = C/C++/Fortran: Version 6.2.0 of GCC
11    sw_compiler002    = the GNU Compiler Collection
12    sw_avail          = Aug-2016
$
Note the software date (sw_avail) on line 12 above.
$ cp Turboblaster.inc SUT.inc
$ cat Turboblaster.inc
default:
   hw_model  = SuperHero IV
   hw_avail  = Feb-2018
   hw_vendor = Turboblaster
$
Note the hardware date (hw_avail) in the include file.
$ cat include.sh runcpu --config=include | grep txt grep avail /tmp/example/result/*txt $ ./include.sh format: Text -> /tmp/example/result/CPU2017.001.fprate.test.txt Test sponsor: Turboblaster Hardware availability: Feb-2018 Tested by: Turboblaster Software availability: Aug-2016 $ (Notes about examples) |
Notes on the Examples Many of the examples that begin with cat somefile are on your installed copy of SPEC CPU 2017, in directory $SPEC/config/tiny-examples or %SPEC%\config\tiny-examples. cat example.cfg Display config file. Windows users can use type. cat example.sh For config files with many lines of output, a corresponding .sh script file has commands to pick out a subset. Windows users could create a .bat file with call runcpu. cat -n Add line numbers. CC_VERSION_OPTION How to say to the compiler "Please tell me your version". A required option for all except fake runs. (detail) cp Copy a file. Windows users could say copy. cut, head, tail Various ways to subset output. default=base: A section marker --fake Many examples use --fake or --fakereportable, to quickly provide a dry run demonstration. You can try fake examples without even installing a compiler. iterations=1 Demonstrate using just one repetition. Warning: Reportable runs use at least 2. grep Search the output. Windows users could try findstr ls List files. Windows users could say dir. output_root Send results to named directory. runlist Often, 519.lbm_r is demonstrated because it compiles quickly. size=test For demonstration purposes, use the very short workload. Warning: The intent of 'test' is just a sanity check that a binary works. It is not a comparable metric. If you publish results, you must use the 'ref' workloads. For other fields, see table of contents. Most examples were tested with a SPEC CPU 2017 release candidate and this document contains their actual output, except: white space was liberally edited and (in a very few cases) line width was reduced by chopping out words. |
A named section begins with a section marker and continues until the next section marker or the HASH section is
reached.
Named sections can be entered in any order.
Section markers can be repeated. Material from repeated sections is automatically consolidated.
A section marker is a one- to three-part string of the form:
benchmark[,...]=tuning[,...]=label[,...]:
The three parts of a section marker are called the section specifiers, with allowed values:
| Section specifier | Allowed values |
|---|---|
| benchmark | default
A metric: intrate, intspeed, fprate, or fpspeed Any individual benchmark, such as 503.bwaves_r A list, such as: 503.bwaves_r,603.bwaves_s |
| tuning | default
base peak A list of tuning levels: base,peak |
| label | default
Any specific label: an arbitrary tag to identify binaries and directories A list of labels, separated by commas |
Trailing default section specifiers may be omitted from a section marker. In the pairs below, in each case, the second line is equivalent to the first:
intrate=default=default:     628.pop2_s=base=default:      default=default=default:
intrate:                     628.pop2_s=base:              default:
By constructing section markers, you determine how you would like your options applied. Benchmarks are built according
to instructions in the sections that they match, subject to rules for combining sections and resolving conflicts among them.
Sections are combined using these rules.
Click to go to an example.
For the benchmark specifier, the precedence is:
highest   named benchmark(s)
          suite name
lowest    default
(See also Appendix A)
For the tuning specifier, base
or peak has higher precedence than default. For the label specifier, any named label
is at a higher precedence level than default. Combine sections that apply to a benchmark, if there is no
conflict among them. If sections conflict with each other, the
order of precedence is:
highest     benchmark
            tuning
lowest      label
For sections at differing precedence
levels, order does not matter.
If a section occurs more than once, the
settings are combined. If there are conflicts, the last instance wins.
| Precedence Example 1: benchmark specifiers | |
|
For the benchmark specifier, the precedence is:
  highest   named benchmark(s)
            suite name
  lowest    default
The flagsurl line picks up definitions that are provided with SPEC CPU 2017. 519.lbm_r is an fprate benchmark, but it does not use the setting on lines 14-15. Instead, it uses the higher precedence lines 10-11 (named benchmark). 619.lbm_s is an fpspeed benchmark. The highest precedence section for it is on lines 12-13. 505.mcf_r is an intrate benchmark. It gets the low-precedence OPTIMIZE setting from lines 16-17. |
$ cat -n precedence_example1.cfg
     1  flagsurl             = $[top]/config/flags/gcc.xml
     2  iterations           = 1
     3  output_format        = text
     4  output_root          = /tmp/ptest
     5  runlist              = 519.lbm_r,619.lbm_s,505.mcf_r
     6  size                 = test
     7  default:
     8     CC_VERSION_OPTION = -v
     9     CC                = gcc
    10  519.lbm_r:
    11     OPTIMIZE          = -O3
    12  fpspeed:
    13     OPTIMIZE          = -O2
    14  fprate:
    15     OPTIMIZE          = -O1
    16  default:
    17     OPTIMIZE          = -O0
$ cat -n precedence_example1.sh
     1  runcpu --config=precedence_example1 | grep txt
     2  cd /tmp/ptest/result
     3  grep 'O[0-9]' *txt
$ ./precedence_example1.sh
    format: Text -> /tmp/ptest/result/CPU2017.001.fprate.test.txt
    format: Text -> /tmp/ptest/result/CPU2017.001.fpspeed.test.txt
    format: Text -> /tmp/ptest/result/CPU2017.001.intrate.test.txt
CPU2017.001.fprate.test.txt: 519.lbm_r: -O3
CPU2017.001.fpspeed.test.txt: 619.lbm_s: -O2
CPU2017.001.intrate.test.txt: 505.mcf_r: -O0
$ (Notes about examples)
|
| Precedence Example 2: tuning specifiers | |
|
For the tuning specifier, base or peak has higher precedence than default. The first few lines of the config file use similar features as the previous example. The tuning from line 12 is used for base, and line 14 for peak. |
$ cat -n precedence_example2.cfg
     1  flagsurl             = $[top]/config/flags/gcc.xml
     2  iterations           = 1
     3  output_format        = text
     4  output_root          = /tmp/ptest2
     5  runlist              = 519.lbm_r
     6  size                 = test
     7  default=default:
     8     CC_VERSION_OPTION = -v
     9     CC                = gcc
    10     OPTIMIZE          = -O0
    11  default=base:
    12     OPTIMIZE          = -O1
    13  default=peak:
    14     OPTIMIZE          = -O3
$ cat precedence_example2.sh
runcpu --config=precedence_example2 --tune=base | grep txt
runcpu --config=precedence_example2 --tune=peak | grep txt
cd /tmp/ptest2/result
grep 'O[0-9]' *txt
$ ./precedence_example2.sh
    format: Text -> /tmp/ptest2/result/CPU2017.001.fprate.test.txt
    format: Text -> /tmp/ptest2/result/CPU2017.002.fprate.test.txt
CPU2017.001.fprate.test.txt: 519.lbm_r: -O1
CPU2017.002.fprate.test.txt: 519.lbm_r: -O3
$  (Notes about examples)
|
| Precedence Example 3: label specifiers | |
|
For the label specifier, any named label has higher precedence than the default. This config file is simpler than the previous examples, because we don't even bother to run it; instead, --fake is used. The runcpu command uses --label=OhTwo. Therefore, the default setting for OPTIMIZE on line 6 is over-ridden by the settings on lines 7-8. |
$ cat -n precedence_example3.cfg 1 runlist = 619.lbm_s 2 size = test 3 fpspeed=base=default: 4 CC_VERSION_OPTION = -v 5 CC = gcc 6 OPTIMIZE = -O0 7 fpspeed=base=OhTwo: 8 OPTIMIZE = -O2 $ cat precedence_example3.sh runcpu --config=precedence_example3 --fake --label=OhTwo | grep lbm.c $ ./precedence_example3.sh gcc -c -o lbm.o -DSPEC -DSPEC_CPU -DNDEBUG -DLARGE_WORKLOAD -O2 lbm.c $ (Notes about examples) |
| Precedence Example 4: Combining sections | |
|
Combine sections that apply to a benchmark, if there is no conflict among them. Note that line 1 sets the label, and line 3 sets the tuning. All sections -- including lines 6, 8, 10, and 12 -- contribute to the compile command, which has been wrapped for readability. |
$ cat -n precedence_example4.cfg
  1  label                = wall
  2  runlist              = 619.lbm_s
  3  tune                 = peak
  4  default:
  5     CC_VERSION_OPTION = -v
  6     CC                = gcc
  7  fpspeed:
  8     OPTIMIZE          = -O1
  9  default=peak:
 10     COPTIMIZE         = -ftree-vectorize
 11  default=default=wall:
 12     EXTRA_COPTIMIZE   = -Wall
$ cat precedence_example4.sh
runcpu --config=precedence_example4 --fake | grep lbm.c
$ ./precedence_example4.sh
gcc -c -o lbm.o -DSPEC -DSPEC_CPU -DNDEBUG -DLARGE_WORKLOAD
     -O1 -ftree-vectorize           -Wall     lbm.c
$  (Notes about examples)
|
| Precedence Example 5: Conflicting sections | |
|
If sections conflict with each other, the order of precedence is:
highest     benchmark
            tuning
lowest      label
The first runcpu command includes --label=wall. It uses the OPTIMIZE setting from lines 13-14, which have higher precedence than the default (lines 15-16). The second runcpu command includes both --label=wall and --tune peak. The OPTIMIZE setting from lines 11-12 is used. The third also uses --label=wall --tune peak; and runs 619.lbm_s, which is an fpspeed benchmark. The OPTIMIZE setting from lines 9-10 is used. |
$ cat -n precedence_example5.cfg 1 flagsurl = $[top]/config/flags/gcc.xml 2 iterations = 1 3 output_format = text 4 output_root = /tmp/ptest 5 size = test 6 default: 7 CC_VERSION_OPTION = -v 8 CC = gcc 9 fpspeed: 10 OPTIMIZE = -O3 11 default=peak: 12 OPTIMIZE = -O2 13 default=default=wall: 14 OPTIMIZE = -O1 15 default: 16 OPTIMIZE = -O0 $ cat precedence_example5.sh runcpu --fake --config=precedence_example5 --label=wall 519.lbm | grep lbm.c runcpu --fake --config=precedence_example5 --label=wall -T peak 519.lbm | grep lbm.c runcpu --fake --config=precedence_example5 --label=wall -T peak 619.lbm | grep lbm.c $ ./precedence_example5.sh gcc -c -o lbm.o -DSPEC -DSPEC_CPU -DNDEBUG -DSPEC_AUTO_SUPPRESS_OPENMP -O1 lbm.c gcc -c -o lbm.o -DSPEC -DSPEC_CPU -DNDEBUG -DSPEC_AUTO_SUPPRESS_OPENMP -O2 lbm.c gcc -c -o lbm.o -DSPEC -DSPEC_CPU -DNDEBUG -DLARGE_WORKLOAD -O3 lbm.c $ (Notes about examples) |
| Precedence Example 6: Section order |
For sections at differing precedence levels, order does not matter. These two config files use a different order but perform the same functions when runcpu applies them.. $ diff --side-by-side precedence_example6a.cfg precedence_example6b.cfg
iterations = 1 iterations = 1
output_format = text output_format = text
output_root = /tmp/ptest output_root = /tmp/ptest
runlist = 519.lbm_r runlist = 519.lbm_r
size = test size = test
default: default:
CC_VERSION_OPTION = -v CC_VERSION_OPTION = -v
CC = gcc CC = gcc
519.lbm_r: <
OPTIMIZE = -O3 <
fprate: <
OPTIMIZE = -O1 <
default: default:
OPTIMIZE = -O0 OPTIMIZE = -O0
> fprate:
> OPTIMIZE = -O1
> 519.lbm_r:
> OPTIMIZE = -O3
$ cat precedence_example6.sh
runcpu --fake --config=precedence_example6a | grep lbm.c
runcpu --fake --config=precedence_example6b | grep lbm.c
$ chmod +x precedence_example6.sh
$ ./precedence_example6.sh
gcc -c -o lbm.o -DSPEC -DSPEC_CPU -DNDEBUG -DSPEC_AUTO_SUPPRESS_OPENMP -O3 lbm.c
gcc -c -o lbm.o -DSPEC -DSPEC_CPU -DNDEBUG -DSPEC_AUTO_SUPPRESS_OPENMP -O3 lbm.c
$ (Notes about examples)
|
| Precedence Example 7: Repeated Sections | |
|
If a section occurs more than once, the settings are combined. If there are conflicts, the last instance wins. Recall that trailing default specifiers can be dropped. Therefore, these three section markers: 7 fpspeed: 12 fpspeed=default: 17 fpspeed=default=default: actually name the same section, which is entered three times. The EXTRA_CFLAGS, COPTIMIZE, and EXTRA_COPTIMIZE settings (lines 9, 14, 19) are combined. The OPTIMIZE settings on lines 8, 13, and 18 conflict with each other. Only the last one is retained. |
$ cat -n precedence_example7.cfg
  1  label                = wall
  2  runlist              = 619.lbm_s
  3  tune                 = peak
  4  default:
  5     CC_VERSION_OPTION = -v
  6     CC                = gcc
  7  fpspeed:
  8     OPTIMIZE          = -O1
  9     EXTRA_CFLAGS      = -finline-functions
 10  intrate:
 11     OPTIMIZE          = -O0
 12  fpspeed=default:
 13     OPTIMIZE          = -O2
 14     COPTIMIZE         = -ftree-vectorize
 15  intrate=peak:
 16     OPTIMIZE          = -O0
 17  fpspeed=default=default:
 18     OPTIMIZE          = -O3
 19     EXTRA_COPTIMIZE   = -Wall
$ cat precedence_example7.sh
runcpu --config=precedence_example7 --fake | grep lbm.c
$ ./precedence_example7.sh
gcc -c -o lbm.o -DSPEC -DSPEC_CPU -DNDEBUG -DLARGE_WORKLOAD
    -O3 -ftree-vectorize  -finline-functions  -Wall   lbm.c
$  (Notes about examples)
|
|
You can do variable substitution within a config file.
|
q. Wait a minute... all these choices for substitution? Which do I want? a. Probably either the first in the list: specmake; or the last: the preprocessor. |
| Format | Example | Description + consumer | Traps for the unwary |
| $(round) | $(COMPILER_DIR) | Make variables, interpreted by specmake | |
|---|---|---|---|
| \$SHELLVAR | \$SPEC | Shell or command interpreter variables. | Quoting |
| $[square] | $[top]/config | Unchanging items, substituted by runcpu at startup. | Timing |
| ${curly}
$unbracketed |
${hw_avail}ish
$hw_avail |
Changeable items subject to perl interpolation.
$unbracketed is allowed if it is not ambiguous. |
Try not to confuse with %{curly} |
| %{ENV_var} | %{ENV_LIBRARY_PATH} | Predefined macros for environment variables, handled by the preprocessor. | |
| %{curly} | %{bits} | macros, handled by the preprocessor | Try not to confuse with ${curly} |
You can create your own runcpu variables using a line of the form
name = value
The name may contain only letters, digits, and underscores (a hyphen is NOT allowed).
Start with a letter.
You may indent your definitions if you wish (see: whitespace)
Exception: preprocessor macros are different on all of the above. Hyphens are allowed, use
%define name value
and the % must appear in column 1. You can indent after the % if you wish.
Conventions: Although not required, certain conventions are usually followed:
Examples of the above (in the same order)
%ifndef processorNumaControl
%   define processorNumaControl firstTouch # macro
%endif
default:
    my_submit_cmd       = numactl -C $BIND # runcpu variable
    MYTUNE              = -O2 --math=SIMD  # make variable
    ENV_LD_LIBRARY_PATH = /opt/lib         # environment variable
The remainder of this section I.F is about runcpu variables -- the $[square] and ${curly} rows from the table at the top.
Immediately after preprocessing, variables that are delimited by $[square
brackets] are substituted.
Any value set in the config file can be substituted, provided that is visible in the
current scope.
You can access the value of additional variables that you may have created.
See the list of useful variables below.
Perhaps the most useful is $[top] for the top of the SPEC CPU 2017 tree,
often found in contexts such as:
    flagsurl01          = $[top]/config/compiler.xml
    flagsurl02          = $[top]/config/platform.xml
    EXTRA_LIBS          = $[top]/mylibs
    preENV_LIBRARY_PATH = $[top]/lib64:$[top]/lib
Traps for the unwary: In some cases it may be obvious to the human which value to use, but the tools aren't as smart as you.
output_root:
You cannot set an output_root that depends on a runcpu variable.
You can set one that uses a macro:
output_root=$[top]/my/path      # wrong
output_root=${top}/my/path      # wrong
output_root=%{ENV_SPEC}/my/path # right
Square substitution is done early. That comes in handy if you need a variable right away, for example, in order to use it with preENV.
$ cat EarlySub.cfg
SW_DIR                 = /opt/path/to/compilers
preENV                 = 1
preENV_LD_LIBRARY_PATH = $[SW_DIR]/lib

$ cat EarlySub.sh
runcpu --config=EarlySub --fake 519.lbm_r | grep '^LD' | uniq
$ ./EarlySub.sh
LD_LIBRARY_PATH=/opt/path/to/compilers/lib
$  (Notes about examples)
The example below uses variables defined in several named sections. The sections are delimited by section markers default: (line 8), default=base: (line 11), and default=peak: (line 15).
$ cat -n square.cfg
     1  expand_notes         = 1
     2  iterations           = 1
     3  output_format        = text
     4  output_root          = /tmp/square
     5  runlist              = 519.lbm_r
     6  size                 = test
     7  tune                 = base,peak
     8  default:
     9     CC                = gcc
    10     CC_VERSION_OPTION = -v
    11  default=base:
    12     the_system        = STAR
    13     OPTIMIZE          = -O1
    14     notes_base_100    = base tuning uses '$[CC]' '$[OPTIMIZE]' on system '$[the_system]'
    15  default=peak:
    16     OPTIMIZE          = -O2
    17     notes_peak_100    = peak tuning uses '$[CC]' '$[OPTIMIZE]' on system '$[the_system]'
    18
$ cat square.sh
runcpu --config=square | grep txt
grep tuning /tmp/square/result/CPU2017.001.fprate.test.txt
$ ./square.sh
    format: Text -> /tmp/square/result/CPU2017.001.fprate.test.txt
     base tuning uses 'gcc' '-O1' on system 'STAR'
     peak tuning uses 'gcc' '-O2' on system ''
$  (Notes about examples)
Note that line 14 finds all three variables that it is looking for, but line 17 does not. If it is not clear why this happens, please see the descriptions of named sections and precedence above.
Useful $[variables] include:
| $[configfile] | Your config file name |
|---|---|
| $[configpath] | The full path to your config file |
| $[dirprot] | protection that is applied to directories created by runcpu |
| $[endian] | 4321 or 87654321 for big endian; 1234 or 12345678 for little |
| $[flag_url_base] | directory where flags files are looked up |
| $[OS] | unix or windows |
| $[os_exe_ext] | exe for windows, nil elsewhere |
| $[realuser] | the user name according to the OS |
| $[top] | the top directory of your installed SPEC CPU 2017 tree |
| $[username] | the username for purposes of tagging run directories |
| $[uid] | the numeric user id |
You can access the initial value of most options that you can enter into a config file, including:
| During a run, variables that are delimited by ${curly brackets} are substituted: | ${command} |
| Usually, variables can be spelled with or without the curlies: | $command or ${command} |
| Exception 1: curlies are required if the variable is adjacent to other text | ${command}s |
| Exception 2: curlies are not allowed for: | $BIND and $SPECCOPYNUM |
Runcpu uses perl interpolation.
Only scalars (not: perl arrays and hashes) can be interpolated.
Example: on the notes100 line, you could optionally add say either ${lognum} or $lognum, but don't try taking the curly brackets away from ${size}.
$ cat just.cfg
expand_notes      = 1
notes100          = Just ${size}ing, in run $lognum
output_root       = /tmp/just
runlist           = 505.mcf_r
size              = test
CC                = gcc
CC_VERSION_OPTION = -v
$
$ cat just.sh
runcpu -c just | grep txt
grep Just /tmp/just/result/CPU2017.001.intrate.test.txt
$
$ ./just.sh
    format: Text -> /tmp/just/result/CPU2017.001.intrate.test.txt
     Just testing, in run 001
$  (Notes about examples)
Traps for the unwary
Timing: Some variables are only defined at certain times, and a line that uses it might be interpolated at a different time. Therefore interpolation won't always do what you might wish. In particular, notes are not expanded in the context of a particular benchmark run, and therefore variables such as ${tune} are not useful within them.
output_root:
You cannot set an output_root that depends on a runcpu variable.
You can set one that uses a macro:
output_root=$[top]/my/path      # wrong
output_root=${top}/my/path      # wrong
output_root=%{ENV_SPEC}/my/path # right
These variables may be of interest:
| ${baseexe} | The first part of the executable name, which is <baseexe>_<tune>.<label>. For example, in "lbm_r_base.foo", baseexe is "lbm_r". |
|---|---|
| ${benchmark} | The number and name of the benchmark currently being run, for example 519.lbm_r |
| ${benchname} | The name of the benchmark currently being run, for example lbm_r |
| ${benchnum} | The number of the benchmark currently being run, for example 519 |
| ${benchtop} | The top directory for the benchmark currently being run, for example /spec/cpu2017/benchspec/CPU/519.lbm_r |
| $BIND | A value from your bind list, typically a numeric identifier for a processor on your system. This variable is actually interpreted by specinvoke, and cannot be spelled with braces. Say $BIND, do not say ${BIND}. |
| ${command} | The shell command line to run the current benchmark, for example ../run_base_test_sticky.0000/lbm_r_base.sticky 20 reference.dat 0 1 100_100_130_cf_a.of |
| ${commandexe} | The executable for the current command, for example ../run_base_test_none.0000/lbm_r_base.sticky |
| ${label} | The label for the benchmark being run |
| ${iter} | The current iteration number |
| ${logname} | The complete log file name, for example /spec/cpu2017/result/CPU2017.168.log |
| ${lognum} | The log file number, for example 168 |
| $SPECCOPYNUM | The current copy number, when running a SPECrate run. This variable is actually interpreted by specinvoke, and cannot be spelled with braces. Say $SPECCOPYNUM, do not say ${SPECCOPYNUM}. The first copy is 0 (zero). |
| SPECUSERNUM | Do not use. This is the older, obsolete, CPU 2000 spelling for what is now called SPECCOPYNUM. If you use it, it will be silently ignored - no warning is printed. |
| ${tune} | The tuning for the benchmark being run (base or peak) |
| ${workload} | The current workload number (within the iteration) |
For a complete list of the available variables relative to the current config file, set
expand_notes = 1
verbose      = 35 # or higher
Then, do a run that causes a command substitution to happen.
In the log, you will find many lines of the
form:
 - Variables available for interpolation that have changed since the last list:
    (From config) $runmode = "rate"
    (From config) $size = "test"
 - Variables available for interpolation that have changed since the last list:
    (From config) $size = "train"
It is sometimes useful to undo the setting of a variable that would otherwise be included from another section. This can be accomplished using the special value %undef%. In the example, line 14 undefines COPTIMIZE when compiling peak:
 $ cat -n gnana.cfg
 1  flagsurl             = $[top]/config/flags/gcc.xml
 2  iterations           = 1
 3  output_format        = text
 4  output_root          = /tmp/undef
 5  runlist              = 519.lbm_r
 6  size                 = test
 7  tune                 = base,peak
 8  default:
 9     CC_VERSION_OPTION = -v
10     CC                = gcc
11     OPTIMIZE          = -O2
12     COPTIMIZE         = -fno-tree-pre
13  519.lbm_r=peak:
14     COPTIMIZE         = %undef%
15
$ runcpu --config=gnana | grep txt
    format: Text -> /tmp/undef/result/CPU2017.001.fprate.test.txt
$ cd /tmp/undef/benchspec/CPU/519.lbm_r/build
$ grep OPTIMIZE build_base_none.0000/Makefile.spec
COPTIMIZE        = -fno-tree-pre
OPTIMIZE         = -O2
$ grep OPTIMIZE build_peak_none.0000/Makefile.spec
COPTIMIZE        =
OPTIMIZE         = -O2
$ (Notes about examples)
Notice that in the build directory, COPTIMIZE is present for base and absent for peak.
When debugging a config file that uses runcpu variables, try:
iterations       = 1
minimize_rundirs = 0
reportable       = 0
runlist          = (one or two benchmarks)
size             = test
verbose          = 40
Using --fake will probably be informative. Look inside the log for the (case-sensitive) word 'From'.
This section documents options that control the operation of runcpu itself.
In the list that follows, some items are linked to the document Using SPEC CPU 2017 - the 'runcpu' Command because they can be specified either in a config file, or on the runcpu command line.
New with CPU 2017, If an option is specified in both places, the command line wins.
In the table that follows, if an option is documented as accepting the values "no" and "yes", these may also be specified as "false" and "true", or as "0" and "1".
The "Use In" column indicates where the option can be used:
| H | use only in header section |
| N | use in a named section. |
| H,N | can be used in both the header section and in named sections. The item can therefore be applied on a global basis, and/or can be applied to individual benchmarks. |
| Option | Use In | Default | Meaning |
| action | H | validate | What to do. The available actions are defined in the runcpu
document. See also the buildsetup example in the section on specmake. |
| allow_label_override | H | no | The runcpu command can use --label to select sections that apply to a specific label. If the label mentioned on the runcpu command does not occur in any section marker:
|
| backup_config | H | yes | When updating the hashes in the config file, make a backup copy first. Highly recommended to defend against full-file-system errors, system crashes, or other unfortunate events. |
| Option | Use In | Default | Meaning |
| basepeak | H,N | no | Roughly: Report base results for peak. The more precise meaning depends on context: Config file header section:
Any other config file section:
The rawformat option --basepeak : Copy base results to peak. Sample usage scenarios: Problem: Ryan wants to leave early today. At noon, his manager tells him that he can go home after he produces reportable base and peak metrics for a system. Similar systems need about 6 hours to run 3x base and 3x peak iterations. Although Ryan borders on screaming, he quietly agrees to the task. Solution:
Warning: this works only if the basepeak option is placed in the header section. Put it anywhere else, spend more time indoors. Problem: Ryan has developed peak tuning for all but one benchmark, where the base tuning is "good enough, but noisy" -- it is subject to +/- 2% run-to-run variation, and he is tired of answering questions about it. Solution: Ryan sets 997.noisy=peak: basepeak=yes Identical results are reported for both base and peak and no questions are asked about 997.noisy. Problem: Ryan did a big reportable run and notices afterwards that base was actually better than
peak.
|
| Option | Use In | Default | Meaning |
| bind without trailing digits |
H,N | '' |
List of values to substitute for $BIND in a submit command. This can be a simple comma (or white-space) separated list, such as: bind = 0,1,2,3,4,5,6,7, 16,17,18,19,20,21,22,23 If your line is too long, don't try to continue it by adding a numeral to 'bind'; that has a different meaning, as described in the next section. Instead, you can continue it either by putting a backslash at the end of lines, or by using a here document. The above single line could equally well be expressed as: bind = <<EOT 0, 1, 2, 3, 4, 5, 6, 7, 16, 17, 18, 19, 20, 21, 22, 23 EOT The trailing comma after the "7" is both optional and harmless. It can be present or not, as you wish; in either case, the sequence of values for this example will include ...5, 6, 7, 16, 17, 18... |
| bindn (n= digits) |
H,N | '' |
List of strings to substitute for $BIND in a submit command.
Put each string on a new line, increasing the index n. Like notes, the values of the
indices are not important and are used for ordering only. If there are more copies than bind values, they will be
re-used in a circular fashion. If there are more bind values specified than copies, then only as many as needed will
be used.
$ cat bindN.cfg
copies      = 4
iterations  = 1
output_root = /tmp/submit
runlist     = 541.leela_r
size        = test
intrate:
   bind0    = assign_job cpu_id=11
   bind1    = assign_job cpu_id=13
   bind2    = assign_job cpu_id=17
   bind3    = assign_job cpu_id=19
   submit   = $BIND ${command}
$ runcpu --fake --config=bindN | grep '^assign' | cut -b 1-70
assign_job cpu_id=11 ../run_base_test_none.0000/leela_r_base.none test
assign_job cpu_id=13 ../run_base_test_none.0000/leela_r_base.none test
assign_job cpu_id=17 ../run_base_test_none.0000/leela_r_base.none test
assign_job cpu_id=19 ../run_base_test_none.0000/leela_r_base.none test
$(Notes about examples)
|
|---|
| Option | Use In | Default | Meaning | ||||||||
| check_version | H | no (yes for reportable runs) |
When set, before doing a reportable run, runcpu will download information about available updates from www.spec.org. In this way, you can be notified if the version of the suite that you're using is out-of-date. Setting this variable to no will disable this check. If you would like to check your version for a NON-reportable run, you will need to add --check_version to your command line. Setting check_version=yes in the config file only causes the check for reportable runs. |
||||||||
| command_add_redirect | H | no | If set, the generated ${command} will include redirection operators (stdout, stderr), which are passed along to the shell that executes the command. If this variable is not set, specinvoke does the redirection. This option is commonly used with fdo_run or submit. See Tip #3 under FDO Example 5. When used with submit, the command_add_redirect feature lets you choose whether
redirection operators (such as <this_benchmark.in or >that_benchmark.out) are
applied to your entire modified submit command (the default) or just to the portion that has ${command}.
The above is only pseudo-code; see the section on Using Submit for real examples. |
||||||||
| Option | Use In | Default | Meaning |
| copies | H,N | 1 | Number of copies. For base, the number of copies must be the same for all benchmarks, but for peak it is allowed to vary: for example, you could decide to run 64 copies of all benchmarks except 519.lbm_r, which would run only 63. Note: If you select basepeak=yes for a SPECrate benchmark, the number of copies in peak will be forced to be the same as in base. |
| current_range | H,N | none | Set the maximum current in amps that is expected to be used during the run. If you are unsure how to determine this, see the suggestions in the section on Power Measurement. The current_range can be used to control the settings across all benchmarks by putting it in the header section, or on a per benchmark level by putting it in a named section. The run rules allow setting the current range to different values for each benchmark, even in base. For example, the following is allowed. Notice that the integer rate benchmark 557.xz_r uses a different current_range than the other integer rate benchmarks. intrate=base: current_range = 3 557.xz_r=base: current_range = 4 intrate=peak: current_range = 5 557.xz_r=peak: current_range = 6 Auto-ranging: You may specify auto-ranging with the word "auto". Warning: auto-ranging is allowed only if it is not possible to set a specific range, and must be justified. If you plan to use your results in public, preserve rawfiles that demonstrate the failure. See the discussion at runrules.html#autoranging. See also the discussion of current ranges in the section on Power Measurement. |
| delay | H,N | 0 | Insert a delay of the specified number of seconds before and after benchmark execution. This delay does not contribute to the measured runtime of the benchmark. This delay is also not available in a reportable run. |
| deletework | H,N | no | If set to yes, always delete existing benchmark working directories. An extra-careful person might want to set this to ensure no unwanted leftovers from previous benchmark runs, but the tools are already trying to enforce that property. |
| difflines | H,N | 10 | Number of lines of differences to print when comparing results. |
| enable_monitor | H,N | yes | If this variable is set to no, then all of the monitoring hooks are disabled. This can be overridden by setting force_monitor. force_monitor is new with CPU 2017 |
| Option | Use In | Default | Meaning |
| env_vars or envvars |
H,N | no | If set to yes, environment settings can be changed using ENV_* options in the config file. Note that you cannot change OMP_NUM_THREADS using this feature. Use threads. |
|
Example: Consider the config file below, which creates a binary with the requested label: $ cat PerformabilityQOS.cfg runlist = 520.omnetpp_r iterations = 1 size = test tune = peak label = srini 520.omnetpp_r=peak: CXX = g++ CXX_VERSION_OPTION = -v OPTIMIZE = -O1 $ date Mon Oct 3 17:49:46 PDT 2016 $ runcpu -c PerformabilityQOS | grep -i -e error: -e success Build successes for intrate: 520.omnetpp_r(peak) Success: 1x520.omnetpp_r $ go 520.omnet exe /export/home/rc2/benchspec/CPU/520.omnetpp_r/exe $ ls -g | cut -b 27-88 Oct 3 17:52 omnetpp_r_peak.srini $(Notes about examples) The binary just above depends on certain libraries. What if they aren't available, or have been moved? $ ldd omnetpp_r_peak.srini ... version `GLIBCXX_3.4.20' not found (required by ./omnetpp_r_peak.srini) ... version `CXXABI_1.3.8' not found (required by ./omnetpp_r_peak.srini) In the config directory, a second copy of the config file has been created, with the addition of env_vars and a line that inserts a new directory into the front of the library path. As shown below, this fixes the problem.
$ diff -u PerformabilityQOS.cfg PerformabilityQOS.2.cfg
--- PerformabilityQOS.cfg	2016-10-03 17:52:39.000000000 -0700
+++ PerformabilityQOS.2.cfg	2016-10-03 17:54:45.000000000 -0700
@@ -3,8 +3,10 @@
 size        = test
 tune        = peak
 label       = srini
+env_vars    = 1
 #
 520.omnetpp_r=peak:
+   ENV_LD_LIBRARY_PATH = %{ENV_SPEC}/libraries:%{ENV_LD_LIBRARY_PATH}
    CXX                 = g++
    CXX_VERSION_OPTION  = -v
    OPTIMIZE            = -O1
$ runcpu -c PerformabilityQOS | grep -i -e error: -e success
error: a total of 1 children finished with errors
$ runcpu -c PerformabilityQOS.2 | grep -i -e error: -e success
Success: 1x520.omnetpp_r
$
Notice above that the original fails, and the modifed version with env_vars succeeds. Other notes:
|
|||
| Option | Use In | Default | Meaning |
| expand_notes | H | no | If set, will expand variables in notes. This capability is limited because notes are NOT processed by specmake, so you cannot do repeated substitutions. |
| expid | H | If set to a non-empty value, will cause executables, run directories, results, and log files to be put in a subdirectory (with the same name as the value set) in their normal directories. For example, setting expid = CDS will cause benchmark binaries to end up in exe/CDS, run directories to end up in run/CDS, and results and logs in $SPEC/result/CDS. | |
| fail | H,N | no | If set, will cause a build or run to fail. |
| fail_build | H,N | 0 | If set, will cause a build to fail. For example, you could say something like this: 519.lbm_r=default: #> I am posting this config file for use by others in the #> company, but am forcing it to fail here because #> I want to force users to review this section. #> #> Once you find your way here, you should test whether #> bug report 234567 has been fixed, by using the first #> line below. If it has not been fixed, then use the #> second. In either case, you'll need to remove the #> fail_build. #> #> - Pney Guvaxre #> Boomtime, the 66th day of Confusion in the YOLD 3172 # OPTIMIZE = -Osuperduper # OPTIMIZE = -Omiddling fail_build = yes In the example above, the build is forced to fail until the user examines and modifies that section of the config file. Notice that Pney has used protected comments to cause the comments about the internal bug report to disappear if the config file were to be published as part of a reportable run. |
| fail_run | H,N | no | If set, will cause a run to fail. |
| Option | Use In | Default | Meaning |
| feedback | H,N | yes | The feedback option applies an on/off switch for the use of feedback directed optimization (FDO), without specifying how the feedback will be done.
The interaction between feedback and these other options is described in the section on Using Feedback, below. |
| flagsurl | H | none | If set, retrieve the named URL or filename and use that as the "user" flags file. If the special value "noflags" is used, runcpu will not use any file and (if formatting previously run results) will remove any stored file. Automated processing of flags is explained in flag-description.html. If you want to list more than one flagsfile, the recommended method is by using numbered continuation lines, for example:
     flagsurl1 = mycompiler.xml
     flagsurl2 = myplatform.xml
Using other methods (such as backslash continuation) to specify multiple flags files may appear to work, but may result in unexpected differences between the original config file and the config file as written by output format config. Multiple flags files will typically be needed, because flags files are separated into two types, "compiler", and "platform". |
| force_monitor | H,N | no | If this variable is set to yes, then all of the monitoring hooks are enabled, regardless of settings that would otherwise turn them off. This means that every invocation of specinvoke will be subject to monitor_specrun_wrapper, and all command invocations will be subject to monitor_wrapper. This includes things that would normally not be subject to monitoring, such as FDO training runs, input generation commands, and commands used for validating benchmark output such as specdiff. force_monitor is new with CPU 2017. |
| Option | Use In | Default | Meaning |
| http_proxy | H | In some cases, such as when doing version checks and loading flag description files, runcpu will use HTTP to fetch a file. If you need to specify the URL of a proxy server, this is the variable to use. By default, no proxy is used. Note that this setting will override the value of the http_proxy environment variable. For example, one might set: http_proxy = http://webcache.tom.spokewrenchdad.com:8080 |
|
| http_timeout | H | 30 | This is the amount of time (in seconds) to wait while attempting to fetch a file via HTTP. If the connection cannot be established in this amount of time, the attempt will be aborted. |
| idle_current_range | H | none | Set the maximum current in amps to be measured by the power analyzer(s) for the idle power measurement. If you are unsure how to determine this, see the suggestions in the section on Power Measurement. New |
| ignore_errors | H | no | Ignore certain errors which would otherwise cause the run to stop. Very useful when debugging a new compiler and new set of options: with this option set, you'll find out about all the benchmarks that have problems, instead of only finding out about the first one. |
| ignore_sigint | H | no | Ignore SIGINT. If this is set, runcpu will attempt to continue running when you interrupt one of its child processes by pressing ^C (assuming that you have ^C mapped in the common way). Note that this does NOT cause runcpu itself to ignore SIGINT. |
| info_wrap_columns | H | 50 | When set to a value greater than 0, attempts to split non-notes informational lines such that they are no longer than info_wrap_columns columns wide. Lines are split on whitespace, and newly created lines are guaranteed to have at least the same indentation as the original line. If a line contains an item that is longer than info_wrap_columns, a warning is logged and the original line is left unchanged. |
| Option | Use In | Default | Meaning | ||||
| iterations | H | 3 | Number of iterations to run. Reportable runs require either:
Reportable runs must use 2 or 3 iterations. Here is how the settings for iterations and reportable affect each other:
|
||||
| keeptmp | H | no | Whether or not to keep various temporary files. If you leave keeptmp at its default setting, temporary files will be automatically deleted after a successful run. If not, temporary files may accumulate at a prodigious rate, and you should be prepared to clean them by hand. Temporary files include:
|
||||
| label | H | none | An arbitrary tag for executables, build directories, and run directories.
label=jun12.old.CC
label=jun12.new.CC
label=jun14-flagday
label=jun15-jeff.wants.yet.another.test
If a label is used as a section specifier, it can be referenced from the runcpu command line. runcpu --label=yusoff [...] ERROR: The label 'yusoff' defines no settings in the config file! The error can be disabled if you set allow_label_override=yes. |
||||
|
|||||||
| Option | Use In | Default | Meaning |
| line_width | H | 0 | Line wrap width for screen. If left at the default, 0, then lines will not be wrapped and may be arbitrarily long. |
| locking | H | yes | Try to use file locking to avoid race conditions, e.g. if more than one copy of runcpu is in use. Although performance tests are typically done with only one copy of runcpu active, it can be handy to run multiple copies if you are just testing for correctness, or if you are compiling the benchmarks. |
| log_line_width | H | 0 | Line wrap width for logfiles. If your editor complains about lines being too long when you look at logfiles, try setting this to some reasonable value, such as 80 or yes32. If left at the default, yes, then lines will not be wrapped and may be arbitrarily long. |
| log_timestamp | H | no | Whether or not to prepend time stamps to log file lines. |
| Option | Use In | Default | Meaning |
| mail_reports | H | all | The list of report types to mail. The format and possible values are the same as for output_format, with the addition of log, which will cause the
current log file to be sent. The default is for all files associated with the run to be mailed (so, this will include
what you listed as your desired output_format plus log (the log file) and rsf (the
rawfile). You can cut your email down to the bare essentials with something like this:
   mailto=fast.guy@welovebenchmarks.org
   output_format=text,mail
   mail_reports=text
If none of the requested report types were generated, no mail will be sent. |
| mailcompress | H | no | When using the 'mail' output format, turning this on will cause the various report attachments to be compressed with gzip. |
| mailmethod | H | smtp | When using the 'mail' output format, this specifies the method that should be used to send the mail. On UNIX and
UNIX-like systems, there are three choices: 'smtp' (communicate directly with an SMTP server over the network), 'sendmail'
(try invoking sendmail directly from locations where it is commonly installed), and 'qmail' (try invoking
qmail-inject from locations where it is commonly installed). On Windows systems, only 'smtp' is available.
SMTP is the recommended setting.
Using a sendmail or qmail-inject program from a non-standard location is possible only by setting the PERL_MAILER environment variable. See the Mail::Mailer documentation for details. |
| mailport | H | 25 | When using the 'mail' output format, and when the mailmethod is 'smtp', this specifies the port to use on the mail server. The default is the standard SMTP port and should not be changed. |
| mailserver | H | 127.0.0.1 | When using the 'mail' output format, and when the mailmethod is 'smtp', this specifies the IP address or hostname of the mailserver through which to send the results. |
| mailto | H | '' | The address or addresses to which results should be sent when using the 'mail' output format. If multiple addresses are specified, they should be separated by commas or whitespace. Each address should consist only of the name@domain part (i.e. no "full name" type info). The addresses are not checked for correct formatting; if a mistake is made, the results may be sent to an unknown location. Think: comp.arch. OK, probably not there, but seriously be careful about security on this one. Config files as posted at www.spec.org/cpu2017 will not include whatever you put on this line (thus, spambots will not see the contents of this field). Note that to get your reports mailed to you, you need to specify both mail as an output_format and an address to which they should be mailed. For example: mailto=fast.guy@welovebenchmarks.org output_format=text,mail If no addresses are specified, no mail will be sent. |
| Option | Use In | Default | Meaning |
| make | H,N | specmake | Name of make executable. Note that the tools will enforce use of specmake for reportable results. |
| make_no_clobber | H,N | no | Don't delete directories when building executables. The default is no, meaning "clobber". The "yes" option, meaning "avoid clobbering", should only be used for troubleshooting a problematic compile. The tools will not allow you to use this option when building binaries for a reportable result. Note that you could issue multiple successive runcpu commands with this option set (either in the config file, or with the --make_no_clobber switch), and the build directories will be preserved. But once you remove make_no_clobber (allowing it to default back to no), then the tools will attempt a normal build with a fresh build directory. |
| makeflags | H,N | '' | Extra flags for make (such as -j). Set this to -j n where n is the number of concurrent processes to run during a build. Omitting n or setting it to zero unlimits the number of jobs that will be run in parallel. Use with care! Make flags should be used here only if you are familiar with GNU make. (The program specmake is GNU Make under another name to ensure no accidental conflicts with other Make utilities you might have. The GNU Make Manual can be consulted, and you can also say specmake --help.) Note that requesting a parallel build with makeflags = -j N causes multiple processors to be used at build time. It has no effect on whether multiple processors are used at run time, and so does not affect how you report on parallelism. |
| mean_anyway | H | no | Calculate mean even if invalid. DANGER: this will write a mean to all reports even if no valid mean can be computed (e.g. half the benchmarks failed). A mean from an invalid run is not "reportable" (that is, it cannot be represented in public as the SPEC metric). |
| minimize_builddirs | H | no | Try to keep working disk size down during builds. |
| minimize_rundirs | H | no | During a run, try to keep working disk size down. Cannot be used in a reportable run. |
| nobuild | H | no | Do not attempt to build benchmarks. Useful to prevent attempts to rebuild benchmarks that cannot be built. Also comes in handy when testing whether proposed config file options would potentially force an automatic rebuild. |
| Option | Use In | Default | Meaning |
| no_input_handler | H,N | close | Method to use to simulate an empty input. Choices are:
Normally, this option should be left at the default; it was actually added to the tools for the benefit of a different SPEC suite that needed the feature. If a reportable run for CPU 2017 uses this feature, an explanation should be provided as to why it was used. |
| no_monitor | H,N | '' | Exclude the listed workloads from monitoring via the various monitor_* hooks. |
| notes_wrap_columns | H | 0 | When set to a value greater than 0, attempts to split notes lines such that they are no longer than notes_wrap_columns columns wide. Lines are split on whitespace, and newly created lines are guaranteed to have at least the same indentation as the original line. If a line contains an item that is longer than notes_wrap_columns, a warning is logged and the original line is left unchanged. |
| notes_wrap_indent | H | ' ' | When line wrapping is enabled (see notes_wrap_columns), this is the string that will be prepended to newly created lines after the indentation from the original line is applied. The default is four spaces, but it can be set to any arbitrary string. |
| Option | Use In | Default | Meaning | |||||||||||
| output_format | H | all | Format for reports. Valid options are listed at runcpu.html under --output_format; major options include txt (ASCII text), html, pdf, and ps. You might prefer to set this to txt if you're going to be doing lots of runs, and only create the pretty reports at the end of the series. See also the information in runcpu.html about --rawformat. | |||||||||||
| output_root | H |
If set to a non-empty value, all output files will be rooted under
the named directory, instead of under $SPEC (or %SPEC%).
You can navigate a rooted directory with ogo.
|
||||||||||||
| ||||||||||||||
| Option | Use In | Default | Meaning |
| parallel_test | H | #base copies |
For reportable runs, the tools verify that benchmark binaries get the correct answer for the test and train workloads. The time required for such verification does not count toward the reported score, but does add to the cost of benchmarking. To reduce that cost, you can run multiple tests simultaneously, by setting this option to anything higher than 1. For SPECrate runs, the default is the number of base copies. For SPECspeed runs, the default is 1, that is, effectively off. Note that If you turn parallel_test on for SPECspeed, the number of threads is silently forced to 1 during parallel testing. This is done in order to prevent accidental system overload. For non-reportable runs, parallel testing is disabled, unless you turn it on by setting parallel_test_workloads to one or more of "test" "train", or "ref". If the feature is enabled, and if parallel_test_submit is also set, the settings for submit and bind will be used to distribute jobs if they're set. Notes:
The above notes apply to all the parallel_test switches. |
| parallel_test_submit | H | no | Whether or not to use your submit and bind settings when doing parallel_test. When you specify parallel_test > 1, by default your submit and bind settings are not applied, because typically the operating system's default policies can be trusted to do an adequate job scheduling this (non-timed) work. Notes: See notes under parallel_test, above. |
| parallel_test_workloads | H | no | Which workload classes to run in parallel for non-reportable runs when parallel_test is enabled. The parallel_test_workloads feature is new with CPU 2017. Notes: See notes under parallel_test, above. |
| Option | Use In | Default | Meaning | ||
| plain_train | H,N | yes | When set to yes (or true or 1), does not apply any submit commands to the feedback training run. It also causes the monitor_* hooks to be ignored for the feedback training run. | ||
| power | H | no |
Enable/disable the optional power measurement mode.
New
After those fields have been set, then:
See the section on Power Measurement, below. |
||
| power_analyzer | H | none |
Network location (name and port) for the power analyzer to be used by the SPEC Power/Temperature
Daemon (PTD).
New
If you are using more than one power analyzer, separate them by commas.
The power_analyzer field tells the run time software where to find the
analyzer. You also need to tell humans about your analyzer, using descriptive fields with matching {id}
names, for example:
power_analyzer                         = hex-analyzer001:8888
hw_power_hexanalyzer0018888_cal_date   = 3-Nov-2018
hw_power_hexanalyzer0018888_connection = Serial over USB
See the section on Power Measurement, below. |
||
| preenv or pre_env |
H | yes | Use preENV_ lines in the config file. When this option is set (the default), lines of the form preENV_<variable> = <value> will cause runcpu to set the specified environment variable to value and re-exec runcpu to perform the run. The restart is done in order to ensure that the entire run takes place with the new settings. You can set preENV_SOME_VARIABLE = value only in the header section or a section using one these benchmark specifiers: default: intrate: fprate: intspeed: fpspeed: Any attempt to use preENV_ in other sections is silently
ignored.
Example: Commonly, SPECspeed2017 Floating Point users will set a large stack for 627.cam4_s. You can do this by adding a line similar to this one: preENV_OMP_STACKSIZE = 120M to the header section (top) of your config file, or by adding a new section for fpspeed: fpspeed: preENV_OMP_STACKSIZE = 120M The exact size needed will vary depending on your operating system and compiler. You might need to adjust it. See also the Examples, in your installed SPEC CPU 2017 tree, in the config directory.
|
| Option | Use In | Default | Meaning |
| rebuild | H | no | Rebuild binaries even if they exist. |
| reportable | H | yes | Strictly follow reporting rules, to the extent that it is practical to enforce them by automated means. The tester remains responsible for ensuring that the runs are rule compliant. You must set reportable to generate a valid run suitable for publication and/or submission to SPEC. Reportable runs must use 2 or 3 iterations. Here is how the settings for iterations and reportable affect each other:
|
| runlist | H | none | Benchmarks or sets to run. Names can be abbreviated, just as on the command line. See the long discussion of run order in runcpu.html. |
| save_build_files | H,N | none | After a build is finished, files matching any of the space-delimited wildcard patterns in this variable will be gathered up and saved. When a non-reportable run is being set up, those files will be unpacked into the run directory when the executable is copied in. The auxiliary file package is ignored when setting up reportable runs. The save_build_files feature is new with CPU 2017. |
| section_specifier_fatal | H | yes | While parsing the config file, if a section specifier is found that refers to an unknown benchmark or benchset, an error is output and the run stops. Set section_specifier_fatal=no in the header section of your config file to convert this error into a warning and allow the run to continue. The ability to convert section specifier errors into warnings is probably of use only for benchmark developers. |
| Option | Use In | Default | Meaning |
| setprocgroup | H | yes | Set the process group. On Unix-like systems, improves the chances that ^C gets the whole run, not just one of the children. |
| size | H | ref | Size of input set: test, train, or ref
You might choose to use runcpu --size=test while debugging a new set of compilation options. Reportable runs automatically invoke all three sizes: they ensure that your binaries can produce correct results with the test and train workloads and then run the ref workload either 2 or 3 times for the actual measurements. Caution: When requesting workloads, you should use only the terms test, train, or ref. You should stop reading here. Still reading? Sigh. OK, here are the possibilities.
|
| Option | Use In | Default | Meaning |
| src.alt | N | none | Name of a SPEC-approved alternate source.
|
About alternate sources: Sometimes a portability issue may require use of different source code for a benchmark, and SPEC may issue a src.alt, which is a compressed tar file containing modifications, created by makesrcalt. To use a src.alt, see the instructions posted with it at
www.spec.org/cpu2017/src.alt.
$ cd $SPEC   # or on Microsoft Windows: cd %SPEC%
$ specxz -dc nnn.benchmark.FixMumble.tar.xz | spectar -xvf -
$ cat README.nnn.benchmark.src.alt.FixMumble.txt
The README will explain what to add to your config file and any other instructions that are needed. After you unpack it, a directory is created under under <benchmark>/src/src.alt/ and a set of patches are stored there. You can look at the patches using dumpsrcalt, but it may be easier to just apply the src.alt and look at a build directory. Example: This config file builds with or without a src.alt, depending on the runcpu setting for the --label. $ cat testme.cfg action = buildsetup runlist = nnn.benchmark tune = base default: CC = gcc CC_VERSION_OPTION = -v nnn.benchmark=base=without: OPTIMIZE = -O2 nnn.benchmark=base=with: OPTIMIZE = -O2 srcalt = FixMumble To populate build directories: runcpu --label=without --config=testme runcpu --label=with --config=testme Then, if you visit benchspec/CPU/nnn.benchmark/build you can compare the directories. |
|||
| Option | Use In | Default | Meaning |
| strict_rundir_verify | H | yes | When set, the tools will verify that the file contents in existing run directories match the expected checksums. Normally, this should always be on, and reportable runs will force it to be on. Turning it off might make the setup phase go a little faster while you are tuning the benchmarks. Developer notes: setting strict_rundir_verify=no might be useful when prototyping a change to a workload or testing the effect of differing workloads. Note, though, that once you start changing your installed tree for such purposes it is easy to get lost; you might as well keep a pristine tree without modifications, and use a second tree that you convert_to_development. |
| sysinfo_program | H | 'specperl $[top]/bin/sysinfo' | The name of an executable program or script that automatically records information about your system configuration. It creates a record that is contemporaneous with the measurement, and which is not subject to human transcription error. New with CPU 2017: Warning: published results must use the SPEC-supplied sysinfo. If you would like to turn the feature off (perhaps during development efforts), you can use: sysinfo_program = Remember to turn it on again when you do your "real" runs. To use a different one (presumably with SPEC's approval - see warning just above), add a line near the top of your config file (i.e. in the header section): sysinfo_program = <path_to_your_sysinfo_program> Details about the sysinfo utility may be found in SPEC CPU 2017 Utilities, including how to selectively enable output types, how to resolve conflicting field warnings, and how to write your own sysinfo utility. |
| Option | Use In | Default | Meaning |
| table | H | yes | In ASCII reports, include information about each execution of the benchmark. |
| teeout | H | no | Run output through tee so you can see it on the screen. Primarily affects builds, but also provides some information about progress of runtime, by showing you the specinvoke commands. |
| temp_meter | H | none | Network location (name and port) for the temperature meter to be used by the SPEC Power/Temperature
Daemon (PTD).
New
If you are using more than one temperature meter, separate them by commas.
The temp_meter field tells the run time software where to find the
meter. You also need to tell humans about your temperature meter, using descriptive fields with matching {id}
names, for example:
temp_meter                                   = hex-analyzer001:8889
hw_temperature_hexanalyzer0018889_connection = USB
hw_temperature_hexanalyzer0018889_setup      = Attached directly to air inlet
See the section on Power Measurement, below. |
| threads | H,N | 1 | Value to be set for OMP_NUM_THREADS when benchmarks are run.
Note: If you select basepeak=yes for a SPECspeed benchmark, the number of threads in peak will be forced to be the same as in base. The threads feature is new with CPU 2017. |
| Option | Use In | Default | Meaning |
| train_single_thread | H,N | no | Ensure that feedback training runs are done using only a single thread. The train_single_thread feature is new with CPU 2017. |
| train_with | H,N | train | Select the workload with which to train binaries built using feedback-directed optimization. The ability to train with alternate workloads would not normally be applicable to CPU 2017; the feature was added for the benefit of a different suite that uses the same toolset. Nevertheless, it could be used, for example when studying the efficacy of different training methods, as follows: (1) First convert your tree to a development tree; (2) place your new training workload under nnn.benchmark/data/myworkload. (3) Give it the same structure as the existing training workload: an input/ directory, an output/ directory, and a reftime file with contents similar to the one found in nnn.benchmark/data/train/reftime. For reportable runs, you cannot use binaries that were trained with alternate workloads. |
| tune | H | base | default tuning level. In a reportable run, must be either all or base. For more information on base and peak tuning, see Overview #Q16. |
| use_submit_for_compare | H,N | no | If set, use submit commands for benchmark validation commands if submit was used for the run itself. This feature is new with CPU 2017. |
| use_submit_for_speed | H,N | no | If set, use submit commands for SPECspeed runs as well as SPECrate runs. |
| Option | Use In | Default | Meaning |
| verbose | H | 5 | Verbosity level. Select level 1 through 99 to control how much debugging info runcpu prints out. For more information, see the section on log files, below. |
| verify_binaries | H | yes | runcpu uses checksums to verify that executables match the config file that invokes them, and if they do not, runcpu forces a recompile. You can turn that feature off by setting verify_binaries=no. Warning: It is strongly recommended that you keep this option at its default, yes (that is, enabled). If you disable this feature, you effectively say that you are willing to run a benchmark even if you don't know what you did or how you did it -- that is, you lack information as to how it was built! The feature can be turned off because it may be useful to do so sometimes when debugging (for an example, see env_vars), but it should not be routinely disabled. Since SPEC requires that you disclose how you build benchmarks, reportable runs (using the command-line switch --reportable or config file setting reportable=yes) will cause verify_binaries to be automatically enabled. For CPU 2017, this field replaces the field check_md5 |
| voltage_range | H | none | Set the maximum voltage in volts to be used by the power analyzer(s) for power measurement.
New
|
For SPEC CPU you do not write Makefiles. Instead, you set Make variables in the config file, which are sent to a SPEC-supplied copy of GNU Make, known as specmake. Variables with a dollar sign and parentheses, aka "round brackets", are substituted by specmake. For example:
COMPILER_DIR = /usr/local/bin/
CC           = $(COMPILER_DIR)cc
CXX          = $(COMPILER_DIR)c++
FC           = $(COMPILER_DIR)f90
See below for more information on syntax of variables that you create and reference.
The following Make variables are frequently useful. When selecting where to put a flag, please bear in mind that the run rules require that portability flags must use PORTABILITY variables.
| CC | How to invoke your C compiler. |
| CXX | How to invoke your C++ compiler. |
| FC | How to invoke your Fortran compiler. |
|
CC_VERSION_OPTION CXX_VERSION_OPTION FC_VERSION_OPTION |
New with SPEC CPU 2017: You must specify how to ask each compiler "Please tell me your version" because the method varies from compiler to compiler. The version information is recorded contemporaneously with the build. Here are a few examples from the $SPEC/config (or %SPEC%\config) directory as of Apr-2017 (there are more examples on your installed copy). Example-PGI-linux-x86.cfg CC_VERSION_OPTION = -V Example-gcc-linux-x86.cfg CC_VERSION_OPTION = -v Example-intel-compiler-linux-rate.cfg CC_VERSION_OPTION = --version Example-intel-compiler-windows-rate.cfg CC_VERSION_OPTION = -QV Example-studio-solaris.cfg CC_VERSION_OPTION = -V Example-xl-linux-ppc64le.cfg CC_VERSION_OPTION = -qversion=verbose You must specify the option for all compilers that you use.
In the example below, most benchmarks use the first three compilers. For intrate peak and fpspeed peak, different compilers are chosen, and the config file changes *both* the compiler variable and the compiler version option. default: CC = /bin/xlc CC_VERSION_OPTION = -qversion=verbose FC = /bin/gfortran FC_VERSION_OPTION = -v CXX = /turboblaster/c++ CXX_VERSION_OPTION = --print-blaster intrate=peak: CC = /bin/gcc CC_VERSION_OPTION = -v fpspeed=peak: FC = /bin/xlf FC_VERSION_OPTION = -qversion=verbose |
|
PORTABILITY EXTRA_PORTABILITY |
Portability flags to be applied no matter what the compiler. |
| {C|CXX|F}PORTABILITY EXTRA_{C|CXX|F}PORTABILITY |
Portability flags to be applied to modules of the designated language (For example, CXXPORTABILITY is for the C++ modules). |
|
OPTIMIZE EXTRA_OPTIMIZE |
Optimization flags to be applied for all compilers. |
| {C|CXX|F}OPTIMIZE EXTRA_{C|CXX|F}OPTIMIZE |
Optimization flags to be applied to modules of the designated language. |
| EXTRA_{C|CXX|F}FLAGS | Flags that are neither optimization nor portability |
| LIBS | Libraries to add to the link line |
| PASSn_OPTIMIZE | Flags for pass "n" compilation when using feedback-directed optimization (FDO). Typically n is either 1 or 2, for the compile done before the training run and the compile done after the training run. See the chapter on Using Feedback for more information. |
| PASSn_{C|CXX|F}OPTIMIZE | Flags for pass "n" when compiling modules of the designated language. |
| Many more | See chart in document Make Variables |
New with CPU 2017: For fpspeed (SPECspeed 2017 Floating Point) and intspeed (SPECspeed2017 Integer), you may build using OpenMP and/or compiler auto-parallelization. This capability is much more likely to be useful for Floating Point, because:
| To enable OpenMP |
specspeed: OPTIMIZE = -DSPEC_OPENMP Compiler switch for OpenMP |
| Examples |
specspeed: OPTIMIZE = -DSPEC_OPENMP -fopenmp (GNU) OPTIMIZE = -DSPEC_OPENMP -qsmp=omp (IBM XL) OPTIMIZE = -DSPEC_OPENMP -qopenmp (Intel) OPTIMIZE = -DSPEC_OPENMP -xopenmp (Oracle Studio) OPTIMIZE = -DSPEC_OPENMP -mp (PGI) |
The config file fragment below demonstrates available options.
 1   intspeed:
 2      OPTIMIZE       = -DSPEC_SUPPRESS_OPENMP
 3   657.xz_s=peak:
 4      OPTIMIZE       = --openmp  -DSPEC_OPENMP
 5
 6   fpspeed:
 7      OPTIMIZE       = --openmp
 8      EXTRA_OPTIMIZE = -DSPEC_OPENMP
 9   603.bwaves_s=peak:
10      OPTIMIZE       = --autopar
11      EXTRA_OPTIMIZE = -DSPEC_SUPPRESS_OPENMP
12   619.lbm_s=peak:
13      OPTIMIZE       = --autopar
14      EXTRA_OPTIMIZE = -DSPEC_OPENMP
In the example above:
Having considered an example, let us now look at the conditions in detail. The form of the directives in the benchmarks is:
#if (defined(_OPENMP) || defined(SPEC_OPENMP)) && !defined(SPEC_SUPPRESS_OPENMP) && !defined(SPEC_AUTO_SUPPRESS_OPENMP)
How it works:
If you set neither one of them, then the visibility of the directives will depend upon whether the variable _OPENMP is set. Here, it is important to note that _OPENMP is defined by the OpenMP standard. It requires that if a compiler supports a preprocessor, it must set this variable. However, the SPEC CPU benchmarks do not use vendor-native Fortran preprocessors, because the Fortran standard does not define preprocessing. Instead, the preprocessing is done by filepp (specpp), which does not do anything to OpenMP variables unless explicitly told to do so. Thus the SPEC CPU toolset may behave differently than your vendor-native compiler.
In short, you might find yourself scratching your head wondering why a Fortran OpenMP benchmark is so much faster when you compile it outside the SPEC CPU harness vs. inside.
Recommendation: To avoid a sore scalp (and before blaming the SPEC CPU tools!), if you wish to enable OpenMP please make sure that you always set -DSPEC_OPENMP. If you do not, then directives might or might not be visible, depending on your compiler and depending on the language.
To make this more clear, assume that we are compiling these benchmark excerpts. (For simplicity, we leave aside the duplicated control.)
From 619.lbm_s (C)
   #if (defined(_OPENMP) || defined(SPEC_OPENMP)) && !defined(SPEC_SUPPRESS_OPENMP)
   #pragma omp parallel for
   #endif

From 603.bwaves_s (Fortran)
   #if (defined(_OPENMP) || defined (SPEC_OPENMP)) && !defined(SPEC_SUPPRESS_OPENMP)
   !$OMP PARALLEL DO PRIVATE(l,i,j,k)
   #endif
Further assume that we are using compilers that enable OpenMP by setting a flag called --openmp. The inclusion of the directives will be determined by the truth tables shown below. The important difference occurs at line 7: by the time the Fortran compiler is awakened, it is too late to enable the directives, because that decision was already made by specpp.
|
|
|||||||||||||||||||||||||||||||||||||||||||||||||||||||||||||||||||||||||||||||||||||||||||||||||||||
Variables with a dollar sign and parentheses, aka "round brackets", are substituted by specmake.
Deprecated feature alert: Although it is also possible to pass information to specmake using curly brackets: ${COMPILER_DIR}, this is not recommended. Instead, you should consistently use curly brackets to address runcpu and round brackets to address specmake. It is possible that a future version of runcpu may insist on interpolating curly brackets itself, rather than allowing specmake to do so.
Example:
$ cat makevar.cfg
action            = build
runlist           = 603.bwaves_s
default:
   DEBUG_SYMBOLS  = --debug:symbols=expanded_info_level:42
   EXTRA_FFLAGS   = $(GEE)
fpspeed=base:
   GEE            = -g $(DEBUG_SYMBOLS)
fpspeed=peak:
   GEE            = -g

$ cat makevar.sh
runcpu --config=makevar --fake --tune=base | grep COMP:
runcpu --config=makevar --fake --tune=peak | grep COMP:
$ ./makevar.sh
COMP: "f90 -c -o options.o -g --debug:symbols=expanded_info_level:42 <source>"
COMP: "f90 -c -o options.o -g <source>"
$  (Notes about examples)
The config file above creates two variables options (DEBUG_SYMBOLS and GEE). Both are passed to specmake, which interprets them. The results are shown above using the runcpu --fake option.
For an extensive example of variable substitution handled by specmake, see the SPEC CPU 2000 example at www.spec.org/cpu2000/docs/example-advanced.cfg. Search that file for LIBS, and note the long comment which provides a walk-through of a complex substitution handled by specmake.
The operator "+=" adds to specmake variables. It may be convenient; it also may cause hard-to-diagnose bugs. Example:
$ cat tmp.cfg
action  = build
runlist = 519.lbm_r
tune    = peak
default:
   OPTIMIZE   = -O1
fprate=default:
   OPTIMIZE  += --unroll
default=peak:
   OPTIMIZE  += --inner_unroll
519.lbm_r=peak:
   OPTIMIZE  += --outer_unroll
default=default=breakfast:
   OPTIMIZE   = --jelly_roll

$ runcpu --fake --config=tmp | grep lbm.c
cc -c -o lbm.o -DSPEC -DSPEC_CPU -DNDEBUG -O1 --inner_unroll --unroll --outer_unroll lbm.c
$ (Notes about examples)
Note that the options accumulate.
Caution: although the += operator adds flexibility, it may introduce hard-to-predict behavior, depending on precedence of section specifiers, the order of your config file, and other features, such as include files. Instead of using '+=' try picking different make variables for different purposes. For an example of hard-to-predict behavior, what will happen if you add --label=breakfast to the above runcpu command? (Try it.)
Recommendations:
Avoid += to prevent surprises.
Keep it simple.
Pick different makevars for different purposes.
Create conventions for your config files and write them down, in config file comments.
If you must use += review its effects carefully (--fake is your friend).
When debugging a set of build options, it is often useful to create a "sandbox" - that is, a directory where you can play with the benchmark and its options. This example creates a build sandbox with action buildsetup.
$ cat sandbox.cfg
action        = buildsetup
label         = fast
output_root   = /tmp/demo_buildsetup
runlist       = 519.lbm_r
tune          = peak
default=peak:
   OPTIMIZE   = --fast
$ cat sandbox.sh
runcpu --config=sandbox | grep log
grep Makefile.spec /tmp/demo_buildsetup/result/CPU2017.001.log
$ ./sandbox.sh
The log for this run is in /tmp/demo_buildsetup/result/CPU2017.001.log
Wrote to makefile '/tmp/demo_buildsetup/benchspec/CPU/519.lbm_r/build/build_peak_fast.0000/Makefile.spec':
The action causes a directory to be created
There, the Makefile can be examined, used in a dry run, or modified as part of a testing effort.
$ cd /tmp/demo_buildsetup/benchspec/CPU/519.lbm_r/build/build_peak_fast.0000/
$ grep OPTIMIZE Makefile.spec
OPTIMIZE         = --fast
$ specmake --dry-run
cc -c -o lbm.o  -DSPEC -DSPEC_CPU -DNDEBUG -DSPEC_AUTO_SUPPRESS_OPENMP  --fast  lbm.c
cc -c -o main.o -DSPEC -DSPEC_CPU -DNDEBUG -DSPEC_AUTO_SUPPRESS_OPENMP  --fast  main.c
cc --fast lbm.o main.o -lm  -o lbm_r
$  (Notes about examples)
See also the chapter on specmake in SPEC CPU 2017 Utilities and the sandbox examples in Avoiding runcpu.
The SPEC CPU tools try to keep config files and binaries synchronized with each other.(*)
Edits to a config file may cause binaries to be rebuilt, sometimes to the surprise(**) of testers.
Testing option sensitivity: The first thing that happens in a rebuild is to delete the old binary.
If that is a
potential problem (perhaps it takes a long time to build), you can test whether a config file change will cause a
rebuild:
The command:
No binaries are harmed.
Notes:
New Unless you change verify_binaries. Recommendation: Don't change it.
(**) Recent implementations surprise less often. For detail, see the CPU 2006 version of this section.
Some options in your config file cause commands to be executed by your shell (/bin/sh) or by the Windows command interpreter (cmd.exe).
Substitution by the shell - or by the windows command interpreter - uses backslash dollar sign.
The backslash protects the variables from interpretation by runcpu.
Example: This config file runs 519.lbm_r twice, with base and peak options. Only peak uses backslashes:
$ cat tmp.cfg
expand_notes         = 1
iterations           = 1
runlist              = 519.lbm_r
size                 = test
tune                 = base,peak
default:
   CC                = gcc
   CC_VERSION_OPTION = -v
default=base:
   submit    = echo home=$HOME, spec=$SPEC   > /tmp/chan; ${command}
default=peak:
   submit    = echo home=\$HOME, spec=\$SPEC > /tmp/nui;  ${command}
$ runcpu --config=tmp | grep txt
    format: Text -> /Users/chris/spec/cpu2017/result/CPU2017.697.fprate.test.txt
$ cd /tmp
$ cat chan nui
home=, spec=
home=/Users/chris, spec=/Users/chris/spec/cpu2017
$ (Notes about examples)
In base, $HOME and $SPEC are gobbled up by runcpu, which
obediently retuns their values: nothing at all.
In peak, backslashes prevent runcpu from interpreting
the variables, and the shell provides their
values.
Warning: SPEC CPU config files can execute arbitrary
shell commands.
Read a config file before using it.
Don't be root.
Don't run as Administrator.
Turn privileges off.
These options cause commands to be executed:
| bench_post_setup | Command to be executed after each benchmark's run directory setup phase. The rules say that this feature may be used to cause data to be written to stable storage (e.g. sync). The command must be the same for all benchmarks. It will be run after each benchmark is setup, and for all workloads (test/train/ref). It is not affected by the setting of parallel_test. Use the header section for bench_post_setup. |
|||||||||
| build_pre_bench
build_post_bench |
Commands for benchmark monitoring, described in the document on the Monitoring Facility. | |||||||||
| fdo_make_clean_passN | Commands to be executed for cleanup at pass N. |
The fdo_ options let you use a wide variety of Feedback Directed Optimization (FDO) models, including compiler-based and non-compiler-based instrumentation and optimization using single and multi-pass builds. When you are trying to decide which of these hooks to use, --fake is your friend. See the examples in the section on Using Feedback Your changes must comply with the rules, such as the requirement to use the SPEC-supplied training data. If in doubt, you may write to SPEC. |
||||||||
| fdo_make_passN | Commands to actually do the Nth compile. | |||||||||
| fdo_postN | Commands to be done at the end of pass N. | |||||||||
| fdo_post_makeN | Commands to be done after the Nth compile. | |||||||||
| fdo_pre0 | Commands to execute before starting an FDO series. | |||||||||
| fdo_preN | Commands to be executed before pass N. | |||||||||
| fdo_pre_makeN | Commands to be done prior to Nth compile. | |||||||||
| fdo_runN | Commands to be used for Nth training run. | |||||||||
| monitor_X | Commands that allow benchmark monitoring, described in the document on the Monitoring Facility. | |||||||||
| post_setup | Command to be executed after all benchmark run directories have been set up. The rules say that this feature may be used to cause data to be written to stable storage (e.g. sync). Notes:
|
|||||||||
| submit | Modified command to actually run a benchmark. The default is in ${command}, which the rules allow you to supplement, by sending it to the desired location, such as a particular processor. Several features are typically used in conjunction with submit:
|
|||||||||
The config file feature submit allows you to distribute jobs across a multiprocessor system. This section provides examples to demonstrate how submit works with several other config file features. You might also want to search published results at www.spec.org/cpu2017 for systems that are similar to your system.
You can use your operating system's facilities that assign jobs to processors, such as dplace, pbind, procbind, prun, start/affinity, or taskset together with ${command} and $SPECCOPYNUM.
The example below runs 4 copies, sending each one to a different processor.
$ cat taskset.cfg
copies   = 4
runlist  = 519.lbm_r
submit   = taskset -c $SPECCOPYNUM ${command}
$ cat taskset.sh
runcpu --fake --config=taskset | grep '^taskset' | cut -b 1-75
$ ./taskset.sh
taskset -c 0 ../run_base_refrate_none.0000/lbm_r_base.none 3000 reference.d
taskset -c 1 ../run_base_refrate_none.0000/lbm_r_base.none 3000 reference.d
taskset -c 2 ../run_base_refrate_none.0000/lbm_r_base.none 3000 reference.d
taskset -c 3 ../run_base_refrate_none.0000/lbm_r_base.none 3000 reference.d
$  (Notes about examples)
Notice that $SPECCOPYNUM acquires the values 0, 1, 2, 3 in the generated commands, thereby using a different taskset assignment for each.
A problem with the above example: you might not want to send copy #2 to processor #2 and copy #3 to processor #3.
Perhaps you have a system with
processors that do not have contiguous ID numbers.
Perhaps you want to spread the work out across a system, or you want to
alternate jobs in ping-pong fashion.
You can customize the destinations with a bind list.
A system has 512 virtual processors, 64 chips, 4 cores per chip, 2 threads per core.
We would like to run one copy per chip.
This system does processor binding using pbind -b processor -e command
The bind statement on lines 1 through 5 specifies one processor id from each chip.
Line 11 plugs them into $BIND
$ cat -n pbind.cfg
     1  bind = \
     2       0   8  16  24  32  40  48  56  64  72  80  88  96 104 112 120 \
     3     128 136 144 152 160 168 176 184 192 200 208 216 224 232 240 248 \
     4     256 264 272 280 288 296 304 312 320 328 336 344 352 360 368 376 \
     5     384 392 400 408 416 424 432 440 448 456 464 472 480 488 496 504
     6  copies               = 64
     7  iterations           = 1
     8  output_root          = /tmp/pbind
     9  runlist              = 519.lbm_r
    10  size                 = test
    11  submit               = pbind -b $BIND -e ${command}
    12  verbose              = 40
    13  default:
    14     CC                = cc
    15     CC_VERSION_OPTION = -V
    16
$ cat pbind.sh
runcpu --config=pbind > /dev/null &  # put runcpu in background
sleep 15                             # let things get started
pbind -q > /tmp/pbind/bound          # query bindings
$ ./pbind.sh
$ (Notes about examples)
The pbind.sh script starts the run, waits 15 seconds, and then checks the status with
pbind -q.
Below, we verify that all 64 copies were bound: /tmp/pbind/bound has 64 lines. A few are
shown.
$ wc -l /tmp/pbind/bound
      64 /tmp/pbind/bound
$ sort -nk8 /tmp/pbind/bound | head -6
pbind(1M): pid 22673 strongly bound to processor(s) 0.
pbind(1M): pid 22675 strongly bound to processor(s) 8.
pbind(1M): pid 22682 strongly bound to processor(s) 16.
pbind(1M): pid 22693 strongly bound to processor(s) 24.
pbind(1M): pid 22689 strongly bound to processor(s) 32.
pbind(1M): pid 22685 strongly bound to processor(s) 40.
Although Example 2 sent 64 copies where we want them, we only know that because a separate
process happened to be watching.
That's not good enough. It would be much better to always leave confirmation that submit does what is intended.
To do so, generate a small script for each copy.
This example uses echo to create a script called dobmk for each benchmark copy.
Line 12 writes a processor binding command to the script.
Line 13 appends the ${command} that executes the benchmark.
Line 14 actually runs it.
$ cat -n scriptGen.cfg
     1  bind = \
     2       0   8  16  24  32  40  48  56  64  72  80  88  96 104 112 120 \
     3     128 136 144 152 160 168 176 184 192 200 208 216 224 232 240 248 \
     4     256 264 272 280 288 296 304 312 320 328 336 344 352 360 368 376 \
     5     384 392 400 408 416 424 432 440 448 456 464 472 480 488 496 504
     6  command_add_redirect = yes
     7  copies               = 64
     8  iterations           = 1
     9  output_root          = /tmp/pbind
    10  runlist              = 519.lbm_r
    11  size                 = test
    12  submit0              = echo 'pbind -b $BIND \$\$ >> pbind.out' > dobmk
    13  submit2              = echo "${command}" >> dobmk
    14  submit4              = sh dobmk
    15  default:
    16     CC                = cc
    17     CC_VERSION_OPTION = -V
    18
$ cat scriptGen.sh
runcpu --config=scriptGen | grep copies
$ ./scriptGen.sh
  Setting up 519.lbm_r test base none (64 copies): run_base_test_none.0000-0063
  Running 519.lbm_r test base none (64 copies) [2017-02-10 16:05:16]
$ (Notes about examples)
A generated dobmk is below. Copy #42 gets bound to processor id 336, which is #42 in the
bind list.
Notice that dobmk includes redirection operators, such as >lbm.out
The operators are present because config file line 6 sets command_add_redirect.
$ cd /tmp/pbind/benchspec/CPU/519.lbm_r/run
$ cat run_base_test_none.0042/dobmk
pbind -b 336 $$ >> pbind.out
../run_base_test_none.0000/lbm_r_base.none 20 reference.dat 0 1
             100_100_130_cf_a.of > lbm.out 2>> lbm.err
$  [line wrap added for readability]
All copies run the same benchmark binary, namely the one in directory 0000.
The name of the executable is lbm_r_base.none because label defaults to none.
Lastly, we can verify that the pbind command worked by looking at pbind.out:
$ cat run_base_test_none.0042/pbind.out
pbind(1M): pid 24422 strongly bound to processor(s) 336.
$
The next example generates scripts for numactl.
On line 9, the config file creates a runcpu variable called numactlShow which contains within it the command to demonstrate processor assignment. It is written to dobmk along with the command to actually run the benchmark on lines 10-11. On line 12, dobmk is invoked.
$ cat -n numactl.cfg
     1  iterations              = 1
     2  output_root             = /tmp/numactl
     3  size                    = test
     4  tune                    = base
     5  verbose                 = 40
     6  default: # --------- submit stuff ----------------------------------------
     7     bind                 = 2,  3,  5,  7, 11, 13, 17, 19, 23, 29, 31
     8     command_add_redirect = yes
     9     numactlShow          = numactl --show | grep phys >> numactl-s.out 2>&1
    10     submit0              = echo "$[numactlShow]"        > dobmk
    11     submit3              = echo "${command}"           >> dobmk
    12     submit5              = numactl --physcpubind=$BIND sh dobmk
    13  default: #---------- compiler stuff --------------------------------------
    14     CC                   = gcc
    15     CC_VERSION_OPTION    = -v
    16     OPTIMIZE             = -O3
    17  intrate: #---------- suite stuff -----------------------------------------
    18     copies               = 11
    19
$ cat numactl.sh
runcpu --config=numactl --fake 557.xz_r | grep "The log for this run"
runcpu --config=numactl        557.xz_r | grep txt
$ ./numactl.sh
The log for this run is in /tmp/numactl/result/CPU2017.001.log
    format: Text -> /tmp/numactl/result/CPU2017.002.intrate.test.txt
When the compression program 557.xz_r runs its test workload, the benchmark binary is actually run 11 times, as it tests various types of compression. We can see the evidence of that if we look at a sample run directory. Notice that all 11 invocations of copy #9 used processor #9 from the bind list on line 7 of the config file.
$ cd /tmp/numactl/benchspec/CPU/557.xz_r/run
$ cd run_base_test_none.0009
$ cat numactl-s.out
physcpubind: 29
physcpubind: 29
physcpubind: 29
physcpubind: 29
physcpubind: 29
physcpubind: 29
physcpubind: 29
physcpubind: 29
physcpubind: 29
physcpubind: 29
physcpubind: 29
physcpubind: 29
$  (Notes about examples)
Submit Example 3 uses three types of quoting: backslashes, single quotes, and double quotes.
submit0 = echo 'pbind -b $BIND \$\$ >> pbind.out' > dobmk
submit2 = echo "${command}" >> dobmk
submit4 = sh dobmk
The details of the quoting may seem like more than what you want to know, but can be crucial if you develop or maintain submit options. Caution: here be traps. Quote carefully, then check whether it did what you think it did.
"" Double quotes are used on the submit2 line. They do not prevent interpretation of ${command} because runcpu pays no particular attention to double or single quotes. The command to run lbm_r_base.none is inserted with its arguments and device assignments, and the double quotes are still present when the echo executes, where they protect the device assignments.
For example, here is the echo command from copy #42 (how was this found?) [line wrap added for readability]:
echo "../run_base_test_none.0000/lbm_r_base.none 20 reference.dat 0
   1 100_100_130_cf_a.of > lbm.out 2>> lbm.err" >> dobmk;
TRAP: If you forget the double quotes, you effectively say:
"Please do an echo.
Send standard output to lbm.out.
Send standard error to lbm.err.
No, wait, send standard output to dobmk."
Your operating system does whatever it does with such an odd request; a likely result is that lbm.out is created by the echo, but it has zero bytes, because lbm_r_base.none is not told to write there.
\$\$ On the submit0 line, the designator for the current process is quoted using
backslashes to prevent runcpu from trying to interpret it.
$BIND does not have a backslash, because we do want runcpu to substitute values from the
bind list.
TRAP: If the submit0 uses $$ (without backslashes),
runcpu substitutes its own process ID, and 64 dobmk scripts fight uselessly about the location of runcpu.
'' The submit0 line also uses single quotes, which are still present
when the echo is done.
By then, $BIND has already been substituted, and \$\$ has become $$.
The single quotes prevent $$ substitution by the parent shell that runs echo.
For example, here is what runcpu generated for copy #42 (how was this found?)
echo 'pbind -b 336 $$ >> pbind.out' > dobmk
TRAP: If double quotes are used on submit0 instead of single quotes, an interesting bug happens: the parent shell pid is inserted, dobmk runs, and obediently binds its parent to a processor. It does not bind itself. ("Wait, wait", you say, "Bindings are inherited, so binding the parent should be fine, right?" Well, no. Bindings are inherited only for newly created processes. Binding your parent doesn't do a thing for yourself. So, you definitely want the $$ to become dobmk's PID, not its parent's.)
Start small. Try to debug your options for a run with, say, 3 copies before trying 2048.
When debugging submit options, increase the log verbose option.
Capture standard output from your processor assignment command (e.g. pbind.out from line 12 of Example 3). (It would also be a very good idea to capture standard error.)
Use the specinvoke -n dry run option. On the system where Example 3 was run, a grep verifies that there are 64 generated pbind commands. Another grep picks out the one that belongs to copy #42, using head -43. Copy #42 is, of course, the 43rd copy to run, because copy #0 is the first.
$ pwd
/tmp/pbind/benchspec/CPU/519.lbm_r/run/run_base_test_none.0000
$ specinvoke -n | grep -c pbind
64
$ specinvoke -n | grep pbind | head -43 | tail -1
echo 'pbind -b 336 $$ >> pbind.out' > dobmk;
echo "../run_base_test_none.0000/lbm_r_base.none 20 reference.dat 0
   1 100_100_130_cf_a.of > lbm.out 2>> lbm.err" >> dobmk;
sh dobmk
$
(Because runcpu generates very wide lines, line wraps were inserted for readability.)
Here are two maintainability suggestions for authors of config files that use submit.
If you have followed the debug suggestions above, you possess evidence that your config file works as desired -- today. Preserve the evidence. For example, if you are generating little dobmk scripts, and they generate little tidbits on stdout or stderr to verify processor assignments, keep the tidbits. Resist the temptation to rip them out. They provide cheap insurance against mysterious failures, for example when a new operating system changes the environment.
Although runcpu generates very wide lines, you should not. Your config file will be more maintainable if you limit your line width.
To limit line width, you can use any of the three continuation styles discussed at the top of this document.
All three styles are used in this config file. All have the same effect.
$ cat -n continued.cfg
     1  command_add_redirect = yes
     2  copies               = 8
     3  iterations           = 1
     4  output_root          = /tmp/submit
     5  runlist              = 505.mcf_r
     6  size                 = test
     7  use_submit_for_speed = yes
     8  default:
     9     CC                = cc
    10     CC_VERSION_OPTION = -V
    11  intrate=base=backslash:
    12     submit0 = echo 'pbind -b $SPECCOPYNUM \$\$ >> pbind.out' > dobmk \
    13               echo "${command}" >> dobmk \
    14               sh dobmk
    15  intrate=base=fieldN:
    16     submit0 = echo 'pbind -b $SPECCOPYNUM \$\$ >> pbind.out' > dobmk
    17     submit2 = echo "${command}" >> dobmk
    18     submit4 = sh dobmk
    19  intrate=base=heredoc:
    20     submit = <<EOT
    21               echo 'pbind -b $SPECCOPYNUM \$\$ >> pbind.out' > dobmk
    22               echo "${command}" >> dobmk
    23               sh dobmk
    24  EOT
To run the config file, the script below uses three runcpu commands with three different --label switches. After the runs finish, it produces a list of dobmk files that were generated, and prints a sample of each type.
$ cat continued.sh
runcpu --config=continued --label=backslash | grep copies
runcpu --config=continued --label=fieldN    | grep copies
runcpu --config=continued --label=heredoc   | grep copies
#
cd /tmp/submit/benchspec/CPU/505.mcf_r/run
ls *backslash*/dobmk
ls *fieldN*/dobmk
ls *heredoc*/dobmk
#
for file in *0007/dobmk ; do
   echo ==== $file =====
   cat $file
done
$ ./continued.sh
  Setting up 505.mcf_r test base backslash (8 copies): run_base_test_backslash.0000-0007
  Running 505.mcf_r test base backslash (8 copies) [2017-02-11 07:38:32]
  Setting up 505.mcf_r test base fieldN (8 copies): run_base_test_fieldN.0000-0007
  Running 505.mcf_r test base fieldN (8 copies) [2017-02-11 07:40:55]
  Setting up 505.mcf_r test base heredoc (8 copies): run_base_test_heredoc.0000-0007
  Running 505.mcf_r test base heredoc (8 copies) [2017-02-11 07:43:15]

run_base_test_backslash.0000/dobmk  run_base_test_backslash.0004/dobmk
run_base_test_backslash.0001/dobmk  run_base_test_backslash.0005/dobmk
run_base_test_backslash.0002/dobmk  run_base_test_backslash.0006/dobmk
run_base_test_backslash.0003/dobmk  run_base_test_backslash.0007/dobmk
run_base_test_fieldN.0000/dobmk  run_base_test_fieldN.0004/dobmk
run_base_test_fieldN.0001/dobmk  run_base_test_fieldN.0005/dobmk
run_base_test_fieldN.0002/dobmk  run_base_test_fieldN.0006/dobmk
run_base_test_fieldN.0003/dobmk  run_base_test_fieldN.0007/dobmk
run_base_test_heredoc.0000/dobmk  run_base_test_heredoc.0004/dobmk
run_base_test_heredoc.0001/dobmk  run_base_test_heredoc.0005/dobmk
run_base_test_heredoc.0002/dobmk  run_base_test_heredoc.0006/dobmk
run_base_test_heredoc.0003/dobmk  run_base_test_heredoc.0007/dobmk

==== run_base_test_backslash.0007/dobmk =====
pbind -b 7 $$ >> pbind.out
../run_base_test_backslash.0000/mcf_r_base.backslash inp.in  > inp.out 2>> inp.err

==== run_base_test_fieldN.0007/dobmk =====
pbind -b 7 $$ >> pbind.out
../run_base_test_fieldN.0000/mcf_r_base.fieldN inp.in  > inp.out 2>> inp.err

==== run_base_test_heredoc.0007/dobmk =====
pbind -b 7 $$ >> pbind.out
../run_base_test_heredoc.0000/mcf_r_base.heredoc inp.in  > inp.out 2>> inp.err
$ (Notes about examples)
If you use the submit feature, a notes section will automatically be created to indicate that you have done so.
                                 Submit Notes
                                 ------------
    The config file option 'submit' was used.
You can add notes to that section, or customize it as you wish, by creating lines with notes_submit_NNN. The phrase The config file option 'submit' was used must appear somewhere in your customized notes. You can vary the capitalization of the phrase, you can even break it across multiple lines; it just needs to be present. If it is not, it will automatically be added.
The notes on lines 16-20 appear and disappear automatically depending on whether submit is used.
$ cat -n notes_submit.cfg
     1  iterations              = 1
     2  output_root             = /tmp/notes_submit
     3  size                    = test
     4  verbose                 = 40
     5  default: # --------- submit stuff ----------------------------------------
     6     bind                 = <<EOT
     7                              2,  3,  5,  7, 11, 13, 17, 19, 23, 29, 31
     8                             37, 41, 43, 47, 53, 59, 61, 67, 71, 73, 79
     9                             83, 89, 97
    10  EOT
    11     command_add_redirect = yes
    12     numactlShow          = numactl --show | grep phys >> numactl-s.out 2>&1
    13     submit02             = echo '$[numactlShow]'        > dobmk
    14     submit03             = echo '${command}'           >> dobmk
    15     submit05             = numactl --physcpubind=$BIND sh dobmk
    16     notes_submit_007     =
    17     notes_submit_011     = The config file option
    18     notes_submit_013     = 'submit' was used to prefer
    19     notes_submit_017     = prime processors.
    20     notes_submit_019     =
    21  default: #---------- compiler stuff --------------------------------------
    22     CC                   = gcc
    23     CC_VERSION_OPTION    = -v
    24     OPTIMIZE             = -O
    25  intrate: #---------- suite and benchmark stuff ---------------------------
    26     copies               = 21
    27  intspeed:
    28     use_submit_for_speed = yes
    29  657.xz_s=peak:
    30     EXTRA_OPTIMIZE       = -DSPEC_OPENMP -fopenmp
    31     use_submit_for_speed = no
    32     threads              = 29
    33
The script below uses this config file for three runcpu commands:
After the 3 runcpu commands, various results are printed, as explained below.
$ cat notes_submit.sh
runcpu --config=notes_submit 557.xz_r --tune=base | grep txt
runcpu --config=notes_submit 657.xz_s --tune=base | grep txt
runcpu --config=notes_submit 657.xz_s --tune=peak | grep txt

echo
grep -C1 "to prefer" /tmp/notes_submit/result/CPU2017.00*txt

cd /tmp/notes_submit/benchspec/CPU/557.xz_r/run/
  num_dirs=$(ls -d run* | wc -l)
 num_dobmk=$(ls run*/dobmk | wc -l)
echo
echo 557.xz_r has $num_dirs run dirs and $num_dobmk dobmk scripts

cd /tmp/notes_submit/benchspec/CPU/657.xz_s/run/
      num_dirs_base=$(ls -d run*base* | wc -l)
      num_dirs_peak=$(ls -d run*peak* | wc -l)
 num_dobmk_base=$(ls run*base*/dobmk | wc -l)
 num_dobmk_peak=$(ls run*peak*/dobmk 2>/dev/null | wc -l)
echo
echo "657.xz_s base has $num_dirs_base run dir(s) and $num_dobmk_base dobmk script(s)"
echo "657.xz_s peak has $num_dirs_peak run dir(s) and $num_dobmk_peak dobmk script(s)"
Notice that when grep searches for "to prefer" in the generated reports, it finds that phrase from notes_submit in CPU2017.001.intrate.test.txt and in CPU2017.002.intspeed.test.txt, but not in CPU2017.003.intspeed.test.txt:
$ ./notes_submit.sh
    format: Text -> /tmp/notes_submit/result/CPU2017.001.intrate.test.txt
    format: Text -> /tmp/notes_submit/result/CPU2017.002.intspeed.test.txt
    format: Text -> /tmp/notes_submit/result/CPU2017.003.intspeed.test.txt

/tmp/notes_submit/result/CPU2017.001.intrate.test.txt-     The config file option
/tmp/notes_submit/result/CPU2017.001.intrate.test.txt:     'submit' was used to prefer
/tmp/notes_submit/result/CPU2017.001.intrate.test.txt-     prime processors.
--
/tmp/notes_submit/result/CPU2017.002.intspeed.test.txt-     The config file option
/tmp/notes_submit/result/CPU2017.002.intspeed.test.txt:     'submit' was used to prefer
/tmp/notes_submit/result/CPU2017.002.intspeed.test.txt-     prime processors.

557.xz_r has 21 run dirs and 21 dobmk scripts

657.xz_s base has 1 run dir(s) and 1 dobmk script(s)
657.xz_s peak has 1 run dir(s) and 0 dobmk script(s)
$  (Notes about examples)
The final portion of the output shows that the run directories match the notes.
In short, when submit comes and goes, the notes magically do the same.
Whether or not you send your result to SPEC, you should fully disclose how you achieved the result. If it requires the installation of the GoFastLinker, you should say so. By setting the appropriate fields in the config file, you can cause information about the GoFastLinker to appear in the reports that are intended for humans.
Here are the fields that you can set to describe your testbed to readers:
| Option | Meaning | ||||||||||||||||||||
| fw_bios | Customer-obtainable name, version, and availability date for the system firmware (also sometimes called 'BIOS') on the System Under Test (SUT). Document here whatever will most help someone who wants to reproduce your results. Often, that will be the name of a firmware package from the vendor support web pages. Include the date when the firmware became generally available (which may be later than the build date). Syntax: The validator expects the field to include the phrase: Version <id> released MMM-YYYY
Example: fw_bios = TurboBlasterFW version 20 released Jul-2022 Which firmware should be disclosed? Rule 4 requires that all performance-relevant options chosen for a SPEC CPU test must be disclosed. For example, suppose that a single SPEC CPU result depends on performance-relevant updates to:
If items 2, 3, 4, and 5 are included in item 1, then only item 1 needs to be disclosed by the tester. If separate actions are needed for all of the above, then all of them must be disclosed. (And, of course, all of them must be generally available, documented, and supported.) If you need more space, you can add platform notes. Is it "firmware" or "BIOS" or "Microcode" or "PROM" or what? It is understood that vocabulary may vary among architectures and among vendors, including terms such as "firmware", "bios", and "microcode". Sometimes, these are referenced by how they are stored: "control store", "fpga", "prom" and so forth. If SPEC CPU performance depends on an update to any of these - no matter what it is called - then it must be disclosed. Is it "firmware" or "hardware" or "software"? Historically, it has sometimes been difficult to classify updates as "firmware", "hardware", or "software" due to differences among vendors as to how updates are obtained, applied, and by whom. If your SPEC CPU result depends on update X and you are unsure whether to document X as hardware, software, or firmware, please consider common industry practice and reader expectations. Try to document it in the section where readers will look for it. About Dates: If the system under test allows hardware, software, and firmware to be updated independently, then the dates should be specified independently. If there are dependencies, then the reported dates should properly reflect the dependencies. For example, suppose that results are published for the systems described below:
The fw_bios field is new with CPU 2017. |
| Option | Meaning |
| fw_management | Customer-obtainable name and version for the firmware of the system management controller (also sometimes referred to as 'BMC') on the System Under Test (SUT), or "None" if the SUT has no management device. Document here whatever will most help someone who wants to reproduce your results. Often, that will be the name of a firmware package from the vendor support web pages. Syntax: The validator expects the field to include the phrase: Version <id> of <...>
Example: fw_management = Version 2.2.3 of Sun Remote System Control (RSC) The fw_management field is new with CPU 2017 v1.1. This field only appears on reports for results where the energy metric appears. |
| Option | Meaning |
| hw_avail |
Date hardware first shipped. If more than one date applies, use the LATEST one. See also the discussion of dates under the fw_bios section |
| hw_backplane | The description and part or model number of any back- or center-planes used to support different storage or CPU/memory options, if the system supports multiple options; or "N/A" if this field is Not Applicable. New This field only appears on reports for results where the energy metric appears. |
| hw_cpu_max_mhz | Maximum speed of the CPUs as specified by the chip vendor, in MHz. For reportable runs, you must specify a value for both hw_cpu_max_mhz and hw_cpu_nominal_mhz. The hw_cpu_max_mhz field is new with CPU 2017 |
| hw_cpu_name | Manufacturer-determined formal processor name.
If a system uses more than one chip type, separate them with a comma. (And of course the usual rules apply: the system, as tested, must be documented/supported/generally available.) |
| hw_cpu_nominal_mhz | Speed of the CPUs as specified by the chip vendor, in MHz. For reportable runs, you must specify a value for both hw_cpu_max_mhz and hw_cpu_nominal_mhz. The hw_cpu_nominal_mhz field is new with CPU 2017 |
| hw_disk | Disk subsystem for the SPEC run directories. Three important Notes:
|
| hw_line_standard | Line standards for the main AC power as provided by the local utility company.
New
Examples: hw_line_standard = 120 V / 60 Hz / 1 phase / 2 wire hw_line_standard = 208 V / 50 Hz / 3 phase / 4 wire This field only appears on reports for results where the energy metric appears. |
| Option | Meaning |
| hw_memory | Size of main memory (and other performance-relevant information about memory, as discussed in the run rules.) Your entry in the field should usually begin N GB (N x N GB
Within the parentheses, continue with the JEDEC label as printed on the DIMM.
Conclude the parenthetical with other performance-relevant information that may be needed to
describe your memory.
For thousands of examples, see the SPEC website published results. For more info about JEDEC, download the labelling standards. These are free, but require registration, and may evolve from time to time. Links valid as of May-2017 are: "DDR3 DIMM Label" and DDR4 SDRAM UDIMM Design Specification, chapter 8. |
| hw_memory_mode | How the memory subsystem on the SUT is configured.
New
This field only appears on reports for results where the energy metric appears. |
| Option | Meaning |
| hw_model | Model name. |
| hw_nchips | Number of CPU chips configured. See the discussion of CPU counting in the run rules. |
| hw_ncores | Number of CPU cores configured. See the discussion of CPU counting in the run rules. |
| hw_ncpuorder | Valid number of processors orderable for this model, including a unit. For example, "2, 4, 6, or 8 chips". |
| hw_nics | The number and model numbers of the network devices installed in the system. New Syntax: The validator expects the field to include at least one instance of: <n> x <id> @ <speed>[...]
Example: hw_nics = 2 x on-board @ 1 GbE; 4 x Mellanox ConnectX 5 @ 200 Gbps This field only appears on reports for results where the energy metric appears. |
| hw_nics_connected | The number of network interfaces physically connected to networks and the speeds at which they are connected. New Syntax: The validator expects the field to include at least one instance of: <n> @ <speed> <unit>[...]
Example: hw_nics_connected = 1 @ 1 Gbps This field only appears on reports for results where the energy metric appears. |
| hw_nics_enabled | The number of network interfaces enabled at the firmware level and configured in the operating system. New Syntax: The validator expects the field to consist of: <n> / <m>
Example: hw_nics_enabled = 2 / 1 This field only appears on reports for results where the energy metric appears. |
| Option | Meaning |
| hw_nthreadspercore | Number of hardware threads per core. See the discussion of CPU counting in the run rules. |
| hw_ocache | 4th level or other form of cache. |
| hw_other |
New Spring 2024: SPEC is now requiring that SPEC CPU 2017 results published on the SPEC website must disclose the CPU cooling method in the hw_other field, along with any other performance-relevant hardware. Begin with one of these phrases:
For the purposes of SPEC CPU documentation, these broad definitions are to be used:
Additional detail: the hw_other field may be continued with the usual methods. In that case, do not say hw_other; instead say hw_other001, hw_other002 and so forth. If you need more than around 15 words or so, continue your description in notes_plat_cooling_001, notes_plat_cooling_002, and so forth. You might also need to use the notes section if your system uses multiple cooling methods for SPEC CPU performance-relevant components. What if there are no options to select? If the system comes one and only one way (for example, the high end CPU comes only with the high end cooling system and the user is not allowed to make any choices), nevertheless for results published on the SPEC website starting in Spring 2024 you will still need to summarize the cooling using one of the above phrases. If you wish to insist on not providing any detail then you can use "CPU Cooling: Not configurable". |
| hw_other_model | Name and model numbers of other hardware present in the system that consumes power but does not contribute to the performance of the system (and would thus be documented in hw_other), or "None" if there isn't any. New This field only appears on reports for results where the energy metric appears. |
| hw_other_storage | Name and model numbers of connected storage devices that were installed, but not used, to run the benchmark; such as unused hard disks, optical drives, or HBAs. If there are none, this field should be set to "None". New This field only appears on reports for results where the energy metric appears. |
| hw_pcache | 1st level (primary) cache. |
| hw_power_{id}_cal_date | The date the power meter was last calibrated.
New
This field only appears on reports for results where the energy metric appears. |
| hw_power_{id}_cal_label | A number or character string which uniquely identifies this meter calibration event.
New
The {id} is based on the name of your power_analyzer. This field only appears on reports for results where the energy metric appears. |
| hw_power_{id}_cal_org | The name of the organization or institute that did the calibration.
New
This field only appears on reports for results where the energy metric appears. |
| Option | Meaning |
| hw_power_{id}_connection | Description of the interface used to connect the power analyzer to the PTDaemon host system, e.g. RS-232 (serial port),
USB, GPIB, etc.
New
This field only appears on reports for results where the energy metric appears. |
| hw_power_{id}_label | A label to be printed at the top of report sections describing this analyzer.
New
If you have more than one analyzer, they will be reported in separate sections.
power_analyzer                    = hex-analyzer001:8888, hex-analyzer002:8888
hw_power_hexanalyzer0018888_label = Base System Power Analyzer
hw_power_hexanalyzer0028888_label = Storage Cabinet Power Analyzer
This field only appears on reports for results where the energy metric appears. |
| hw_power_{id}_met_inst | The name of the metrology institute that certified the organization that did the calibration of the
power analyzer (for example: NIST, PTB, AIST, NML, CNAS).
New
This field only appears on reports for results where the energy metric appears. |
| hw_power_{id}_model | The model name of the power analyzer used for this benchmark run.
New
This field only appears on reports for results where the energy metric appears. |
| hw_power_{id}_serial | The serial number uniquely identifying the power analyzer.
New
This field only appears on reports for results where the energy metric appears. |
| hw_power_{id}_setup | Briefly describe how the analyzer is arranged for use with the SUT (for example, type of
connection, or which power supplies are measured by this analyzer).
New
The {id} is based on the name of your power_analyzer. This field only appears on reports for results where the energy metric appears. |
| Option | Meaning |
| hw_power_{id}_vendor | Company which manufactures and/or sells the power analyzer.
New
This field only appears on reports for results where the energy metric appears. |
| hw_power_provisioning | Description of how the SUT is powered.
New
Warning: for SPEC CPU 2017, "Battery-powered" is not an acceptable choice for reportable runs -- see rule 3.9.2 (e). This field only appears on reports for results where the energy metric appears. |
| hw_psu | The number and ratings (in Watts) of the systems power supplies. New This field only appears on reports for results where the energy metric appears. |
| hw_psu_info | Details about the power supplies, such as vendor part number, manufacturer, etc. New This field only appears on reports for results where the energy metric appears. |
| hw_scache | 2nd level cache. |
| hw_storage_model | Name and model numbers of storage hardware (including HBAs) used to run the benchmark, if the model numbers have not been completely disclosed in the hw_disk field. New This field only appears on reports for results where the energy metric appears. |
| hw_tcache | 3rd level cache. |
| Option | Meaning |
| hw_temperature_{id}_connection | Description of the interface used to connect the temperature meter to the PTDaemon host system.
New
This field only appears on reports for results where the energy metric appears. |
| hw_temperature_{id}_label | A label to be printed at the top of report sections describing this temperature meter.
New
If you have more than one temperature meter, they will be reported in separate sections.
temp_meter                              = hex-analyzer001:8889, hex-analyzer002:8889
hw_temperature_hexanalyzer0018889_label = Base System Temperature Meter
hw_temperature_hexanalyzer0028889_label = Storage Cabinet Temperature Meter
This field only appears on reports for results where the energy metric appears. |
| hw_temperature_{id}_model | The model name of the temperature meter used for this benchmark run.
New
This field only appears on reports for results where the energy metric appears. |
| hw_temperature_{id}_serial | The serial number uniquely identifying the temperature meter.
New
This field only appears on reports for results where the energy metric appears. |
| hw_temperature_{id}_setup | Brief description of how the temperature meter is arranged for use with the SUT (for example, where the
probe is placed, or which portion of the SUT it measures).
New
The {id} is based on the name of your temp_meter. This field only appears on reports for results where the energy metric appears. |
| hw_temperature_{id}_vendor | Company which manufactures and/or sells the temperature meter.
New
This field only appears on reports for results where the energy metric appears. |
| Option | Meaning |
| hw_vendor | The hardware vendor. An example of usage of this and related fields is given in the test_sponsor section. |
| license_num | The SPEC license number for either the tester or the test_sponsor. |
| power_management | Briefly summarize the power settings for the system under test. New Examples:
Explain your settings in a platform flags file and/or the power settings notes. For example: power_management001 = BIOS and OS set to prefer performance at the cost power_management002 = of additional power usage. notes_power_001 = The OS 'poweradm' utility is set to 'disable': notes_power_003 = No attempt is made to save power. notes_power_011 = The BIOS "Energy Mode" option is set to "Performance": notes_power_012 = All CPUs are always enabled, all fans are full speed. |
| Option | Meaning |
| prepared_by | Is never output. If you wish, you could set this to your own name, so that the rawfile will be tagged with your name but not the formal reports. |
| sw_avail |
Availability date for the software used. If more than one date applies, use the LATEST one. (The SPEC CPU suite used for testing is NOT part of the consideration for software availability date.) See also the discussion of dates under the fw_bios section |
| sw_base_ptrsize |
Size of pointers in base. Report:
|
| sw_compiler | Name and version of compiler. Note that if more than one compiler is used, you can employ continuation lines, as with most other descriptive fields |
| sw_file | File system (ntfs, ufs, nfs, etc) for the SPEC run directories. Three important Notes:
|
| Option | Meaning |
| sw_os | Operating system name and version. |
| sw_other | Any other performance-relevant non-compiler software used, including third-party libraries, accelerators, etc. |
| sw_peak_ptrsize | Size of pointers in peak. Report:
|
| sw_state | Multi-user, single-user, default, etc. |
| tester | The entity actually carrying out the tests. An optional field; if not specified, defaults to test_sponsor. An example is given in the test_sponsor section. |
| test_elevation | The elevation above sea level in meters of the site where the benchmark was run.
New
This field only appears on reports for results where the energy metric appears. |
| test_sponsor | The entity sponsoring this test. An optional field; if not specified, defaults to hw_vendor. For example, suppose that the Genius Compiler Company wants to show off their new compiler on the TurboBlaster 9000 computer, but does not happen to own a maxed-out system with eight thousand processors. Meanwhile, the Pawtuckaway State College Engineering department has just taken delivery of such a system. In this case, the compiler company could contract with the college to test their compiler on the big machine. The fields could be set as:
      test_sponsor = Genius Compilers
      tester       = Pawtuckaway State College
      hw_vendor    = TurboBlaster
|
Fields can appear and disappear based upon scope. For example, if your floating point runs used two Fortran compilers (which is allowed for peak), you could construct a config file that adjusts the fields accordingly:
$ cat tmp.cfg
expand_notes      = 1
hw_vendor         = Turboblaster, Inc.
output_format     = text
output_root       = /tmp/fake
default:
   hw_avail       = Feb-2018
   sw_avail       = Jan-2018
   sw_compiler1   = C: V42.0 of TurboBlaster C/C++
   sw_compiler2   = Fortran: V42.2 of TurboBlaster Fortran
fprate:
   sw_avail       = Apr-2018
   sw_compiler3   = Fortran: V7.3.0 of gfortran
   notes_comp_100 = In base, all benchmarks use Turboblaster Fortran
   notes_comp_110 = In peak, some benchmarks use Turboblaster Fortran and some
   notes_comp_120 =          benchmarks use gfortran, as noted in the report.
$ runcpu --fakereportable --config=tmp intrate fprate | grep rate.txt
    format: Text -> /tmp/fake/result/CPU2017.001.intrate.txt
    format: Text -> /tmp/fake/result/CPU2017.001.fprate.txt
$ cd /tmp/fake/result
$ grep avail CPU2017.001.intrate.txt
    Test sponsor: Turboblaster, Inc.             Hardware availability: Feb-2018
    Tested by:    Turboblaster, Inc.             Software availability: Jan-2018
$ grep avail CPU2017.001.fprate.txt
    Test sponsor: Turboblaster, Inc.             Hardware availability: Feb-2018
    Tested by:    Turboblaster, Inc.             Software availability: Apr-2018
$ grep ortran CPU2017.001.intrate.txt
                      Fortran: V42.2 of TurboBlaster Fortran
$ grep ortran CPU2017.001.fprate.txt
                      Fortran: V42.2 of TurboBlaster Fortran
                      Fortran: V7.3.0 of gfortran
     In base, all benchmarks use Turboblaster Fortran
     In peak, some benchmarks use Turboblaster Fortran and some
              benchmarks use gfortran, as noted in the report.
$ (Notes about examples)
In the above example, notice that both the compiler information and the availability date changed in the report, depending on the metric.
In addition to the pre-defined fields, you can write as many notes as you wish. These notes are printed in the report, using a fixed-width font. For example, you can use notes to describe software or hardware information with more detail beyond the predefined fields:
   notes_os_001  = The operating system used service pack 2 plus patches
   notes_os_002  = 31415, 92653, and 58979.  At installation time, the
   notes_os_003  = optional "Numa Performance Package" was selected.
There are various notes sections. If there are no notes in a particular section, it is not output, so you don't need to worry about making sure you have something in each section.
The sections, in order of appearance, are as follows:
Notes about the submit command are described above, with the description of the submit option.
Start your notes with the name of the notes section where you want the note to appear, and then add numbers to define the order of the lines. Within a section, notes are sorted by line number. The NNN above is not intended to indicate that you are restricted to 3 digits; you can use a smaller or larger number of digits as you wish, and you can skip around as you like: for example, ex-BASIC programmers might naturally use line numbers 100, 110, 120... But note that if you say notes_plat782348320742972403 you just might encounter the dreaded (and highly unusual) "out of memory" error, so don't do that.
You can optionally include an underscore just before the number, but beware: if you say both notes_plat_105 and notes_plat105, both are considered to be the same line. The last one mentioned will replace the first, and it will be the only one output.
For all sections you can add an optional additional tag of your choosing before the numbers. Notes will be organized within the tags.
The intent of the feature is that it may allow you to organize your system information in a manner that better suits your own categories for describing it.
For example:
$ cat notes_tags.cfg
iterations      = 1
output_format   = text
output_root     = /tmp/notes_tags
runlist         = 519.lbm_r
size            = test
fprate=base:
   CC                       = gcc
   CC_VERSION_OPTION        = -v
   notes_part_greeting_011  = ++ how
   notes_part_greeting_20   = ++ you?
   notes_part_greeting_012  = ++ are
   notes_part_aname_1       = ++ Alex,
   notes_part_080           = ++ hi

$ cat notes_tags.sh
runcpu --config=notes_tags | grep txt
grep '++' /tmp/notes_tags/result/CPU2017.001*txt
$ ./notes_tags.sh
    format: Text -> /tmp/notes_tags/result/CPU2017.001.fprate.test.txt
     ++ hi
     ++ Alex,
     ++ how
     ++ are
     ++ you?
$ (Notes about examples)
You can mention URLs in your notes section, and html reports will correctly render them as hyperlinks. For example:
notes_plat_001 = Additional detail may be found at
notes_plat_002 = http://www.turboblaster.com/servers/big/green/
If you like, you can use descriptive text for the link by preceding it by the word LINK and adding the descriptive text in square brackets:
LINK url AS [descriptive text]
The brackets may be omitted if your descriptive text is a single word, without blanks.
For example:
notes_plat_001 = Additional detail may be found at
notes_plat_002 = LINK http://www.turboblaster.com/servers/big/green/ AS [TurboBlaster Servers]
When the above appears in an html report, it is rendered as:
 Additional detail may be found at
 TurboBlaster Servers
And in a text report, it appears as:
                                Platform Notes
                                --------------
     Additional detail may found at
     TurboBlaster Servers (http://www.turboblaster.com/servers/big/green/)
Since the text report is not a context in which the reader can click on a link, it is spelled out instead. Note that because the text report spells the link out, the text line is wider than in HTML, PS, and PDF reports. When deciding where to break your notes lines, you'll have to pick whether to plan line widths for text (which may result in thin-looking lines elsewhere) or plan your line widths for HTML/PS/PDF (which may result in lines that fall of the right edge with text). The feature notes_wrap_columns won't help you here, since it is applied before the link is spelled out.
If benchmarks are optimized to use multiple threads, cores, and/or chips at run time, this is reported via the phrase:
Parallel: Yes
The value for "Parallel" is derived from the parallel flag attribute for compiler flags that cause binaries to be multi-threaded.
Feedback Directed Optimization (FDO) is an optimization method that uses multiple steps, typically:
FDO is also sometimes known as PBO, for Profile-Based Optimization.
This section explores FDO controls and provides examples.
The controls are:
All examples in this section use --fake, which is especially recommended when debugging FDO commands. You can send fake's very wordy output to a file to study it, or subset it with commands such as grep or findstr.
To use feedback, you must use either a PASSn make variable, which adds flags to a pre-defined sequence of FDO build steps; or an fdo_ shell option, which lets you modify and add to the sequence of FDO steps.
PASSn: The most common way of using Feedback Directed Optimization is by setting PASSn
makevars (summary) (full list).
The sequence is:
$ cat fdoExample1.cfg
action          = build
runlist         = 549.fotonik3d_r
tune            = peak
default=peak:
   FC           = tbf90
   PASS1_FFLAGS = --CollectFeedback
   PASS2_FFLAGS = --ApplyFeedback
This example config file use Turboblaster Fortran 90 to build 549.fotonik3d_r specifying
PASS1 and PASS2 flags.
A script picks out a few lines from the log file, including Fortran compile commands for source module
readline.f90.
$ cat fdoExample1.sh
runcpu --config=fdoExample1 --fake | grep -e readline.f90 -e Train
$ ./fdoExample1.sh
tbf90 -c -o readline.o -I. --CollectFeedback readline.f90
Training 549.fotonik3d_r with the train workload
tbf90 -c -o readline.o -I. --ApplyFeedback readline.f90
$  (Notes about examples)
fdo_: Feedback Directed Optimization can also be done by
setting up up fdo shell commands.
For example:
$ cat fdoExample2.cfg
action          = build
runlist         = 549.fotonik3d_r
tune            = peak
default=peak:
   FC           = tbf90
   OPTIMIZE  = -fast -profile:fbdir
   fdo_post1 = /opt/bin/postoptimizer --profile:fbdir
Notice that this config file does not mention PASS1, but does use fdo_post1.
The script below picks out a few lines of interest from the log:
$ cat fdoExample2.sh
runcpu --config=fdoExample2 --fake \
   | grep -e readline.f90 -e Train -e '^/opt'
$ ./fdoExample2.sh
tbf90 -c -o readline.o -I. -fast -profile:fbdir readline.f90
Training 549.fotonik3d_r with the train workload
/opt/bin/postoptimizer --profile:fbdir
$ (Notes about examples)
Unlike the previous example, the grep command finds only one compile for readline.f90.
You can adjust the fdo commands that are generated. Perhaps the default model is almost correct for your needs, and you just want minor changes. Caution: Before changing an fdo_ option, find its current setting using --fake. Check it in the context of your config file: the commands will vary.
Goal: discover exactly what the SPEC tools are doing during pass 2 cleanup.
$ cat fdoExample3.cfg
action          = build
output_root     = /tmp/fake
runlist         = 549.fotonik3d_r
tune            = peak
default=peak:
   FC           = tbf90
   PASS1_FFLAGS = --CollectFeedback
   PASS2_FFLAGS = --ApplyFeedback
The config file sends output to an output_root.
The script below searches the log file in the result/ directory under that root. The command grep
-n prints numbered lines matching '%% Fake commands' and the cut command prints out the
first 5 words from matching lines.
$ cat fdoExample3.sh
runcpu --config=fdoExample3 --fake | grep "log for"
grep -n '%% Fake commands' /tmp/fake/result/CPU2017.001.log \
    | cut -f 1-5 -d' '
$
$ ./fdoExample3.sh
The log for this run is in /tmp/fake/result/CPU2017.001.log
387:%% Fake commands from make.clean
397:%% Fake commands from fdo_make_pass1
438:%% Fake commands from options1
482:%% Fake commands from compiler-version1
496:%% Fake commands from input_generation
611:%% Fake commands from benchmark_run
720:%% Fake commands from compare_run
819:%% Fake commands from fdo_make_clean_pass2
828:%% Fake commands from fdo_make_pass2
869:%% Fake commands from options2
913:%% Fake commands from compiler-version2
Suppose we are specifically interested in what happens during fdo_make_clean_pass2, line 819 in the above list.
To see the details, look just before and just after the matching phrase:
$ cat -n /tmp/fake/result/CPU2017.001.log | head -825 | tail -10
   816
   817  specmake -n --output-sync fdoclean FDO=PASS2
   818
   819  %% Fake commands from fdo_make_clean_pass2 (specmake -n --output-sync fdoclean FDO=P...):
   820  rm -rf *.o  pscyee.out
   821  find . \( -name \*.o -o -name '*.fppized.f*' -o -name '*.i' -o -name '*.mod' \) -print | xargs rm -rf
   822  rm -rf fotonik3d_r
   823  rm -rf fotonik3d_r.exe
   824  %% End of fake output from fdo_make_clean_pass2 (specmake -n --output-sync fdoclean FDO=P...)
   825
$ (Notes about examples)
To decipher the above:
Combining PASSn and fdo_ You can combine PASSn and fdo_ while adjusting
the feedback commands.
For example, suppose that your compiler does not need to recompile all the modules in step 2; you
just want to relink.
Difficulty: by default, build #2 deletes all the object files.
$ cat -n fdoExample4.cfg
     1  action                   = build
     2  runlist                  = 549.fotonik3d_r
     3  tune                     = peak
     4  default=peak:
     5     FC                   = pgf90
     6     PASS1_LDFLAGS        = -PGINSTRUMENT -incremental:no
     7     PASS2_LDFLAGS        = -PGOPTIMIZE   -incremental:no
     8     fdo_make_clean_pass2 = rm ${baseexe}
     9     fdo_make_pass2       = specmake build FDO=PASS2
On line 8, the default cleaning action (from Example 3) is changed to remove only the actual executable. Under the usual rules of GNU make, you might expect that would be sufficient to cause build #2 to do only the link step. In this case, it is not, because by default the tools generate specmake --always-make. Line 9 above overrides that default.
$ cat fdoExample4.sh
runcpu --config=fdoExample4 --fake \
   | grep -e readline.f90          \
          -e Train                 \
          -e '^rm'                 \
          -e '^specmake.*clean'    \
          -e '^specmake.*build'    \
   | cat -n
The runcpu command above is sent to grep to pick lines of interest, which are
numbered by cat.
In the output, lines 1-5 show a typical clean action; much less is removed on line 10. Compare line 6 to
line 11 to see the differences in specmake build options.
$ ./fdoExample4.sh
     1  specmake -n --output-sync clean
     2  rm -rf *.o  pscyee.out
     3  rm -rf fotonik3d_r
     4  rm -rf fotonik3d_r.exe
     5  rm -rf core
     6  specmake -n --output-sync --always-make build FDO=PASS1
     7  pgf90 -c -o readline.o -I. readline.f90
     8  rm -rf options.tmpout
     9  Training 549.fotonik3d_r with the train workload
    10  rm fotonik3d_r
    11  specmake build FDO=PASS2
$  (Notes about examples)
Adding FDO steps: You can add more steps.
For example, you could:
$ cat -n fdoExample5.cfg
     1  action                = build
     2  command_add_redirect  = yes
     3  runlist               = 641.leela_s
     4  tune                  = peak
     5  default=peak:
     6      profdir           = /tmp/feedback/profiles
     7      big_profile       = ${profdir}/${benchnum}.aggregated.profile
     8      clean_profile     = mkdir -p ${profdir}; rm -f ${big_profile}
     9      append_to_profile = cat this.prof >> ${big_profile}
    10      #
    11      fdo_pre0          = ${clean_profile}
    12      #
    13      PASS1_OPTIMIZE    = --collect:paths
    14      fdo_run1          = ${command}               # profile program paths
    15      fdo_post1         = ${append_to_profile}
    16      #
    17      PASS2_OPTIMIZE    = --collect:dcache
    18      fdo_run2          = ${command}               # profile data patterns
    19      fdo_post2         = ${append_to_profile}
    20      #
    21      fdo_pre_make3     = mv ${big_profile} ./profile.in
    22      PASS3_OPTIMIZE    = --apply:paths,dcache
    23      fdo_post_make3    = postopt --instrument:icache
    24      fdo_run3          = ${command}               # profile icache packing
    25      fdo_post3         = postopt --fixup:icache
The script below picks out lines of interest using grep.
$ cat fdoExample5.sh
runcpu --fake --config=fdoExample5 \
  | grep -e '^mkdir'               \
         -e FullBoard.cpp          \
         -e Train                  \
         -e this.prof              \
         -e ^mv                    \
         -e '^postopt'             \
  | cat -n
The three instances of PASSn_OPTIMIZE are carried out on lines 2, 5, and 9 below.
Various manipulations of the profile files are shown on lines 1, 4, 7, and 8.
$ ./fdoExample5.sh
     1  mkdir -p /tmp/feedback/profiles; rm -f /tmp/feedback/profiles/641.aggregated.profile
     2  CC -c -o FullBoard.o -DSPEC -DSPEC_CPU -DNDEBUG -I.      --collect:paths         FullBoard.cpp
     3  Training 641.leela_s with the train workload
     4  cat this.prof >> /tmp/feedback/profiles/641.aggregated.profile
     5  CC -c -o FullBoard.o -DSPEC -DSPEC_CPU -DNDEBUG -I.      --collect:dcache         FullBoard.cpp
     6  Training 641.leela_s with the train workload
     7  cat this.prof >> /tmp/feedback/profiles/641.aggregated.profile
     8  mv /tmp/feedback/profiles/641.aggregated.profile ./profile.in
     9  CC -c -o FullBoard.o -DSPEC -DSPEC_CPU -DNDEBUG -I.      --apply:paths,dcache         FullBoard.cpp
    10  postopt --instrument:icache
    11  Training 641.leela_s with the train workload
    12  postopt --fixup:icache
$ (Notes about examples)
If you use PASSn or fdo_ then, by default, FDO is used for peak builds. The config file option feedback provides an additional control, an "on/off" switch that can be applied by the usual rules of precedence.
A common usage model is to enable feedback everywhere, then turn it off selectively:
$ cat -n fdoExample6.cfg
  1  action         = build
  2  label          = miriam
  3  runlist        = 503.bwaves_r,519.lbm_r,549.fotonik3d_r
  4  tune           = base,peak
  5  fprate:
  6     fdo_post1   = /opt/merge_feedback
  7  519.lbm_r:
  8     feedback    = no
$ cat fdoExample6.sh
runcpu --fake --config=fdoExample6 | grep -e Building -e ^/opt
$ ./fdoExample6.sh
  Building 503.bwaves_r base miriam: (build_base_miriam.0000) [2017-02-23 22:31:30]
  Building 519.lbm_r base miriam: (build_base_miriam.0000) [2017-02-23 22:31:31]
  Building 549.fotonik3d_r base miriam: (build_base_miriam.0000) [2017-02-23 22:31:32]
  Building 503.bwaves_r peak miriam: (build_peak_miriam.0000) [2017-02-23 22:31:33]
/opt/merge_feedback
  Building 519.lbm_r peak miriam: (build_peak_miriam.0000) [2017-02-23 22:31:35]
  Building 549.fotonik3d_r peak miriam: (build_peak_miriam.0000) [2017-02-23 22:31:35]
/opt/merge_feedback
$ (Notes about examples)
Lines 5-6 turn feedback on for SPECrate floating point benchmarks. Neverthelss, 519.lbm_r peak does not use FDO: line 8 takes priority over line 6 by the usual rules of precedence. Feedback is not used for base, because the tools are aware of the rule that disallows it.
If you use the runcpu option --feedback or
its opposite, --nofeedback, all peak benchmarks are affected.
New with CPU 2017:
The command line wins unconditionally over the config file.
The example below uses the same config file as the previous example.
$ cat fdoExample7.sh
echo build with --feedback
runcpu --fake --config=fdoExample6 --feedback | grep -e Building -e '^/opt'
echo
echo build with --nofeedback
runcpu --fake --config=fdoExample6 --nofeedback | grep -e Building -e '^/opt'
$ ./fdoExample7.sh
build with --feedback
  Building 503.bwaves_r base miriam: (build_base_miriam.0000) [2017-02-23 22:37:07]
  Building 519.lbm_r base miriam: (build_base_miriam.0000) [2017-02-23 22:37:08]
  Building 549.fotonik3d_r base miriam: (build_base_miriam.0000) [2017-02-23 22:37:09]
  Building 503.bwaves_r peak miriam: (build_peak_miriam.0000) [2017-02-23 22:37:10]
/opt/merge_feedback
  Building 519.lbm_r peak miriam: (build_peak_miriam.0000) [2017-02-23 22:37:11]
/opt/merge_feedback
  Building 549.fotonik3d_r peak miriam: (build_peak_miriam.0000) [2017-02-23 22:37:12]
/opt/merge_feedback

build with --nofeedback
  Building 503.bwaves_r base miriam: (build_base_miriam.0000) [2017-02-23 22:37:16]
  Building 519.lbm_r base miriam: (build_base_miriam.0000) [2017-02-23 22:37:17]
  Building 549.fotonik3d_r base miriam: (build_base_miriam.0000) [2017-02-23 22:37:18]
  Building 503.bwaves_r peak miriam: (build_peak_miriam.0000) [2017-02-23 22:37:19]
  Building 519.lbm_r peak miriam: (build_peak_miriam.0000) [2017-02-23 22:37:20]
  Building 549.fotonik3d_r peak miriam: (build_peak_miriam.0000) [2017-02-23 22:37:20]
$ (Notes about examples)
In the run with --feedback, all peak benchmarks use feedback. Base does not, because the tools are aware of the
rule.
The run with --nofeedback does not use FDO for any benchmarks.
This section introduces the config file preprocessor with a simple example.
Preprocessor
Example 1: Using %if and %define
$ cat -n preprocessor_example1.cfg
 1  500.perlbench_r,600.perlbench_s:
 2  %if %{chip} eq "sparc"
 3      PORTABILITY    = -DSPEC_SOLARIS_SPARC
 4  %elif %{chip} eq "x86"
 5  %   if %{bits} == 32
 6  %      define suffix IA32
 7  %   else
 8  %      define suffix X64
 9  %   endif
10      PORTABILITY    = -DSPEC_SOLARIS_%{suffix}
11  %endif
$ (Notes about examples)
|
Lines that start with percent (%) in column 1 are preprocessor directives. You can create macros (brief abbreviations for longer constructs) using %define, as shown on in lines 6 and 8 of this example. You can use them with %{macro_name} - lines 2, 4, 5, and 10. You can test them with %if - lines 2 and 5.
Two macros are assumed to already be set before arriving here:
|
|
The preprocessor is automatically run whenever you use runcpu. Or, you can run it separately, as configpp. Macros can be set on the command line, using --define (or -S). Here is the effect of various settings with the above config file:
$ configpp -c preprocessor_example1.cfg --define chip=sparc | grep -e perlbench -e PORT
500.perlbench_r,600.perlbench_s:
    PORTABILITY    = -DSPEC_SOLARIS_SPARC

$ configpp -c preprocessor_example1.cfg --define chip=x86 | grep -e perlbench -e PORT
500.perlbench_r,600.perlbench_s:
    PORTABILITY    = -DSPEC_SOLARIS_X64

$ configpp -c preprocessor_example1.cfg -S chip=x86 -S bits=32 | grep -e perlbench -e PORT
500.perlbench_r,600.perlbench_s:
    PORTABILITY    = -DSPEC_SOLARIS_IA32
|
|
All preprocessor directives begin with the percent sign (%) in column 1. You can -- and probably should -- use indenting, but keep the percent sign on the far left. Any amount of spaces or tabs may separate the percent from the directive. The following are okay:
%define foo
%    define bar
%		undef hello
The following are not okay:
 %define foo           Space in the first column
        %define foo    Tab in the first column
#define foo            Use % in column 1, not #
The macro preprocessor does NOT follow the same quoting rules described elsewhere for config files. In particular, you may not use line continuation, line appending, or block quotes. You may have a value of arbitrary length, but in the interests of config file readability and maintainability, please keep them relatively short.
The usual rules for comments DO apply: anything after # will be ignored.
The next 3 sections describe how to define, undefine, or redefine macros.
Macro names may only be composed of alphanumeric characters, underscores, and hyphens, and they ARE case-sensitive. To define a macro in a config file, use:
%define macro_name value
Do not put quote marks (or other punctuation) around the macro-name.
Often, quotes are not needed for the value; however, there is an important exception: if the value contains perl operators that you do not want treated as operators, then you should quote it.
Macros can be defined on the command line, using the --define switch, or (equivalently) -S.
$ runcpu --define mymacro=something
$ runcpu -S mymacro=something
Macros set on the command-line are defined first. Therefore, if a value is set both on the command line and in a config file, the config file will override the value on the command line. If you want the command line to "win", the config file should check whether it has already been defined using %ifdef or %if defined.
Expressions may be used when defining macros. Because they are more frequently used with %if, they are documented in that section.
Macros can be undefined in two ways:
%define foo bar
# Now the macro called 'foo' has the value 'bar'
%undef foo
# Now it doesn't
Note that no quoting is necessary when specifying the name of the macro to undefine.
If you define a macro more than once, warnings will be printed.
|
To avoid the warnings, you can check first, and only define your macro if has not previously been defined |
%if !defined %{mypath}
%   define mypath "/usr/bin/"
%endif
|
|
Or, you can undefine it and then define it again. |
%if defined %{mypath}
%   undef mypath
%   define mypath "/usr/bin/"
%endif
|
To use the value of a macro, write
%{foo}
in the place where you'd like it to appear.
Notice that the %{ and } are always required when using macros.
The only time they are not required is when defining and undefining them (%define and
%undef).
|
A macro that has not been defined will not be substituted.
On the right, %{Type} is substituted
|
$ cat noSuchMacro.cfg
%define Type -fast
CXXOPTIMIZE = %{Type}
COPTIMIZE   = %{Typo}
$ configpp -c noSuchMacro.cfg | grep OPTIMIZE
CXXOPTIMIZE = -fast
COPTIMIZE   = %{Typo}
$ (Notes about examples) |
A macro that has been defined, but not given a value,
as shown on the right. |
$ cat macroDefinedButNoValue.cfg
%define baz
%ifdef %{baz}
%   info baz is defined
%   info In text context it is: "%{baz}".
%endif
%if %{baz}
%   info In logical context, it behaves as true.
%endif
%if %{baz} + 3  == 4
%   info In numeric context, it behaves as 1.
%endif
$ configpp --config=macroDefinedButNoValue | grep INFO
  INFO: baz is defined
  INFO: In text context it is: "".
  INFO: In logical context, it behaves as true.
  INFO: In numeric context, it behaves as 1.
$  (Notes about examples)
|
|
Caution: Having no value is not the same as having an empty string as the value. If you set an empty string, it will be evaluated by the usual Perl rules, where the empty string is false. |
$ cat macroEmptyValue.cfg
%define baz ""
%ifdef %{baz}
%   info baz is defined
%   info In text context it is: "%{baz}".
%endif
%if ! %{baz}
%   info In logical context, it behaves as false
%endif
%if %{baz} + 3  == 3
%   info In numeric context, it behaves as 0
%endif
$ configpp --config=macroEmptyValue | grep INFO
  INFO: baz is defined
  INFO: In text context it is: "".
  INFO: In logical context, it behaves as false
  INFO: In numeric context, it behaves as 0
$ (Notes about examples)
|
|
You can have multi-layered references, as in this silly example: |
$ cat silly_macros.cfg
%define foo       Hello_
%define bar       baz
%define foobar    Huh?
%define foobaz    What?
%define Hello_baz Please don't do this

OPTIMIZE  = %{foo}
COPTIMIZE = %{foo%{bar}}
FOPTIMIZE = %{%{foo}%{bar}}
$ configpp -c silly_macros.cfg | grep OPTIMIZE
OPTIMIZE  = Hello_
COPTIMIZE = What?
FOPTIMIZE = Please don't do this
$ (Notes about examples)
|
Conditionals provide the ability to include and exclude entire sections of text based on macros and their values.
The %ifdef conditional provides a way to determine whether or not a particular macro has been defined. If the named macro has been defined, the conditional is true, and the text to the matching %endif is included in the text of the config file as evaluated by runcpu.
The matching %endif may not necessarily be the next %endif because conditionals may be nested.
Note that:
%ifdef %{foo} is exactly equivalent to
%if defined(%{foo})
In the example on the right, only the text that depends on %{foo} gets included. |
$ cat xyzzy.cfg
%define foo
%ifdef %{foo}
   OPTIMIZE = This text will be included
%endif
%ifdef %{bar}
   FOPTIMIZE = This text will not be included
%endif
$ configpp --config=xyzzy | grep include
   OPTIMIZE = This text will be included
$ |
The %ifndef conditional is the converse of %ifdef; If the named macro has not been defined, the conditional is true, and the text to the matching %endif is included in the text of the config file as evaluated by runcpu.
Note that:
%ifndef %{foo} is exactly equivalent to
%if !defined(%{foo})
Checking whether or not a macro is defined is quite useful, but it's just a subset of the more general conditional facility available. This general form is
%if expression
...
%endif
The expression is evaluated using a subset of the Perl interpreter, so the possibilities for testing values are fairly broad.
You can test multiple definitions using defined() plus the logical operators:
|
%if defined(%{foo}) && !defined(%{bar}) || %{baz} == 3

%if defined(%{foo}) and !defined(%{bar}) or %{baz} == 3
|
To compare versus a string value, you must supply quotes |
%if %{foo} eq 'Hello, Dave.'
|
You may perform basic math on macro values |
%if %{foo} * 2004 > 3737
|
You can do basic regular expression matching |
%if !defined(%{chip}) || %{chip} !~ m/(sparc|x86)/
%   error Please use --define chip=sparc or --define chip=x86
%endif
|
Caution: be aware of behavior differences between %ifdef / %if defined() vs. %if Conditional expressions are evaluated using perl's rules for Truth and Falsehood. Therefore 0 (zero) is defined, and is false |
$ cat test_define.cfg
%ifdef %{a}
   OPTIMIZE = -a
%endif
%if defined(%{b})
   LDOPTIMIZE = -b
%endif
%if %{c}
   COPTIMIZE = -c
%endif
$ configpp --config=test_define -S a=1 -S b=1 -S c=1 | grep OPT
   OPTIMIZE = -a
   LDOPTIMIZE = -b
   COPTIMIZE = -c
$ configpp --config=test_define -S a=0 -S b=0 -S c=0 | grep OPT
   OPTIMIZE = -a
LDOPTIMIZE = -b |
| You can use functions such as substr and index | $ cat pathnote.cfg
%define pathnote substr("%{ENV_PATH}",0,index("%{ENV_PATH}",":"))
%info my path begins %{pathnote}
$ export PATH=/usr/local/something/something:$PATH
$ configpp --config=pathnote | grep INFO
INFO: my path begins /usr/local/something/something
$ (Notes about examples)
|
Expressions are limited to the Perl :base_core and :base_math bundles, with
the ability to dereference and modify variables disallowed.
If you want even more detail, see the source code for the eval_pp_conditional subroutine in
config.pl, and see Perl's Opcode
documentation.
| %else does what you think it does. | $ cat tmp.cfg
%ifdef %{foo}
OPTIMIZE = --foo
%else
OPTIMIZE = --nofoo
%endif
$ configpp --config=tmp | grep OPTIM
OPTIMIZE = --nofoo
$
|
%elif is an "else if" construct. You may have as many of these as you'd like. |
$ cat tmp.cfg
%define foo Hello!
%if !defined(%{foo})
%   info This text will not be included
%elif defined(%{bar})
%   info This text won't be included either
%elif '%{foo}' eq 'Hello!'
%   info This text WILL be included
%else
%   info Alas, the else here is left out as well.
%endif
$ configpp --config=tmp | grep INFO
  INFO: This text WILL be included
$  (Notes about examples)
|
Here is an example that uses expressions to help assign jobs to processors.
Hidekatsu would like to pick the number of copies, or the number of threads, based on how many cores are
available:
|
Preprocessor
Example 2: Using expressions to bind processes
$ cat hidekatsu.cfg
include: TurboBlaster9000.inc

503.bwaves_r=peak:
   copies      = %{Use1PerCore}
557.xz_r=peak:
   copies      = %{Use2PerCore}

603.bwaves_s=peak:
   threads     = %{Use3PerCore}
657.xz_s=peak:
   threads     = %{Use2PerCore}
$
|
Notice that the config file begins by including TurboBlaster9000.inc, which is shown next |
$ cat -n TurboBlaster9000.inc
  1  # TurboBlaster 9000 has:
  2  #   1 to 4    chips per system
  3  #   2         cores per chip
  4  #   3         hardware threads (virtual CPUs) per core
  5
  6  %ifndef %{chips}
  7  %   error Please say runcpu --define chip=N
  8  %endif
  9
 10  %define   cores        2 * %{chips}
 11
 12  %define   Use1PerCore  1 * %{cores}
 13  %define   Use2PerCore  2 * %{cores}
 14  %define   Use3PerCore  3 * %{cores}
 15
 16  # Use 'bind' to place jobs on alternating chips
 17  # and alternating cores.
 18
 19         # core 0           core 1
 20  %if %{chips} == 1
 21     bind=\
 22           0                3          \
 23           1                4          \
 24           2                5
 25  %elif %{chips} == 2
 26     bind=\
 27           0  6             3  9       \
 28           1  7             4 10       \
 29           2  8             5 11
 30  %elif %{chips} == 3
 31     bind=\
 32           0  6 12          3  9 15    \
 33           1  7 13          4 10 16    \
 34           2  8 14          5 11 17
 35  %elif %{chips} == 4
 36     bind=\
 37           0  6 12 18       3  9 15 21 \
 38           1  7 13 19       4 10 16 22 \
 39           2  8 14 20       5 11 17 23
 40  %endif
|
Lines 1-4: Comments describe the (fictional) system. |
| Lines 6-8: We expect to be told the number of chips; if not, exit with an error. | |
| Line 10: Calculate how many cores are available. | |
| Lines 12-14: Above, benchmarks made requests for numbers of copies or threads, such as %{Use2PerCore}. Translate such requests into system totals. | |
| Lines 16-40: A bind statement is constructed to spread the work. (We assume here that virtual CPUs are numbered sequentially: chip 0 has CPUs 0 to 5, its first core has 0,1,2; and so forth.) | |
Lines 27-29: For example, a system with 2 chips has 4 cores and 12 virtual CPUs. Copies are dispatched such that:
|
If you would like to see the preprocessed config file without actually running it, you can use 'configpp', as shown below. As expected, the number of copies or threads varies with the number of chips.
$ cat hidekatsu.cfg
include: TurboBlaster9000.inc

503.bwaves_r=peak:
   copies      = %{Use1PerCore}
557.xz_r=peak:
   copies      = %{Use2PerCore}

603.bwaves_s=peak:
   threads     = %{Use3PerCore}
657.xz_s=peak:
   threads     = %{Use2PerCore}
$
|
$ configpp -c hidekatsu \
  --output=one.out \
  --define chips=1

  ...

$ tail -17 one.out.cfg
   bind=\
    0      3   \
    1      4   \
    2      5

503.bwaves_r=peak:
   copies   = 2
557.xz_r=peak:
   copies   = 4

603.bwaves_s=peak:
   threads  = 6
657.xz_s=peak:
   threads  = 4
|
$ configpp -c hidekatsu \
  --output=two.out \
  --define chips=2

   ...

$ tail -17 two.out.cfg
   bind=\
    0  6    3  9  \
    1  7    4 10  \
    2  8    5 11

503.bwaves_r=peak:
   copies   = 4
557.xz_r=peak:
   copies   = 8

603.bwaves_s=peak:
   threads  = 12
657.xz_s=peak:
   threads  = 8
|
$ configpp -c hidekatsu \
  --output=four.out \
  --define chips=4

  ...

$ tail -17 four.out.cfg
   bind=\
   0  6 12 18   3  9 15 21 \
   1  7 13 19   4 10 16 22 \
   2  8 14 20   5 11 17 23

503.bwaves_r=peak:
   copies   = 8
557.xz_r=peak:
   copies   = 16

603.bwaves_s=peak:
   threads  = 24
657.xz_s=peak:
   threads  = 16
|
It's often helpful to be able to warn or exit on certain conditions. Perhaps there's a macro that must be set to a particular value, or maybe it's just very highly recommended.
When the preprocessor encounters a %warning directive, it prints the text following to stdout and the current log file, along with its location within the file being read, and continues on.
$ cat warning.cfg
%if !defined(%{somewhat_important_macro})
%   warning You have not defined somewhat_important_macro!
%endif
$
$ cat warning.sh
configpp --config=warning | grep -C2 WARNING
$
$ ./warning.sh

***
  WARNING: You have not defined somewhat_important_macro!
           (From line 2 of
           /cpu2017/rc4/config/warning.cfg.)
$ (Notes about examples)
Like %warning, %error logs an error to stderr and the log file. Unlike %warning, though, it then stops the run.
Consider a slightly modified version of the previous example:
$ cat error.cfg
%if !defined(%{REALLY_important_macro})
%   error You have not defined REALLY_important_macro!
%endif
$
$ cat error.sh
configpp --config=error > /tmp/out
echo runcpu exit code: $?
grep -C2 ERROR /tmp/out
$ ./error.sh
runcpu exit code: 1

************************************************************************
  ERROR: You have not defined REALLY_important_macro!
         (From line 2 of
         /Users/jhenning/spec/cpu2017/rc4/config/error.cfg.)
$ (Notes about examples)
Unlike a warning, the error will be close to the last thing output. As you can see from the output of echo $? above, runcpu exited with an error code 1.
The %info directive prints a message preceded by the word INFO:. For example:
$ cat -n info.cfg
   1  %if !defined(%{chip}) || %{chip} !~ m/(sparc|x86)/
   2  %   error Please use --define chip=sparc or --define chip=x86
   3  %endif
   4
   5  %if  %{chip} eq "sparc"
   6  %   define default_build_ncpus 64
   7  %elif %{chip} eq "x86"
   8  %   define default_build_ncpus 20
   9  %endif
  10  %ifndef   %{build_ncpus}
  11  %   define  build_ncpus   %{default_build_ncpus}
  12  %endif
  13
  14  %info Preprocessor selections:
  15  %info    .    build_ncpus      %{build_ncpus}
  16  %info    .    chip             %{chip}
  17
  18  makeflags = --jobs=%{build_ncpus}
$ configpp -c info --define chip=sparc | grep -e make -e INFO
  INFO: Preprocessor selections:
  INFO: .    build_ncpus      64
  INFO: .    chip             sparc
makeflags = --jobs=64
$ (Notes about examples)
Note in the example above:
The %info directive is new with CPU 2017.
The %dumpmacros directive prints the values of all macros currently defined at the point where it appears.
If you add the argument all to the directive, it will include all your environment macros.
Each macro value is preceded by the word 'DBG:'.
$ cat -n dumpmacros.cfg
  1  %if !defined(%{chip}) || %{chip} !~ m/(sparc|x86)/
  2  %   error Please use --define chip=sparc or --define chip=x86
  3  %endif
  4
  5  %if  %{chip} eq "sparc"
  6  %   define default_build_ncpus 64
  7  %elif %{chip} eq "x86"
  8  %   define default_build_ncpus 20
  9  %endif
 10  %ifndef   %{build_ncpus}
 11  %   define  build_ncpus   %{default_build_ncpus}
 12  %endif
 13
 14  %dumpmacros
$
$ configpp -c dumpmacros --define chip=sparc | grep -e DBG
  DBG: build_ncpus: '%{default_build_ncpus}'
  DBG: chip: 'sparc'
  DBG: default_build_ncpus: '64'
  DBG: runcpu: 'configpp -c dumpmacros --define chip=sparc'
  .
  .
  .
$
The %dumpmacros directive is new with CPU 2017.
Some useful macros are predefined, as shown in the table below.
New with CPU 2017: The config file preprocessor can do environment variable substitution. Environment variables to be substituted use a percent sign and curly brackets, and the name is prefixed with the string "ENV_", as %{ENV_variable_name}.
| %{configfile} | The name of the config file specified on the command line (possibly not including directory path) |
|---|---|
| %{endian} | Indicator of endian characteristics, for example '12345678' indicating a little-endian system |
| %{hostname} | System Under Test name |
| %{runcpu} | Your original runcpu command |
| %{top_config_file} | The name of the top-level config file (likely the same as %{configfile}, one may have the full path and the other not) |
| %{current_config_file} | The name of the config file currently being read (same as %{configfile} unless reading an included config file) |
| %{parent_config_file} | The name of the config file that included the config file currently being read (empty for the top-level config file) |
| %{config_nesting_level} | The number of nested includes in effect (0 for the top-level config file) |
| %{ENV_variable} | Any of your environment variables.
$ cat printPath.cfg
%info %{ENV_PATH}
$ configpp --config=printPath | grep INFO:
  INFO: /spec/cpu2017/rc4/bin:/usr/local/bin:/bin/:/usr/
$  (Notes about examples)
|
| For a complete list, see dumpmacros. | |
You can automatically bring an output_root into your config file using %{ENV_GO} and navigate around it, as shown in the example for the ogo utility.
Notice that %{ENV_variable_name} brings an environment variable into your config file; what if you want to push it back out to affect other things? In that case, you will also need the feature preenv, which causes runcpu to re-invoke itself with your requested variable in the environment.
For example, you could set up paths for your compiler using something like this:
$ cat -n adjustEnv.cfg
     1  action       = build
     2  output_root  = /tmp
     3  rebuild      = 1
     4  runlist      = 519.lbm_r
     5  verbose      = 99
     6
     7  %define fivetop  %{ENV_HOME}/work/compilers/gcc-5.3.0
     8  %define eighttop %{ENV_HOME}/work/compilers/gcc-8.1.0
     9
    10  %ifdef %{wantGccV8}
    11     preENV_PATH            = %{eighttop}/bin:%{ENV_PATH}
    12     preENV_LD_LIBRARY_PATH = %{eighttop}/lib64:%{ENV_LD_LIBRARY_PATH}
    13  % else
    14     preENV_PATH            = %{fivetop}/bin:%{ENV_PATH}
    15     preENV_LD_LIBRARY_PATH = %{fivetop}/lib64:%{ENV_LD_LIBRARY_PATH}
    16  %endif
    17
    18  default:
    19  CC                = gcc
    20  CC_VERSION_OPTION = -v
The config file above builds a single benchmark, 519.lbm_r, using the local paths for GCC 5.3 or 8.1. Notice that in both cases, the desired path is added to the existing path: for example, on line 12, the right side accesses the existing setting via %{ENV_LD_LIBRARY_PATH} and the left side applies it to the build, via preENV_LD_LIBRARY_PATH. On line 5, the config file sets verbose=99, so that runcpu will print all possible detail and we will be able to confirm the adjusted variables.
Below, the config file is used with and without --define wantGccV8, and the paths are set as desired:
$ cat adjustEnv.sh
export LD_LIBRARY_PATH=my:old:path
runcpu  -c adjustEnv                     | grep -e 'Setting LD_LIBRARY_PATH' -e 'gcc version'
runcpu  -c adjustEnv --define wantGccV8  | grep -e 'Setting LD_LIBRARY_PATH' -e 'gcc version'
$ ./adjustEnv.sh
Setting LD_LIBRARY_PATH = "/Users/jhenning/work/compilers/gcc-5.3.0/lib64:"
gcc version 5.3.0 (JLH  04-Dec-2016)
gcc version 5.3.0 (JLH  04-Dec-2016)
Setting LD_LIBRARY_PATH = "/Users/jhenning/work/compilers/gcc-8.1.0/lib64:"
gcc version 8.1.0 (jhenning-02-May-2018)
gcc version 8.1.0 (jhenning-02-May-2018)
$  (Notes about examples)
This section describes how the location and contents of several kinds of output files are influenced by your config file.
It was mentioned above that the HASH section of the config file is written automatically by the tools. Each time your config file is updated, a backup copy is made. Thus your config directory may soon come to look like this:
$ cd $SPEC/config
$ ls tune.cfg*
tune.cfg                        tune.cfg.2017-02-05T124831      tune.cfg.2017-02-05T125733
tune.cfg.2017-02-05T120242      tune.cfg.2017-02-05T125557      tune.cfg.2017-02-05T125738
tune.cfg.2017-02-05T122021      tune.cfg.2017-02-05T125603      tune.cfg.2017-02-05T125744
tune.cfg.2017-02-05T122026      tune.cfg.2017-02-05T125608      tune.cfg.2017-02-05T125749
tune.cfg.2017-02-05T124215      tune.cfg.2017-02-05T125614      tune.cfg.2017-02-05T125756
tune.cfg.2017-02-05T124222      tune.cfg.2017-02-05T125620      tune.cfg.2017-02-05T125802
tune.cfg.2017-02-05T124728      tune.cfg.2017-02-05T125626      tune.cfg.2017-02-05T125807
tune.cfg.2017-02-05T124739      tune.cfg.2017-02-05T125632      tune.cfg.2017-02-05T125812
tune.cfg.2017-02-05T124821      tune.cfg.2017-02-05T125727
$  (Notes about examples)
If this feels like too much clutter, you can disable the backup mechanism, as described under backup_config. Note that doing so may leave you with a risk of losing the config file in case of a filesystem overflow or system crash. A better idea may be to periodically remove just portions of the clutter, with selective removal of older version; or sweep them to a wastebasket every now and then:
$ cd $SPEC/config
$ mkdir wastebasket
$ mv *cfg.2017* wastebasket/
$
$SPEC/result (Unix) or %SPEC%\result (Windows) contains reports and log files. When you are doing a build, you will probably find that you want to pay close attention to the log files such as CPU2017.001.log. Depending on the verbosity level that you have selected, it will contain detailed information about how your build went.
The CPU 2017 tool suite provides for varying amounts of output about its actions during a run. These levels range from the bare minimum of output (level 0) to copious streams of information that are probably useful only to tools developers (level 99). Selecting one output level gives you the output from all lower levels, which may cause you to wade through more output than you might like.
When you are trying to find your way through a log file, you will probably find these (case-sensitive) search strings useful:
| runcpu: | The runcpu command for this log. |
|---|---|
| Running | Printed at the top of a run of a benchmark. |
| # | Printed at the top of a run of a benchmark for runs with multiple iterations. Useful for finding the ref workloads in reportable runs. |
| runtime | Printed at the end of a benchmark run. |
| Copy | Times for individual copies in a SPECrate run. |
| Building | Printed at the beginning of a benchmark compile. |
| Elapsed compile | Printed at the end of a benchmark compile. |
There are also temporary debug logs, such as CPU2017.001.log.debug. A debug log contains very detailed debugging output from the SPEC tools, as if --verbose 99 had been specified.
For a successful run, the debug log will be removed automatically, unless you specify "--keeptmp" on the command line, or "keeptmp=yes" in your config file.
For a failed run, the debug log is kept. The debug log may seem overwhelmingly wordy, repetitive, detailed, redundant, repetitive, and long-winded, and therefore useless. Suggestion: after a failure, try looking in the regular log first, which has a default verbosity level of 5. If your regular log doesn't have as much detail as you wish, then you can examine the additional detail in the debug log.
If you file a support request, you may be asked to send in the debug log.
The 'level' referred to in the table below is selected either in the config file verbose option or in the runcpu command as in 'runcpu --verbose n'.
Levels higher than 99 are special; they are always output to your log file. You can also see them on the screen if you set verbosity to the specified level minus 100. For example, the default log level is 5. This means that on your screen you will get messages at levels 0 through 5, and 100 through 105. In your log file, you'll find the same messages, plus the messages at levels 106 through 199.
| Level | What you get |
| 0 | Basic status information, and most errors. These messages can not be turned off. |
| 1 | List of the benchmarks which will be acted upon. |
| 2 | A list of possible output formats, as well as notification when beginning and ending each phase of operation (build, setup, run, reporting). |
| 3 | A list of each action performed during each phase of operation (e.g. "Building 176.gcc", "Setting up 253.perlbmk") |
| 4 | Notification of benchmarks excluded |
| 5 (default) | Notification if a benchmark somehow was built but nevertheless is not executable. |
| 6 | Time spent doing automatic flag reporting. |
| 7 | Actions to update SPEC-supplied flags files. |
| 10 | Information on basepeak operation. |
| 12 | Errors during discovery of benchmarks and output formats. |
| 15 | Information about certain updates to stored config files |
| 24 | Notification of additions to and replacements in the list of benchmarks. |
| 30 | A list of options which are included in the hash of options used to determine whether or not a given binary needs to be recompiled. |
| 35 | A list of key=value pairs that can be used in command and notes substitutions, and results of env_var settings. |
| 40 | A list of 'submit' commands for each benchmark.
Note: If you would like to see all of the submit commands for every copy and every benchmark invocation, with all your variables (such as $BIND) resolved, try runcpu --verbose=40 --fake, or go to the run directory and use specinvoke -n (dry run). |
| 70 | Information on selection of median results. |
| 89 | Progress comparing run directory checksum for executables. |
| 90 | Time required for various internal functions in the tools. |
| 95, 96, 97, 98 | Flag parsing progress during flag reporting (progressively more detail) |
| 99 | Gruesome detail of comparing hashes of files being copied during run directory setup. |
| Messages at the following levels will always appear in your log files | |
| 100 | Various config file errors, such as bad preprocessor directives, bad placement of certain options, illegal characters... |
| 102 | Information about output formats that could not be loaded. |
| 103 | A tally of successes and failures during the run broken down by benchmark. |
| 106 | A list of runtime and calculated ratio for each benchmark run. |
| 107 | Dividers to visually block each phase of the run. |
| 110 | Elapsed time for each portion of a workload (if an executable is invoked more than once). |
| 120 | Messages about which commands are being issued for which benchmarks. |
| 125 | A listing of each individual child processes' start, end, and elapsed times. |
| 130 | A nice header with the time of the runcpu invocation and the command line used. Information about what happened with your sysinfo program |
| 140 | General information about the settings for the current run. |
| 145 | Messages about file comparisons. |
| 150 | List of commands that will be run, and details about the settings used for comparing output files. Also the contents of the makefile written. |
| 155 | Start, end, and elapsed times for benchmark run. |
| 160 | Start, end, and elapsed times for benchmark compilation. |
| 180 | stdout and stderr from commands run |
| 190 | Start and stop of delays |
| 191 | Notification of command line used to run specinvoke. |
This section demonstrates how to find various portions of a log file using an example build with feedback-directed optimization (FDO). See the section Using Feedback for more information on how to enable FDO.
FDO typically requires two compiles. The first creates an executable image with instrumentation. You run the program with a "training" workload, the instrumentation observes it, and a profile is written. The second compile then uses the profile to improve optimization. SPEC CPU makes all of this relatively easy. Here's a config file that builds 519.lbm_r with FDO:
$ cat mat.cfg
iterations            = 1
label                 = blue271
runlist               = 519.lbm_r
size                  = test
teeout                = yes
tune                  = peak
default:
   CC                 = gcc
   CC_VERSION_OPTION  = -v
fprate=peak:
   OPTIMIZE           = -O2
   PASS1_OPTIMIZE     = -fprofile-generate
   PASS2_OPTIMIZE     = -fprofile-use

$ cat mat.sh
runcpu --config=mat | grep -e Training -e lbm.c -e .log
$ ./mat.sh
gcc -c -o lbm.o -DSPEC -DSPEC_CPU -DNDEBUG -DSPEC_AUTO_SUPPRESS_OPENMP -O2 -fprofile-generate lbm.c
Training 519.lbm_r with the train workload
gcc -c -o lbm.o -DSPEC -DSPEC_CPU -DNDEBUG -DSPEC_AUTO_SUPPRESS_OPENMP -O2 -fprofile-use      lbm.c
The log for this run is in /vampir/cpu2017/rc4/result/CPU2017.838.log
$  (Notes about examples)
The PASSn_OPTIMIZE lines cause FDO to happen. The grep picks out a few lines of interest: compile using -fprofile-generate; run the training workload; recompile with -fprofile-use.
For much more detail, you can examine the log file. In this section, the log file from the above command is used (with light editing for readability, e.g. adjusted white space). Useful search strings are bolded.
'runcpu:' Search for runcpu: to verify that we have the correct log file:
$ go result                 (go)
/vampir/cpu2017/rc4/result
$ grep runcpu: CPU2017.837.log
runcpu: runcpu --config=mat
$
Yes, this looks like the right log. Bring it up in an editor.
'Building' If you search for Building, you will find what was written to Makefile.deps (dependencies) and Makefile.spec (the actual Makefile). In this case, there are no dependencies.
  Building 519.lbm_r peak blue271: (build_peak_blue271.0000) [2017-02-14 05:26:09]
Wrote to makefile
'/vampir/cpu2017/rc4/benchspec/CPU/519.lbm_r/build/build_peak_blue271.0000/Makefile.deps':


# End dependencies
# These are the build dependencies
Wrote to makefile
'/vampir/cpu2017/rc4/benchspec/CPU/519.lbm_r/build/build_peak_blue271.0000/Makefile.spec':
TUNE=peak
LABEL=blue271
NUMBER=519
NAME=lbm_r
SOURCES= lbm.c main.c
EXEBASE=lbm_r
NEED_MATH=yes
BENCHLANG=C

BENCH_FLAGS      = -DSPEC_AUTO_SUPPRESS_OPENMP
CC               = gcc
CC_VERSION_OPTION = -v
OPTIMIZE         = -O2
OS               = unix
PASS1_OPTIMIZE   = -fprofile-generate
PASS2_OPTIMIZE   = -fprofile-use
'specmake' Search for specmake. There will be several hits. For a more narrow search, use ^specmake.*build if your editor allows it. Below,
specmake clean removes old files
specmake build does the actual build
specmake options generates a summary list of options from the build.
Just after the specmake build is the first set of actual compile commands. There are several mandatory flags added by the toolset. For example, a flag is added to suppress OpenMP directives, because this is a SPECrate run. You can also see -O2 -fprofile-generate as requested in the config file.
Issuing make.clean command 'specmake --output-sync clean'
specmake --output-sync clean
Start make.clean command: 2017-02-14 05:26:09 (1487067969.8877)
rm -rf *.o  lbm.out
find . \( -name \*.o -o -name '*.fppized.f*' -o -name '*.i' -o -name '*.mod' \) -print | xargs rm -rf
rm -rf lbm_r
rm -rf lbm_r.exe
rm -rf core
Stop make.clean command: 2017-02-14 05:26:10 (1487067970.06632)
Elapsed time for make.clean command: 00:00:00 (0.178615808486938)
Issuing fdo_make_pass1 command 'specmake --output-sync --always-make build FDO=PASS1'
specmake --output-sync --always-make build FDO=PASS1
Start fdo_make_pass1 command: 2017-02-14 05:26:10 (1487067970.06816)
gcc -c -o lbm.o  -DSPEC -DSPEC_CPU -DNDEBUG -DSPEC_AUTO_SUPPRESS_OPENMP -O2 -fprofile-generate  lbm.c
gcc -c -o main.o -DSPEC -DSPEC_CPU -DNDEBUG -DSPEC_AUTO_SUPPRESS_OPENMP -O2 -fprofile-generate  main.c
gcc       -O2  -fprofile-generate        lbm.o main.o             -lm         -o lbm_r
Stop fdo_make_pass1 command: 2017-02-14 05:26:10 (1487067970.73817)
Elapsed time for fdo_make_pass1 command: 00:00:00 (0.670012950897217)
Issuing options1 command 'specmake --output-sync options FDO=PASS1'
specmake --output-sync options FDO=PASS1
Start options1 command: 2017-02-14 05:26:10 (1487067970.73965)
If you are curious about the build command
specmake --output-sync --always-make build FDO=PASS1
the details are:
specmake is
GNU Make.
--output-sync consolidates compiler stdout and stderr messages by module
--always-make rebuilds all targets
build selects the target which is the benchmark executable in $SPEC/benchspec/Makefile.defaults
FDO=PASS1 turns on the Feedback Directed Optimization switches matching PASS1 in Makefile.defaults
For more information on how SPEC CPU 2017 builds work, see the Make Variables document.
'Training' Search for Training. At the top of this section, runcpu forces single threading (effectively disabling OpenMP) because this is a SPECrate run. It takes a bit over 26 seconds to run the training workload.
Training 519.lbm_r with the train workload
OpenMP environment variables removed: None
OpenMP environment variables in effect:
    OMP_NUM_THREADS       '1'
    OMP_THREAD_LIMIT      '1'
Pre-run environment changes:
    'OMP_NUM_THREADS' added: (value now '1')
    'OMP_THREAD_LIMIT' added: (value now '1')
Commands to run (specinvoke command file):
  -N C
  -C /vampir/cpu2017/rc4/benchspec/CPU/519.lbm_r/build/build_peak_blue271.0000
  -o lbm.out -e lbm.err ../build_peak_blue271.0000/lbm_r 300 reference.dat 0 1 100_100_130_cf_b.of
Specinvoke: /vampir/cpu2017/rc4/bin/specinvoke -d /vampir/cpu2017/rc4/benchspec/CPU/519.lbm_r/build...
Issuing command '/vampir/cpu2017/rc4/bin/specinvoke -d /vampir/cpu2017/rc4/benchspec/CPU/519.lbm_r/...
/vampir/cpu2017/rc4/bin/specinvoke -d /vampir/cpu2017/rc4/benchspec/CPU/519.lbm_r/build/build_peak_...
Start command: 2017-02-14 05:26:11 (1487067971.19247)
Stop command: 2017-02-14 05:26:37 (1487067997.72349)
Elapsed time for command: 00:00:26 (26.5310192108154)
Workload elapsed time (copy 0 workload 1) = 26.366245 seconds
Copy 0 of 519.lbm_r (peak train) run 1 finished at 2017-02-14 05:26:37. Total elapsed time: 26.3662
Notice the section 'Commands to run'. The key line begins with -o which tells specinvoke to
send output to lbm.out (from -o lbm.out)
send errors to lbm.err (from -e lbm.err)
run the benchmark executable binary lbm_r (from ..path../lbm_r)
with arguments 300 reference.dat 0 1 100_100_130_cf_b.of
Some benchmarks run more than once and have multiple lines that start with -o in the corresponding location. For example, the compression benchmark 557.xz_r compresses several different kinds of input stream. You can see the inputs that SPEC has provided for training purposes in the directories nnn.benchmark/data/train/input and nnn.benchmark/data/all/input. In some cases, the training workloads required significant development effort. As a user of the suite you don't have to worry about that; you simply apply them.
About training fidelity: SPEC is aware that there is some variation in the fidelity between benchmark training workloads vs. the timed "ref" workloads. One might argue that a training data set is "not good enough": compilers might guess incorrectly if they rely on it; or argue that a set is "too good": compilers can guess too easily. In the real world also, not just in benchmarking, there is such variation, because training data sets can be difficult to find. If you would like to experiment with different training workloads, see the comments on using a sandbox in the document Avoiding runcpu; see the utility convert_to_development; and please be reminded that you must not represent measurements with other workloads as official SPEC metrics. [link to this paragraph]
'specmake' (again): If you search again for specmake, you will come to the second specmake build, which uses the generated profile.
Issuing fdo_make_pass2 command 'specmake --output-sync --always-make build FDO=PASS2'
specmake --output-sync --always-make build FDO=PASS2
Start fdo_make_pass2 command: 2017-02-14 05:26:38 (1487067998.25607)
gcc -c -o lbm.o  -DSPEC -DSPEC_CPU -DNDEBUG -DSPEC_AUTO_SUPPRESS_OPENMP -O2 -fprofile-use lbm.c
gcc -c -o main.o -DSPEC -DSPEC_CPU -DNDEBUG -DSPEC_AUTO_SUPPRESS_OPENMP -O2 -fprofile-use main.c
gcc       -O2  -fprofile-use        lbm.o main.o             -lm         -o lbm_r
Stop fdo_make_pass2 command: 2017-02-14 05:26:38 (1487067998.92049)
And that's it. The tools did most of the work; the user simply set the PASSn flags in the config file.
If you do many builds and runs, you may find that your result directory gets too cluttered. Within a result directory, all output formats other than .rsf can be regenerated from your .rsf files. Therefore, you could reduce clutter by deleting HTML, PDF, and other reports. You can delete old .debug logs unless you plan to submit a support request.
Still feel cluttered? A simple solution is to move your result directory aside, giving it a new name.
Don't worry about creating a new directory; runcpu will do so automatically. You should be careful to ensure
no surprises for any currently-running users.
If you move result directories, it is a good idea to also clean temporary directories at the same time.
Example:
cd $SPEC
mv result old-result
rm -Rf tmp/
cd output_root     # (If you use an output_root)
rm -Rf tmp/
Windows users: Windows users can achieve similar effects using the rename command to move directories, and the rd command to remove directories.
As described under "About Disk Usage" in runcpu.html, the CPU 2017 tools do the actual builds and runs in newly created directories. The benchmark sources are never modified in the src directory.
The build directories for a benchmark are located underneath that benchmarks' top-level directory, typically $SPEC/benchspec/CPU/nnn.benchmark/build (Unix) or %SPEC%\benchspec\CPU\nnn.benchmark\build (Windows).
(If you are using the output_root feature, then the first part of that path will change to be your requested root instead of SPEC.)
The build directories have logical names, typically of the form build_<tune>_<label>.0000. Continuing the FDO log example, this directory was created:
$ go lbm build                (go)
/vampir/cpu2017/rc4/benchspec/CPU/519.lbm_r/build
$ ls -ld *blue*
drwxrwxr-x  40 mat staff  1360 Feb 14 05:26 build_peak_blue271.0000
$
On Windows, you would say cd %SPEC%\benchspec\CPU\519.lbm_r\build followed by dir build*.
If the directory build_<tune>_<label>.0000 already exists when a new build is attempted for the same tuning and label, the directory will be re-used, unless:
In such cases, the 0000 will be incremented until a name is generated that is available. You can find locked directories by searching for lock=yes in the file $SPEC/benchspec/CPU/<nnn.benchmark>/run/list (Unix) or %SPEC%\benchspec\CPU\<nnn.benchmark>\run\list (Windows).
When more than one build directory has been created for a given tuning and label, you may need to trace the directory back to the specific build attempt that created it. You can do so by searching for the directory name in the log files:
$ grep build_peak_blue271.0000 *log | grep Building
CPU2017.838.log:  Building 519.lbm_r peak blue271: (build_peak_blue271.0000) [2017-02-14 05:26:09]
$
In the above example, the grep command locates log #838 as the log that corresponds to this run directory. On Windows, of course, you would use findstr instead of grep.
A variety of files are output to the build directory. Here are some of the key files which can usefully be examined:
| Makefile.spec | The components for make that were generated for the current config file with the current set of runcpu options. |
| options.out | For 1 pass compile: build options summary. |
| options1.out | For N pass compile: summary of first pass. |
| options2.out | For N pass compile: summary of second pass. |
| make.out | For 1 pass compile: detailed commands generated. |
| fdo_make_pass1.out | For N pass compile: detailed commands generated for 1st pass. |
| fdo_make_pass2.out | For N pass compile: detailed commands generated for 2nd pass. |
For more information about how the run directories work, see the descriptions of specinvoke, specmake, and specdiff in utility.html.
SPEC CPU 2017 v1.0 provided new capabilities for power measurement.
As of SPEC CPU 2017
v1.1, these capabilities are fully supported, and power results can be compared across systems.
Power measurement is optional.
Power measurement uses the same methods as other SPEC benchmarks, as initially introduced with the SPECpower_ssj®2008 benchmark suite.
To get started:
Review the new SPEC CPU 2017 Run Rules regarding power, especially section 3.9 Power and Temperature Measurement.
You will need additional hardware:
An x86-based Linux or Windows "Controller System", where you will run SPEC's Power and Temperature reporting tool, SPEC PTDaemon™. The PTDaemon controls your power analyzer and temperature sensor, translating vendor-specific command and hardware interfaces into a consistent interface for use by runcpu. Use the SPECpower Device Compatibility page to help you pick a controller system that is compatible with your power analyzer and temperature sensor.
On the controller system, follow the Power and Temperature Measurement Setup Guide to set up PTDaemon so that the power analyzer and the temperature meter are available at known network locations. There are also some examples just below that may help you.
On the system under test, edit your config file:
Enter the network locations into the power_analyzer and temp_meter fields. For example, if your controller system is named "regler", you might enter:
power_analyzer = regler:8888
temp_meter     = regler:8889
Set power = yes in your config file, or use runcpu --power, and try a simple run, for example:
$ runcpu -c myconfig --power --size=test --iterations=1 --tune=base --copies=1 519.lbm
You should see messages such as these:
Connecting to power analyzers...
Attempting to connect to PTD at regler:8888 with 30 second timeout...
Connected to 1 power analyzers
Connecting to temperature meters...
Attempting to connect to PTD at regler:8889 with 30 second timeout...
Connected to 1 temperature meters
Example connections: Your particular setup for PTDaemon will depend on the details of your power analyzer, temperature meter, and controller system. See the list of accepted devices and the SPECpower Device Compatibility page.
The diagram on the right shows one example setup, using a Linux controller system (named "regler") with a USB port connected to a temperature monitor, and another USB port connected to a power analyzer via a USB-to-RS232 converter. Your connections may differ. One copy of ptd controls the analyzer, making its measurements available at network location regler:8888. Another copy of ptd controls the temperature monitor and provides data to network location regler:8889. On the System Under Test (SUT), runcpu starts up a series of SPECrate jobs, and obtains power and temperature data from network locations regler:8888 and regler:8889. The temperature probe is hung about 25 mm (1 inch) from the primary air intake (as the rules require). All power to the SUT comes through the power analyzer. |
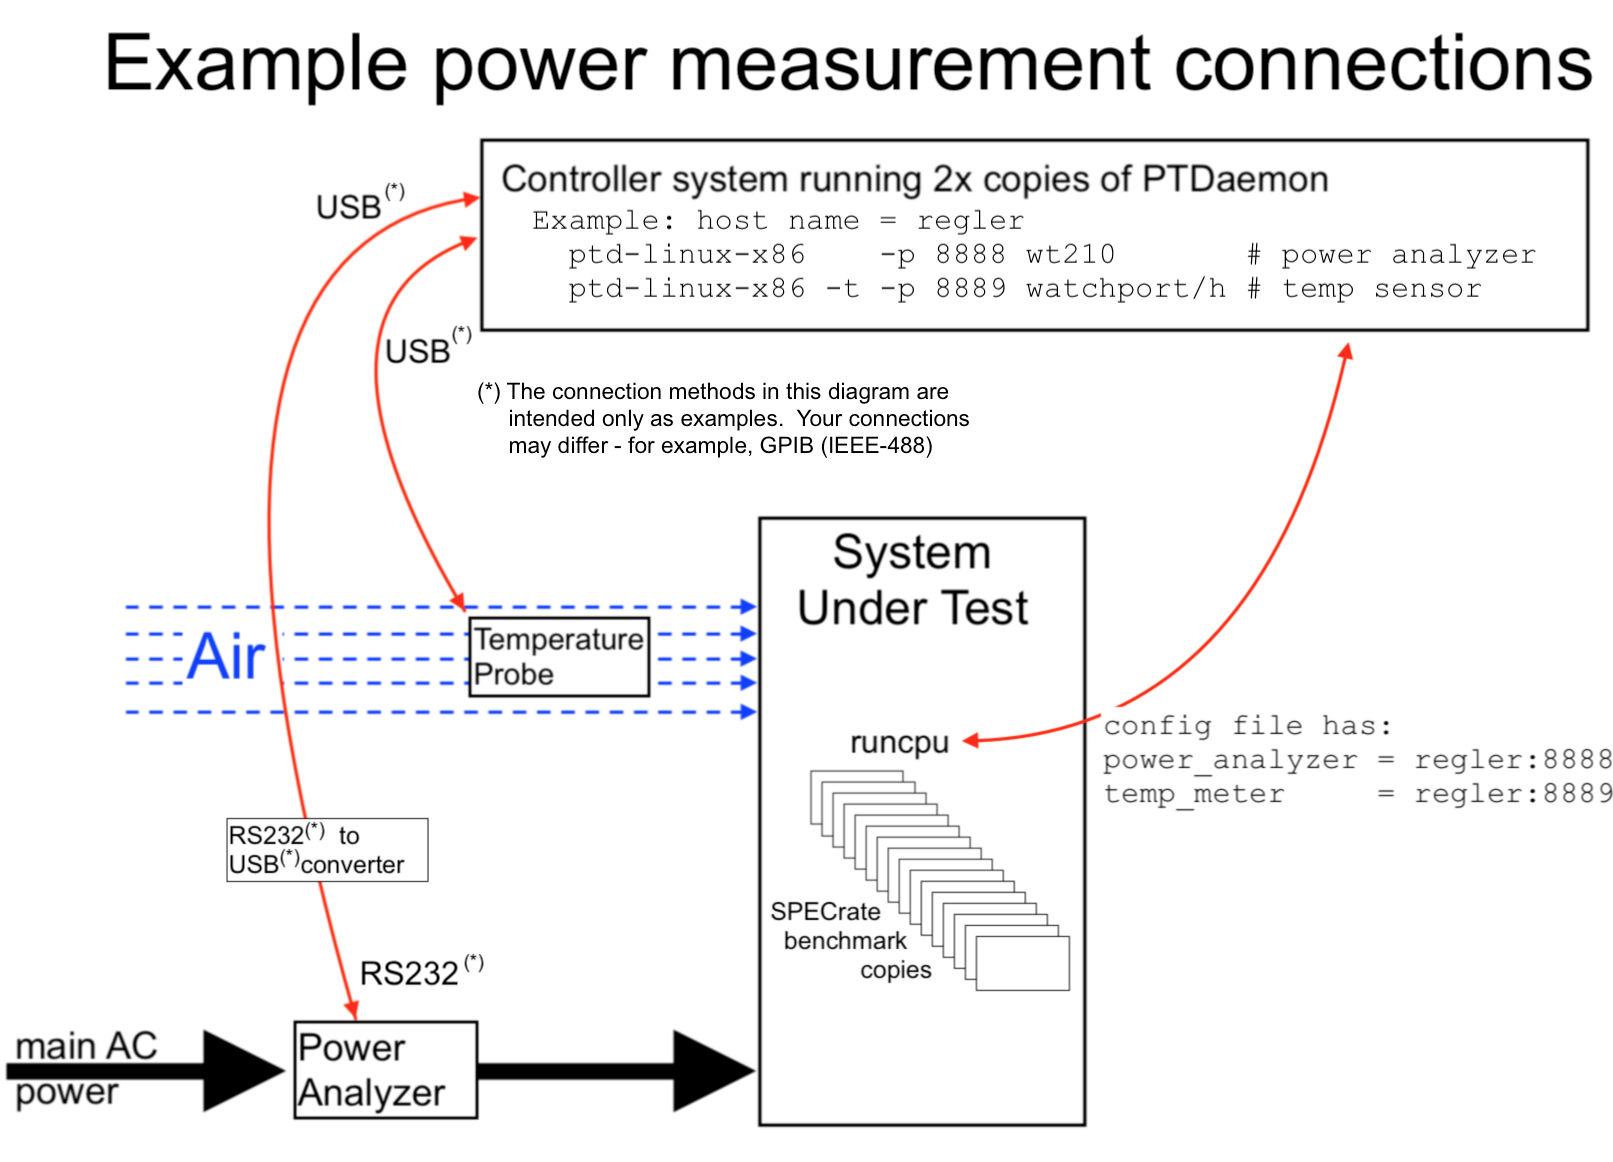 |
Software example: Use the Power and Temperature Measurement Setup Guide to set up PTDaemon. The details will depend on your particular power analyzer, temperature sensor, and controller system; the following is only an example.
From the system under test, copy the PTD binary to a controller system. Reminder: PTDaemon is distributed with the SPEC CPU 2017 software under license terms which do not allow you to copy it outside of your licensed institution. |
$ cd $SPEC $ scp PTDaemon/binaries/ptd-linux-x86 root@regler:/root/ptd root@regler's password: ptd-linux-x86 100% 3778KB 16.8MB/s 00:00 $ |
On the controller system, verify which devices communicate with your power analyzer and temperature sensor. This example uses USB on Linux. The lsusb command prints the devices. The last two lines match what the user connected, namely, a Keyspan serial adapter (which is connected to the power analyzer) and a Digi Watchport/H temperature sensor. (Tip: in case of ambiguity, the list of USB IDs may help you.) The dmesg command shows which one is associated with which /dev/ttyUSB device. |
$ lsusb | grep -v hub Bus 001 Device 002: ID 046b:ff01 American Megatrends, Inc. Bus 002 Device 002: ID 04b4:6560 Cypress Semiconductor Corp. CY7C65640 USB-2.0 "TetraHub" Bus 005 Device 002: ID 046b:ff10 American Megatrends, Inc. Virtual Keyboard and Mouse Bus 007 Device 002: ID 06cd:0121 Keyspan USA-19hs serial adapter Bus 008 Device 002: ID 1608:0305 Inside Out Networks [hex] Watchport/H $ ls /dev/*USB* /dev/ttyUSB0 /dev/ttyUSB1 $ dmesg | grep ttyUSB usb 7-2: Keyspan 1 port adapter converter now attached to ttyUSB0 usb 8-1: Edgeport TI 1 port adapter converter now attached to ttyUSB1 $ |
Start PTD. In this example, a simple script starts PTDaemon with logging to files in the directory /root/ptd/logs. There are many more options, as described at the Power and Temperature Measurement Setup Guide. For example, you might want to add the debug option -d while you are doing initial setup. The pgrep command verifies that both copies are running. |
# cat start-ptd.sh #!/bin/bash PT=/root/ptd/ptd-linux-x86 LG=/root/ptd/logs export LIBC_FATAL_STDERR_=1 # Send fatal errors to the output files $PT -l $LG/power.log -p 8888 wt210 /dev/ttyUSB0 >> $LG/power.out 2>&1 & $PT -t -l $LG/temp.log -p 8889 watchport/h /dev/ttyUSB1 >> $LG/temp.out 2>&1 & # ./start-ptd.sh # pgrep -l ptd 16980 ptd-linux-x86 16981 ptd-linux-x86 # |
The above will you get started. Prior to publishing any results, you will also need to fill out
the various other config file fields that describe your power and temperature measurement for human readers, for example:
hw_power_{id}_cal_date
hw_power_{id}_connection
hw_temperature_{id}_connection
hw_temperature_{id}_setup.
There are many other such fields; please search for "power" and "temp" in the list of Reader Fields in the table of contents.
Analyzer Power Ranges: Power analyzers typically need to be set according to the expected incoming power. In your config file, you estimate the current needed for the benchmarks, and then the SPEC toolset tells the analyzer what power range to use.
For example, if your power analyzer has three ranges of 1 Amp, 10 Amps, and 20 Amps, and your config file has:
intrate:
   current_range=7
fpspeed:
   current_range=12
then the middle range will automatically be selected when running integer rate, and the upper range will be selected when running floating point speed.
Requirements: The run rules require the tester to pick current ranges that meet certain conditions, notably including the condition that uncertainty must be reported at less than 1%. This section is intended to help you with current_range selection.
Auto-ranging: Some power analyzers can dynamically respond to incoming current and automatically pick a power range. Auto-ranging may be useful during initial setup, but must be avoided for reportable runs unless there is no other choice (in which case evidence must be preserved to prove that it was the only choice).
Initial Current Range: You will need to pick initial values for both the expected maximum current_range and the expected idle_current_range. There are several ways you can pick initial values:
Or, if your power analyzer supports auto-ranging, temporarily set the current_range=auto and do a single-iteration, base tuning, non-reportable run of floating point rate while exercising all available hardware threads. Then, either:
Check out the PTD log, looking for the maximum Amps. For example, on a Linux controller system you could enter commands similar to these:
# grep ",Amps" power.log | sort -nk8 -t, | tail -3
Time,05-12-2019 07:41:48.300,Watts,2779.100000,Volts,209.010000,Amps,13.328000,PF,0.997600,Mark,507.cactuBSSN_r
Time,05-12-2019 07:41:56.300,Watts,2783.300000,Volts,208.990000,Amps,13.349000,PF,0.997700,Mark,507.cactuBSSN_r
Time,05-12-2019 07:41:47.300,Watts,2787.900000,Volts,208.980000,Amps,13.372000,PF,0.997700,Mark,507.cactuBSSN_r
# grep "Mark,Idle" power.log | sort -nk8 -t, | tail -3
Time,05-12-2019 02:06:45.600,Watts,1491.800000,Volts,210.440000,Amps,7.132000,PF,0.994000,Mark,Idle
Time,05-12-2019 02:06:44.600,Watts,1492.600000,Volts,210.470000,Amps,7.135000,PF,0.994000,Mark,Idle
Time,05-12-2019 02:06:47.600,Watts,1492.700000,Volts,210.430000,Amps,7.137000,PF,0.994000,Mark,Idle
#
The above commands search the power log, sorting numerically by the 8th field, where fields are delimited by commas, and print the last few (highest) records. From the above example, one could set current_range=13.4 and idle_current_range=7.2.
After you complete the non-reportable, single-iteration run, change the word "auto" to the number of Amps that were observed.
Adjusting the range: You may need to adjust your initial values after you do more runs. Keep an eye on the reported "Max. Power(W)" in the various reports. Watch for any reported errors. For example, if you see errors such as these:
ERROR: Average uncertainty of all samples from regler:8888 exceeds 1%
ERROR: Reading power analyzers returned errors
then you may have set current_range to a value that is too high.
On the other hand, if you see errors such as these:
Meter 'regler:8888' reports 10 errors
Meter 'regler:8888' reports 10 samples, of which only 0 are good
ERROR: Power analyzer 'regler:8888' returned no measurement uncertainty information
then one possiblity that you should check would be whether you may have set a current_range that is too low.
Multiple ranges: To meet the rules, you may need to pick different current ranges for different benchmarks, by setting current_range in benchmark-specific sections. For example, if you find that 507.cactuBSSN_r uses more current than other floating point rate benchmarks, perhaps you might set something like this:
fprate=base:
   current_range=9
507.cactuBSSN_r=base:
   current_range=13.4
Note: it is allowed to set different current ranges for different benchmarks, even in base.
If you run into difficulties, a few suggestions may be found in the FAQ.
|
To reference a set in the benchmark specifier, typically one uses a set that corresponds to a metric, or else default:
|
 # examples
  intrate:
     OPTIMIZE = -O2
  fprate:
     OPTIMIZE = -O3
  fpspeed:
     EXTRA_OPTIMIZE = -DSPEC_OPENMP -fopenmp
  default=peak:
     LDOPTIONS = --shared
|
This appendix describes the Auxiliary Benchmark Sets.
These sets are available but require caution. They are not recommended unless you are an
expert user.
specspeed    intspeed plus fpspeed
specrate     intrate  plus fprate
cpu          all benchmarks: the same benchmarks as 'default'; higher priority than 'default'
openmp       benchmarks with OpenMP directives
serial_speed specspeed benchmarks without OpenMP
any_fortran  benchmarks using Fortran (in whole or in part)
pure_fortran benchmarks using Fortran and no other language
  .          Any other benchmark set from
  .             ls $SPEC/benchspec/CPU    (Unix)
  .             dir %SPEC%\benchspec\CPU  (Windows)
Considerations when using Auxiliary Benchmarks Sets:
Benchmarks are members of many auxiliary sets. (For example, 503.bwaves_r appears in sets specrate:, pure_fortran, and any_fortran among others). If a config file addresses more than one, conflicts are resolved alphabetically. Effectively, the precedence listed in Precedence Example 1 becomes:
  highest   named benchmark(s)
            suite name
            auxilary sets in alphabetical order
  lowest    default
Warning: Usually, you should use only benchmark sets that correspond directly to SPEC metrics: intrate, intspeed, fprate, or fpspeed, because:
If you use a set that is not a metric, care must be taken to avoid accidental rule violations, to avoid surprises from missing preenv variables, and to avoid precedence surprises.
Example: The diff command shows that only one line differs between two config files. benchmark_set.wrong.cfg falls into two traps.
$ diff --width 110 --side-by-side  --left-column \
>   benchmark_set.correct.cfg                          benchmark_set.wrong.cfg
flagsurl       = $[top]/config/flags/gcc.xml          (
output_format  = text                                 (
output_root    = /tmp/benchmark_set                   (
runlist        = intspeed                             (
size           = test                                 (
default:                                              (
   CC          = gcc      -std=c99                    (
   CXX         = g++      -std=c++03                  (
   FC          = gfortran -std=f2003                  (
   # How to say "Show me your version"                (
   CC_VERSION_OPTION    = -v                          (
   CXX_VERSION_OPTION   = -v                          (
   FC_VERSION_OPTION    = -v                          (
default=base:                                         (
   OPTIMIZE             = -O1                         (
intspeed:  # correct                                  | openmp:    # wrong wrong wrong wrong wrong wrong
   EXTRA_OPTIMIZE       = -DSPEC_OPENMP -fopenmp      (
   preENV_OMP_STACKSIZE = 120M                        (
                                                      (
$
The script runs both in fake mode, and searches the output for the OMP_STACKSIZE setting:
$cat benchmark_set.sh
runcpu --fakereportable --config=benchmark_set.correct | grep speed.txt
runcpu --fakereportable --config=benchmark_set.wrong   | grep speed.txt
cd /tmp/benchmark_set/result
grep STACKSIZE *txt
$
$ ./benchmark_set.sh
    format: Text -> /tmp/benchmark_set/result/CPU2017.001.intspeed.txt
    format: Text -> /tmp/benchmark_set/result/CPU2017.002.intspeed.txt
CPU2017.001.intspeed.txt:    OMP_STACKSIZE = "120M"
$  (Notes about examples)
Notice that only benchmark_set.correct.cfg gets the desired OMP_STACKSIZE. (The grep does not match CPU2017.002.intspeed.txt.)
More importantly, benchmark_set.correct.cfg compiles all C benchmarks the same way (as required). From CPU2017.001.intspeed.txt:
                              Base Optimization Flags
                              -----------------------
C benchmarks:
     -std=c99 -O1 -DSPEC_OPENMP -fopenmp
The consistency rule is violated by benchmark_set.wrong.cfg and results using it would be non-compliant. From CPU2017.002.intspeed.txt:
                              Base Optimization Flags
                              -----------------------
C benchmarks:
 600.perlbench_s: -std=c99 -O1
       602.gcc_s: Same as 600.perlbench_s
       605.mcf_s: Same as 600.perlbench_s
      625.x264_s: Same as 600.perlbench_s
        657.xz_s: -std=c99 -O1 -DSPEC_OPENMP -fopenmp
When something goes wrong, here are some things to check:
Are there any obvious clues in the log file? Search for the word "Building". Keep searching until you hit the next benchmark AFTER the one that you are interested in. Now scroll backward looking for errors.
Did your desired switches get applied? Go to the build directory, and look at options*out.
Did the tools or your compilers report any errors? Look in the build directory at *out or *err.
What happens if you try the build by hand? See the section on specmake in utility.html.
If an actual run fails, what happens if you invoke the run by hand? See the information about "specinvoke -n" in utility.html
Do you understand what is in your path, and why? Sometimes confusion can be greatly reduced by ensuring that you have only what is needed, avoiding, in particular, experimental and non-standard versions of standard utilities.
Note: on Windows systems, SPEC recommends that Windows/Unix compatibility products should be removed from the %PATH% prior to invoking runcpu, in order to reduce the probability of certain difficult-to-diagnose error messages.
Try asking the tools to leave more clues behind, with keeptmp.
| Option | Notes |
| allow_extension_override | Now called allow_label_override. |
| company_name | Obsolete. You are probably looking for hw_vendor, tester, or test_sponsor. See the example under test_sponsor. |
| ext | Obsolete. For CPU 2017, use label |
| hw_cpu_char | Obsolete. For CPU 2006, was used primarily as an additional field to describe MHz. For CPU 2017, there are two fields: hw_cpu_nominal_mhz and hw_cpu_max_mhz |
| hw_cpu_mhz | Obsolete. For CPU 2017, there are two fields: hw_cpu_nominal_mhz and hw_cpu_max_mhz |
| hw_cpu_ncoresperchip | Obsolete. For CPU 2017, specify the total number of enabled cores (hw_ncores) and the total number of enabled chips (hw_nchips); trust the reader to do the division. (If for some reason this is not possible, please use the free-form notes to explain.) |
| hw_fpu | Obsolete. |
| mach | Obsolete. Was removed in CPU 2017 because it was rarely used; and it tended to increase both complexity and confusion. |
| machine_name | Obsolete since retirement of CPU95. |
| max_active_compares | Obsolete. Was removed in CPU 2017 primarily because of complexity considerations when implementing the new parallel setup methods. |
| rate | Obsolete, because of the change to how benchmarks are defined in CPU 2017 (SPECrate = 5xx, SPECspeed = 6xx). See the discussion of removed items in Using SPEC CPU 2017. |
| speed | Obsolete, because of the change to how benchmarks are defined in CPU 2017 (SPECrate = 5xx, SPECspeed = 6xx). See the discussion of removed items in Using SPEC CPU 2017. |
| sw_auto_parallel | This flag has been obsolete since the release of SPEC CPU 2006 V1.1. If your compiler creates binaries that use multiple processors, you should instead make sure that your flags file indicates this by setting the flag attribute parallel="yes". The tools will notice if you use a flag that has this flag attribute set, and if so will automatically include that information in the reports. See the discussion of parallel reporting. |
| test_date | When the tests were run. This field is populated automatically based on the clock in the system under test. Setting this in the config file will generate a warning and the setting will be ignored. If your system clock is incorrect, then the value may be edited in the raw file (see utility.html). It is better to avoid the necessity to edit, by setting your system clock properly. |
| tester_name | Obsolete. You are probably looking for hw_vendor, tester, or test_sponsor. See the example under test_sponsor. |
| VENDOR | This field is obsolete, and has been since SPEC CPU92 was retired. |
SPEC CPU® 2017 Config Files: Copyright © 2017-2020 Standard Performance Evaluation Corporation (SPEC®)
