
SPECpower_ssj2008
Aggregate Performance Report
Copyright © 2007-2022 Standard Performance Evaluation Corporation
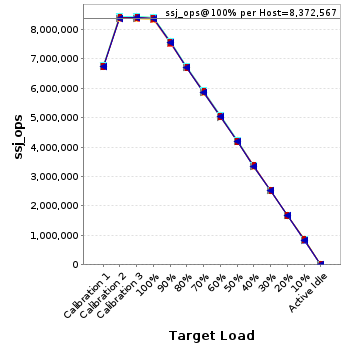
| Hewlett Packard Enterprise Synergy 480 Gen10 Plus Compute Module | ssj_ops@100% = 83,725,673 ssj_ops@100% per Host = 8,372,567 ssj_ops@100% per JVM = 104,657 |
||||
| Test Sponsor: | Hewlett Packard Enterprise | SPEC License #: | 3 | Test Method: | Multi Node |
| Tested By: | Hewlett Packard Enterprise | Test Location: | Houston, TX, USA | Test Date: | Jan 11, 2022 |
| Hardware Availability: | Apr-2021 | Software Availability: | Apr-2021 | Publication: | Feb 16, 2022 |
| System Source: | Single Supplier | System Designation: | Server | Power Provisioning: | Line-powered |
| Target Load | Actual Load | ssj_ops | |
|---|---|---|---|
| Target | Actual | ||
| Calibration 1 | 67,504,411 | ||
| Calibration 2 | 83,949,034 | ||
| Calibration 3 | 84,013,002 | ||
| ssj_ops@calibrated=83,981,018 | |||
| 100% | 99.7% | 83,981,018 | 83,725,673 |
| 90% | 90.0% | 75,582,916 | 75,580,023 |
| 80% | 80.0% | 67,184,814 | 67,162,846 |
| 70% | 70.0% | 58,786,712 | 58,805,865 |
| 60% | 60.0% | 50,388,611 | 50,355,774 |
| 50% | 50.0% | 41,990,509 | 41,968,956 |
| 40% | 40.0% | 33,592,407 | 33,570,733 |
| 30% | 30.0% | 25,194,305 | 25,209,367 |
| 20% | 20.0% | 16,796,204 | 16,797,461 |
| 10% | 10.0% | 8,398,102 | 8,397,394 |
| Active Idle | 0 | 0 | |

| # of Nodes | # of Chips | # of Cores | # of Threads | Total RAM (GB) | # of OS Images | # of JVM Instances |
|---|---|---|---|---|---|---|
| 10 | 20 | 800 | 1,600 | 2,560 | 10 | 800 |
| Set Identifier: | SUT |
| Set Description: | System Under Test |
| # of Identical Nodes: | 10 |
| Comment: | SUT |
| Hardware per Node | |
|---|---|
| Hardware Vendor: | Hewlett Packard Enterprise |
| Model: | Synergy 480 Gen10 Plus Compute Module |
| Form Factor: | Blade |
| CPU Name: | Intel Xeon Platinum 8380 CPU @ 2.30GHz |
| CPU Characteristics: | 40-Core, 2.30 GHz, 60MB L3 Cache |
| CPU Frequency (MHz): | 2300 |
| CPU(s) Enabled: | 80 cores, 2 chips, 40 cores/chip |
| Hardware Threads: | 160 (2 / core) |
| CPU(s) Orderable: | 1,2 chips |
| Primary Cache: | 32 KB I + 48 KB D on chip per core |
| Secondary Cache: | 1280 KB I+D on chip per core |
| Tertiary Cache: | 60 MB I+D on chip per chip |
| Other Cache: | None |
| Memory Amount (GB): | 256 |
| # and size of DIMM: | 16 x 16384 MB |
| Memory Details: | 16 x 16GB 2Rx8 PC4-3200-T; slots 1, 3, 5, 7, 10, 12, 14 & 16 on each socket |
| Power Supply Quantity and Rating (W): | None |
| Power Supply Details: | Shared |
| Disk Drive: | HPE 240GB SATA 6G Read Intensive SFF (P18420-B21) |
| Disk Controller: | Embedded SATA Controller |
| # and type of Network Interface Cards (NICs) Installed: | 1 x HPE Synergy 4820C 10/20/25Gb CNA |
| NICs Enabled in Firmware / OS / Connected: | 2/1/1 |
| Network Speed (Mbit): | 10000 |
| Keyboard: | None |
| Mouse: | None |
| Monitor: | None |
| Optical Drives: | No |
| Other Hardware: | None |
| Software per Node | |
|---|---|
| Power Management: | Enabled (see SUT Notes) |
| Operating System (OS): | SUSE Linux Enterprise Server 15 SP2 |
| OS Version: | 5.3.18-22-default |
| Filesystem: | xfs |
| JVM Vendor: | Oracle Corporation |
| JVM Version: | Oracle Java HotSpot(TM) 64-Bit Server VM 18.9 (build 11.0.11+9-LTS-194, mixed mode) |
| JVM Command-line Options: | -server -Xmn1700m -Xms1950m -Xmx1950m -XX:SurvivorRatio=1 -XX:TargetSurvivorRatio=99 -XX:ParallelGCThreads=2 -XX:AllocatePrefetchDistance=256 -XX:AllocatePrefetchLines=4 -XX:LoopUnrollLimit=45 -XX:InitialTenuringThreshold=12 -XX:MaxTenuringThreshold=15 -XX:InlineSmallCode=3900 -XX:MaxInlineSize=270 -XX:FreqInlineSize=2500 -XX:+UseLargePages -XX:+UseParallelOldGC -XX:UseAVX=0 -XX:-UseAdaptiveSizePolicy -XX:-ThreadLocalHandshakes |
| JVM Affinity: | for each physicalCore { numactl -C physicalCoreId, physicalCoreId + 80 } |
| JVM Instances: | 80 |
| JVM Initial Heap (MB): | 1950 |
| JVM Maximum Heap (MB): | 1950 |
| JVM Address Bits: | 64 |
| Boot Firmware Version: | I44 v1.40 (03/05/2021) |
| Management Firmware Version: | 2.40 pass 31 Jan 05 2021 |
| Workload Version: | SSJ 1.2.10 |
| Director Location: | Controller |
| Other Software: | None |
| Host | ssj_ops@100% |
|---|---|
| sy480-01 | 8,346,523 |
| sy480-02 | 8,372,834 |
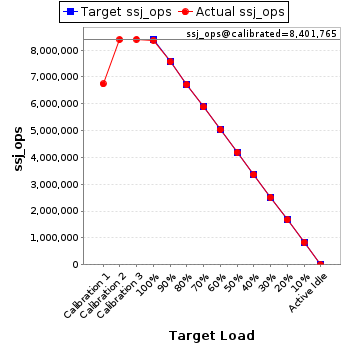
| sy480-03 | 8,411,765 |
| sy480-04 | 8,353,720 |
| sy480-05 | 8,360,150 |
| sy480-06 | 8,411,983 |
| sy480-07 | 8,377,438 |
| sy480-08 | 8,357,480 |
| sy480-09 | 8,375,122 |
| sy480-10 | 8,358,659 |
| ssj_ops@100% | 83,725,673 |
| ssj_ops@100% per Host | 8,372,567 |
| ssj_ops@100% per JVM | 104,657 |
| Target Load | Actual Load | ssj_ops | |
|---|---|---|---|
| Target | Actual | ||
| Calibration 1 | 6,736,019 | ||
| Calibration 2 | 8,368,549 | ||
| Calibration 3 | 8,372,546 | ||
| ssj_ops@calibrated=8,370,548 | |||
| 100% | 99.7% | 8,370,548 | 8,346,523 |
| 90% | 90.0% | 7,533,493 | 7,533,059 |
| 80% | 80.0% | 6,696,438 | 6,692,843 |
| 70% | 70.0% | 5,859,383 | 5,860,014 |
| 60% | 60.0% | 5,022,329 | 5,024,358 |
| 50% | 50.0% | 4,185,274 | 4,184,865 |
| 40% | 40.0% | 3,348,219 | 3,351,120 |
| 30% | 30.0% | 2,511,164 | 2,513,349 |
| 20% | 20.0% | 1,674,110 | 1,673,987 |
| 10% | 10.0% | 837,055 | 838,138 |
| Active Idle | 0 | 0 | |

| Target Load | Actual Load | ssj_ops | |
|---|---|---|---|
| Target | Actual | ||
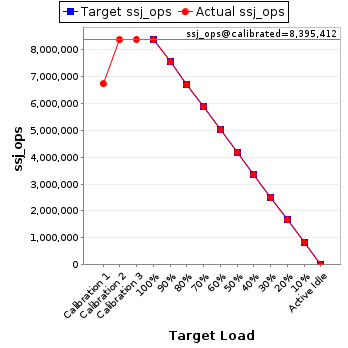
| Calibration 1 | 6,741,477 | ||
| Calibration 2 | 8,390,550 | ||
| Calibration 3 | 8,400,274 | ||
| ssj_ops@calibrated=8,395,412 | |||
| 100% | 99.7% | 8,395,412 | 8,372,834 |
| 90% | 90.0% | 7,555,871 | 7,555,630 |
| 80% | 80.0% | 6,716,330 | 6,715,756 |
| 70% | 70.1% | 5,876,789 | 5,881,320 |
| 60% | 60.0% | 5,037,247 | 5,035,425 |
| 50% | 50.0% | 4,197,706 | 4,196,337 |
| 40% | 40.0% | 3,358,165 | 3,357,490 |
| 30% | 30.0% | 2,518,624 | 2,519,570 |
| 20% | 20.0% | 1,679,082 | 1,682,136 |
| 10% | 10.0% | 839,541 | 837,855 |
| Active Idle | 0 | 0 | |
| Target Load | Actual Load | ssj_ops | |
|---|---|---|---|
| Target | Actual | ||
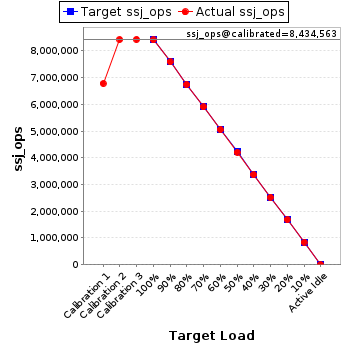
| Calibration 1 | 6,786,954 | ||
| Calibration 2 | 8,431,572 | ||
| Calibration 3 | 8,437,554 | ||
| ssj_ops@calibrated=8,434,563 | |||
| 100% | 99.7% | 8,434,563 | 8,411,765 |
| 90% | 90.0% | 7,591,107 | 7,592,670 |
| 80% | 80.0% | 6,747,650 | 6,748,685 |
| 70% | 70.0% | 5,904,194 | 5,905,931 |
| 60% | 60.0% | 5,060,738 | 5,061,892 |
| 50% | 50.0% | 4,217,281 | 4,214,382 |
| 40% | 39.9% | 3,373,825 | 3,366,944 |
| 30% | 30.0% | 2,530,369 | 2,530,479 |
| 20% | 20.0% | 1,686,913 | 1,687,725 |
| 10% | 10.0% | 843,456 | 846,373 |
| Active Idle | 0 | 0 | |
| Target Load | Actual Load | ssj_ops | |
|---|---|---|---|
| Target | Actual | ||
| Calibration 1 | 6,725,662 | ||
| Calibration 2 | 8,377,597 | ||
| Calibration 3 | 8,387,011 | ||
| ssj_ops@calibrated=8,382,304 | |||
| 100% | 99.7% | 8,382,304 | 8,353,720 |
| 90% | 90.1% | 7,544,074 | 7,549,978 |
| 80% | 80.0% | 6,705,843 | 6,704,987 |
| 70% | 70.0% | 5,867,613 | 5,866,339 |
| 60% | 60.0% | 5,029,383 | 5,026,973 |
| 50% | 49.9% | 4,191,152 | 4,186,623 |
| 40% | 40.0% | 3,352,922 | 3,350,405 |
| 30% | 30.1% | 2,514,691 | 2,519,034 |
| 20% | 20.0% | 1,676,461 | 1,679,868 |
| 10% | 10.0% | 838,230 | 840,481 |
| Active Idle | 0 | 0 | |

| Target Load | Actual Load | ssj_ops | |
|---|---|---|---|
| Target | Actual | ||
| Calibration 1 | 6,754,665 | ||
| Calibration 2 | 8,387,063 | ||
| Calibration 3 | 8,391,294 | ||
| ssj_ops@calibrated=8,389,178 | |||
| 100% | 99.7% | 8,389,178 | 8,360,150 |
| 90% | 89.9% | 7,550,260 | 7,540,517 |
| 80% | 80.0% | 6,711,343 | 6,710,093 |
| 70% | 70.1% | 5,872,425 | 5,877,831 |
| 60% | 59.9% | 5,033,507 | 5,028,143 |
| 50% | 50.0% | 4,194,589 | 4,192,985 |
| 40% | 40.0% | 3,355,671 | 3,356,365 |
| 30% | 30.1% | 2,516,753 | 2,521,472 |
| 20% | 20.0% | 1,677,836 | 1,675,420 |
| 10% | 10.0% | 838,918 | 836,291 |
| Active Idle | 0 | 0 | |

| Target Load | Actual Load | ssj_ops | |
|---|---|---|---|
| Target | Actual | ||
| Calibration 1 | 6,784,162 | ||
| Calibration 2 | 8,439,270 | ||
| Calibration 3 | 8,443,503 | ||
| ssj_ops@calibrated=8,441,386 | |||
| 100% | 99.7% | 8,441,386 | 8,411,983 |
| 90% | 90.0% | 7,597,248 | 7,596,011 |
| 80% | 80.0% | 6,753,109 | 6,749,982 |
| 70% | 70.0% | 5,908,970 | 5,907,354 |
| 60% | 60.0% | 5,064,832 | 5,067,146 |
| 50% | 49.9% | 4,220,693 | 4,215,792 |
| 40% | 40.0% | 3,376,555 | 3,377,957 |
| 30% | 30.0% | 2,532,416 | 2,535,691 |
| 20% | 19.9% | 1,688,277 | 1,683,802 |
| 10% | 10.0% | 844,139 | 845,286 |
| Active Idle | 0 | 0 | |

| Target Load | Actual Load | ssj_ops | |
|---|---|---|---|
| Target | Actual | ||
| Calibration 1 | 6,748,830 | ||
| Calibration 2 | 8,397,400 | ||
| Calibration 3 | 8,403,537 | ||
| ssj_ops@calibrated=8,400,468 | |||
| 100% | 99.7% | 8,400,468 | 8,377,438 |
| 90% | 89.9% | 7,560,421 | 7,553,539 |
| 80% | 80.0% | 6,720,374 | 6,721,047 |
| 70% | 70.1% | 5,880,328 | 5,888,782 |
| 60% | 59.8% | 5,040,281 | 5,024,016 |
| 50% | 49.9% | 4,200,234 | 4,193,612 |
| 40% | 40.0% | 3,360,187 | 3,356,776 |
| 30% | 30.0% | 2,520,140 | 2,520,211 |
| 20% | 20.0% | 1,680,094 | 1,679,511 |
| 10% | 10.0% | 840,047 | 837,965 |
| Active Idle | 0 | 0 | |

| Target Load | Actual Load | ssj_ops | |
|---|---|---|---|
| Target | Actual | ||
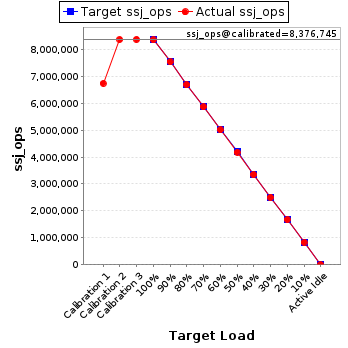
| Calibration 1 | 6,745,504 | ||
| Calibration 2 | 8,374,047 | ||
| Calibration 3 | 8,379,444 | ||
| ssj_ops@calibrated=8,376,745 | |||
| 100% | 99.8% | 8,376,745 | 8,357,480 |
| 90% | 90.0% | 7,539,071 | 7,539,415 |
| 80% | 79.9% | 6,701,396 | 6,694,581 |
| 70% | 70.1% | 5,863,722 | 5,868,782 |
| 60% | 59.8% | 5,026,047 | 5,012,243 |
| 50% | 50.0% | 4,188,373 | 4,186,374 |
| 40% | 40.0% | 3,350,698 | 3,350,620 |
| 30% | 30.0% | 2,513,024 | 2,510,857 |
| 20% | 20.0% | 1,675,349 | 1,678,141 |
| 10% | 10.0% | 837,675 | 836,923 |
| Active Idle | 0 | 0 | |
| Target Load | Actual Load | ssj_ops | |
|---|---|---|---|
| Target | Actual | ||
| Calibration 1 | 6,738,244 | ||
| Calibration 2 | 8,397,502 | ||
| Calibration 3 | 8,406,029 | ||
| ssj_ops@calibrated=8,401,765 | |||
| 100% | 99.7% | 8,401,765 | 8,375,122 |
| 90% | 90.1% | 7,561,589 | 7,569,653 |
| 80% | 80.0% | 6,721,412 | 6,719,509 |
| 70% | 70.0% | 5,881,236 | 5,879,612 |
| 60% | 60.0% | 5,041,059 | 5,037,939 |
| 50% | 49.9% | 4,200,883 | 4,195,881 |
| 40% | 40.0% | 3,360,706 | 3,357,393 |
| 30% | 30.0% | 2,520,530 | 2,520,606 |
| 20% | 20.0% | 1,680,353 | 1,678,561 |
| 10% | 10.0% | 840,177 | 839,255 |
| Active Idle | 0 | 0 | |
| Target Load | Actual Load | ssj_ops | |
|---|---|---|---|
| Target | Actual | ||
| Calibration 1 | 6,742,893 | ||
| Calibration 2 | 8,385,485 | ||
| Calibration 3 | 8,391,809 | ||
| ssj_ops@calibrated=8,388,647 | |||
| 100% | 99.6% | 8,388,647 | 8,358,659 |
| 90% | 90.0% | 7,549,783 | 7,549,552 |
| 80% | 79.9% | 6,710,918 | 6,705,362 |
| 70% | 70.0% | 5,872,053 | 5,869,901 |
| 60% | 60.1% | 5,033,188 | 5,037,639 |
| 50% | 50.1% | 4,194,324 | 4,202,104 |
| 40% | 39.9% | 3,355,459 | 3,345,666 |
| 30% | 30.0% | 2,516,594 | 2,518,097 |
| 20% | 20.0% | 1,677,729 | 1,678,311 |
| 10% | 10.0% | 838,865 | 838,826 |
| Active Idle | 0 | 0 | |
