SPECpower_ssj2008
Aggregate Performance Report
Copyright © 2007-2019 Standard Performance Evaluation Corporation
| Hewlett Packard Enterprise Synergy 480 Gen10 Compute Module | ssj_ops@100% = 34,460,439 ssj_ops@100% per Host = 5,743,406 ssj_ops@100% per JVM = 1,435,852 |
||||
| Test Sponsor: | Hewlett Packard Enterprise | SPEC License #: | 3 | Test Method: | Multi Node |
| Tested By: | Hewlett Packard Enterprise | Test Location: | Houston, TX, USA | Test Date: | Mar 26, 2019 |
| Hardware Availability: | Apr-2019 | Software Availability: | Mar-2019 | Publication: | May 8, 2019 |
| System Source: | Single Supplier | System Designation: | Server | Power Provisioning: | Line-powered |
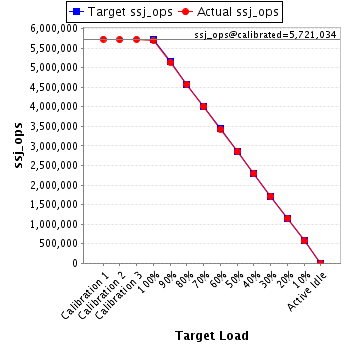
| Target Load | Actual Load | ssj_ops | |
|---|---|---|---|
| Target | Actual | ||
| Calibration 1 | 34,570,555 | ||
| Calibration 2 | 34,532,886 | ||
| Calibration 3 | 34,553,566 | ||
| ssj_ops@calibrated=34,543,226 | |||
| 100% | 99.8% | 34,543,226 | 34,460,439 |
| 90% | 90.0% | 31,088,903 | 31,078,951 |
| 80% | 80.1% | 27,634,581 | 27,652,805 |
| 70% | 70.0% | 24,180,258 | 24,187,548 |
| 60% | 60.0% | 20,725,935 | 20,722,154 |
| 50% | 50.0% | 17,271,613 | 17,274,455 |
| 40% | 40.0% | 13,817,290 | 13,818,888 |
| 30% | 30.0% | 10,362,968 | 10,365,048 |
| 20% | 20.0% | 6,908,645 | 6,912,589 |
| 10% | 10.0% | 3,454,323 | 3,460,642 |
| Active Idle | 0 | 0 | |
| # of Nodes | # of Chips | # of Cores | # of Threads | Total RAM (GB) | # of OS Images | # of JVM Instances |
|---|---|---|---|---|---|---|
| 6 | 12 | 336 | 672 | 1,152 | 6 | 24 |
| Set Identifier: | SUT |
| Set Description: | System Under Test |
| # of Identical Nodes: | 6 |
| Comment: | SUT |
| Hardware per Node | |
|---|---|
| Hardware Vendor: | Hewlett Packard Enterprise |
| Model: | Synergy 480 Gen10 Compute Module |
| Form Factor: | 7U |
| CPU Name: | Intel Xeon Platinum 8280 @ 2.70GHz (Intel Turbo Boost Technology up to 4.00 GHz) |
| CPU Characteristics: | 28-Core, 2.70 GHz, 38.5MB L3 Cache |
| CPU Frequency (MHz): | 2700 |
| CPU(s) Enabled: | 56 cores, 2 chips, 28 cores/chip |
| Hardware Threads: | 112 (2 / core) |
| CPU(s) Orderable: | 1,2 chips |
| Primary Cache: | 32 KB I + 32 KB D on chip per core |
| Secondary Cache: | 1 MB I+D on chip per core |
| Tertiary Cache: | 39424 KB I+D on chip per chip |
| Other Cache: | None |
| Memory Amount (GB): | 192 |
| # and size of DIMM: | 12 x 16384 MB |
| Memory Details: | 12 x 16GB 2Rx8 PC4-2933Y-R; slots 1, 3, 5, 8, 10 and 12 populated in each socket |
| Power Supply Quantity and Rating (W): | None |
| Power Supply Details: | N/A |
| Disk Drive: | 1 x HPE 240GB 6G SATA M.2 SSD (875488-B21) |
| Disk Controller: | HPE Smart Array S100i SR Gen10 |
| # and type of Network Interface Cards (NICs) Installed: | 1 x HPE Synergy 3820C 10/20Gb CNA |
| NICs Enabled in Firmware / OS / Connected: | 2/2/1 |
| Network Speed (Mbit): | 1000 |
| Keyboard: | None |
| Mouse: | None |
| Monitor: | None |
| Optical Drives: | No |
| Other Hardware: | H/S: Standard |
| Software per Node | |
|---|---|
| Power Management: | Enabled (see SUT Notes) |
| Operating System (OS): | Windows Server 2012 R2 Datacenter |
| OS Version: | Version 6.3 (Build 9600) |
| Filesystem: | NTFS |
| JVM Vendor: | Oracle Corporation |
| JVM Version: | Oracle Java HotSpot(TM) 64-Bit Server VM (build 24.80-b11, mixed mode), version 1.7.0_80 |
| JVM Command-line Options: | -server -Xmn21000m -Xms24000m -Xmx24000m -XX:SurvivorRatio=1 -XX:TargetSurvivorRatio=99 -XX:AllocatePrefetchDistance=256 -XX:AllocatePrefetchLines=4 -XX:LoopUnrollLimit=45 -XX:InitialTenuringThreshold=12 -XX:MaxTenuringThreshold=15 -XX:ParallelGCThreads=28 -XX:InlineSmallCode=3900 -XX:MaxInlineSize=270 -XX:FreqInlineSize=2500 -XX:+AggressiveOpts -XX:+UseLargePages -XX:+UseParallelOldGC |
| JVM Affinity: | start /NODE [0,1,2,3] /AFFINITY [0xFFFFFFF] |
| JVM Instances: | 4 |
| JVM Initial Heap (MB): | 24000 |
| JVM Maximum Heap (MB): | 24000 |
| JVM Address Bits: | 64 |
| Boot Firmware Version: | I42 v2.00 (02/02/2019) |
| Management Firmware Version: | 1.40 Feb 05 2019 |
| Workload Version: | SSJ 1.2.10 |
| Director Location: | Controller |
| Other Software: | HPE Service Pack for ProLiant (SPP) Version: 2019.03.0, Microsoft Windows KB4056898, KB4338815 |
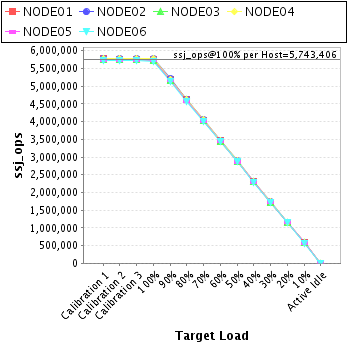
| Host | ssj_ops@100% |
|---|---|
| NODE01 | 5,746,113 |
| NODE02 | 5,770,768 |
| NODE03 | 5,738,324 |
| NODE04 | 5,769,683 |
| NODE05 | 5,728,344 |
| NODE06 | 5,707,208 |
| ssj_ops@100% | 34,460,439 |
| ssj_ops@100% per Host | 5,743,406 |
| ssj_ops@100% per JVM | 1,435,852 |
| Target Load | Actual Load | ssj_ops | |
|---|---|---|---|
| Target | Actual | ||
| Calibration 1 | 5,770,684 | ||
| Calibration 2 | 5,758,426 | ||
| Calibration 3 | 5,764,777 | ||
| ssj_ops@calibrated=5,761,602 | |||
| 100% | 99.7% | 5,761,602 | 5,746,113 |
| 90% | 90.1% | 5,185,441 | 5,190,880 |
| 80% | 80.1% | 4,609,281 | 4,614,506 |
| 70% | 70.0% | 4,033,121 | 4,032,235 |
| 60% | 60.1% | 3,456,961 | 3,462,649 |
| 50% | 50.0% | 2,880,801 | 2,880,719 |
| 40% | 40.0% | 2,304,641 | 2,304,112 |
| 30% | 30.0% | 1,728,480 | 1,727,871 |
| 20% | 20.0% | 1,152,320 | 1,150,445 |
| 10% | 10.0% | 576,160 | 577,985 |
| Active Idle | 0 | 0 | |

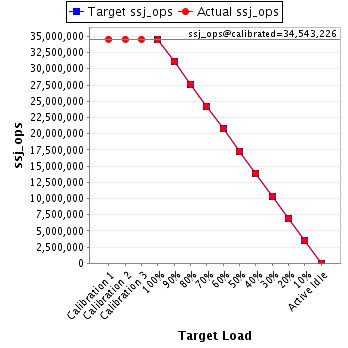
| Target Load | Actual Load | ssj_ops | |
|---|---|---|---|
| Target | Actual | ||
| Calibration 1 | 5,791,186 | ||
| Calibration 2 | 5,784,212 | ||
| Calibration 3 | 5,787,550 | ||
| ssj_ops@calibrated=5,785,881 | |||
| 100% | 99.7% | 5,785,881 | 5,770,768 |
| 90% | 90.0% | 5,207,293 | 5,205,789 |
| 80% | 80.1% | 4,628,705 | 4,637,333 |
| 70% | 70.2% | 4,050,117 | 4,061,726 |
| 60% | 60.0% | 3,471,529 | 3,470,360 |
| 50% | 50.0% | 2,892,941 | 2,892,723 |
| 40% | 40.0% | 2,314,352 | 2,315,605 |
| 30% | 30.0% | 1,735,764 | 1,735,590 |
| 20% | 20.0% | 1,157,176 | 1,156,698 |
| 10% | 10.0% | 578,588 | 578,965 |
| Active Idle | 0 | 0 | |

| Target Load | Actual Load | ssj_ops | |
|---|---|---|---|
| Target | Actual | ||
| Calibration 1 | 5,754,035 | ||
| Calibration 2 | 5,750,575 | ||
| Calibration 3 | 5,752,498 | ||
| ssj_ops@calibrated=5,751,536 | |||
| 100% | 99.8% | 5,751,536 | 5,738,324 |
| 90% | 90.0% | 5,176,383 | 5,174,191 |
| 80% | 80.2% | 4,601,229 | 4,610,730 |
| 70% | 69.9% | 4,026,075 | 4,020,246 |
| 60% | 59.9% | 3,450,922 | 3,447,523 |
| 50% | 50.0% | 2,875,768 | 2,878,367 |
| 40% | 40.0% | 2,300,614 | 2,301,276 |
| 30% | 30.0% | 1,725,461 | 1,725,034 |
| 20% | 20.0% | 1,150,307 | 1,149,427 |
| 10% | 10.0% | 575,154 | 576,872 |
| Active Idle | 0 | 0 | |

| Target Load | Actual Load | ssj_ops | |
|---|---|---|---|
| Target | Actual | ||
| Calibration 1 | 5,780,723 | ||
| Calibration 2 | 5,779,647 | ||
| Calibration 3 | 5,780,816 | ||
| ssj_ops@calibrated=5,780,231 | |||
| 100% | 99.8% | 5,780,231 | 5,769,683 |
| 90% | 90.0% | 5,202,208 | 5,200,215 |
| 80% | 80.0% | 4,624,185 | 4,621,360 |
| 70% | 70.0% | 4,046,162 | 4,046,093 |
| 60% | 60.0% | 3,468,139 | 3,468,995 |
| 50% | 50.1% | 2,890,116 | 2,894,261 |
| 40% | 40.0% | 2,312,092 | 2,310,788 |
| 30% | 30.1% | 1,734,069 | 1,737,221 |
| 20% | 20.0% | 1,156,046 | 1,157,389 |
| 10% | 10.0% | 578,023 | 578,337 |
| Active Idle | 0 | 0 | |
| Target Load | Actual Load | ssj_ops | |
|---|---|---|---|
| Target | Actual | ||
| Calibration 1 | 5,745,306 | ||
| Calibration 2 | 5,741,931 | ||
| Calibration 3 | 5,743,952 | ||
| ssj_ops@calibrated=5,742,941 | |||
| 100% | 99.7% | 5,742,941 | 5,728,344 |
| 90% | 90.0% | 5,168,647 | 5,167,897 |
| 80% | 80.0% | 4,594,353 | 4,594,847 |
| 70% | 70.0% | 4,020,059 | 4,018,324 |
| 60% | 59.9% | 3,445,765 | 3,442,023 |
| 50% | 49.9% | 2,871,471 | 2,867,070 |
| 40% | 40.0% | 2,297,177 | 2,295,951 |
| 30% | 30.0% | 1,722,882 | 1,724,149 |
| 20% | 20.1% | 1,148,588 | 1,152,504 |
| 10% | 10.0% | 574,294 | 576,423 |
| Active Idle | 0 | 0 | |

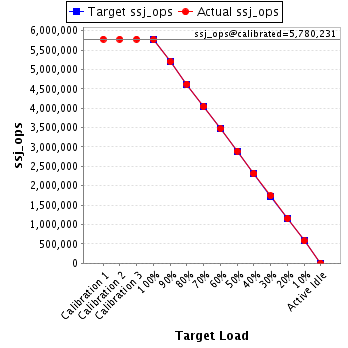
| Target Load | Actual Load | ssj_ops | |
|---|---|---|---|
| Target | Actual | ||
| Calibration 1 | 5,728,621 | ||
| Calibration 2 | 5,718,095 | ||
| Calibration 3 | 5,723,974 | ||
| ssj_ops@calibrated=5,721,034 | |||
| 100% | 99.8% | 5,721,034 | 5,707,208 |
| 90% | 89.8% | 5,148,931 | 5,139,979 |
| 80% | 80.0% | 4,576,828 | 4,574,029 |
| 70% | 70.1% | 4,004,724 | 4,008,923 |
| 60% | 60.0% | 3,432,621 | 3,430,604 |
| 50% | 50.0% | 2,860,517 | 2,861,316 |
| 40% | 40.0% | 2,288,414 | 2,291,157 |
| 30% | 30.0% | 1,716,310 | 1,715,184 |
| 20% | 20.0% | 1,144,207 | 1,146,127 |
| 10% | 10.0% | 572,103 | 572,061 |
| Active Idle | 0 | 0 | |