SPECpower_ssj2008
Aggregate Performance Report
Copyright © 2007-2019 Standard Performance Evaluation Corporation
| Hewlett Packard Enterprise Synergy 480 Gen10 Compute Module | ssj_ops@100% = 40,260,576 ssj_ops@100% per Host = 5,751,511 ssj_ops@100% per JVM = 1,437,878 |
||||
| Test Sponsor: | Hewlett Packard Enterprise | SPEC License #: | 3 | Test Method: | Multi Node |
| Tested By: | Hewlett Packard Enterprise | Test Location: | Houston, TX, USA | Test Date: | Mar 26, 2019 |
| Hardware Availability: | Apr-2019 | Software Availability: | Mar-2019 | Publication: | May 8, 2019 |
| System Source: | Single Supplier | System Designation: | Server | Power Provisioning: | Line-powered |
| Target Load | Actual Load | ssj_ops | |
|---|---|---|---|
| Target | Actual | ||
| Calibration 1 | 40,404,292 | ||
| Calibration 2 | 40,355,716 | ||
| Calibration 3 | 40,400,828 | ||
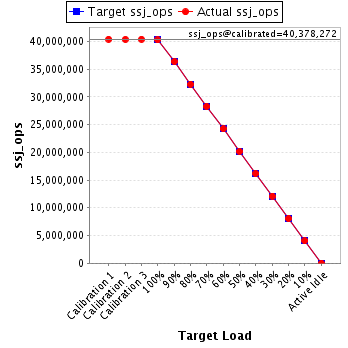
| ssj_ops@calibrated=40,378,272 | |||
| 100% | 99.7% | 40,378,272 | 40,260,576 |
| 90% | 90.0% | 36,340,445 | 36,360,267 |
| 80% | 80.0% | 32,302,618 | 32,294,648 |
| 70% | 70.0% | 28,264,791 | 28,280,313 |
| 60% | 60.0% | 24,226,963 | 24,232,335 |
| 50% | 50.0% | 20,189,136 | 20,188,096 |
| 40% | 40.0% | 16,151,309 | 16,150,322 |
| 30% | 30.0% | 12,113,482 | 12,116,944 |
| 20% | 20.0% | 8,075,654 | 8,074,082 |
| 10% | 10.0% | 4,037,827 | 4,034,982 |
| Active Idle | 0 | 0 | |
| # of Nodes | # of Chips | # of Cores | # of Threads | Total RAM (GB) | # of OS Images | # of JVM Instances |
|---|---|---|---|---|---|---|
| 7 | 14 | 392 | 784 | 1,344 | 7 | 28 |
| Set Identifier: | SUT |
| Set Description: | System Under Test |
| # of Identical Nodes: | 7 |
| Comment: | SUT |
| Hardware per Node | |
|---|---|
| Hardware Vendor: | Hewlett Packard Enterprise |
| Model: | Synergy 480 Gen10 Compute Module |
| Form Factor: | 7U |
| CPU Name: | Intel Xeon Platinum 8280 @ 2.70GHz (Intel Turbo Boost Technology up to 4.00 GHz) |
| CPU Characteristics: | 28-Core, 2.70 GHz, 38.5MB L3 Cache |
| CPU Frequency (MHz): | 2700 |
| CPU(s) Enabled: | 56 cores, 2 chips, 28 cores/chip |
| Hardware Threads: | 112 (2 / core) |
| CPU(s) Orderable: | 1,2 chips |
| Primary Cache: | 32 KB I + 32 KB D on chip per core |
| Secondary Cache: | 1 MB I+D on chip per core |
| Tertiary Cache: | 39424 KB I+D on chip per chip |
| Other Cache: | None |
| Memory Amount (GB): | 192 |
| # and size of DIMM: | 12 x 16384 MB |
| Memory Details: | 12 x 16GB 2Rx8 PC4-2933Y-R; slots 1, 3, 5, 8, 10 and 12 populated in each socket |
| Power Supply Quantity and Rating (W): | None |
| Power Supply Details: | N/A |
| Disk Drive: | 1 x HPE 240GB 6G SATA M.2 SSD (875488-B21) |
| Disk Controller: | HPE Smart Array S100i SR Gen10 |
| # and type of Network Interface Cards (NICs) Installed: | 1 x HPE Synergy 3820C 10/20Gb CNA |
| NICs Enabled in Firmware / OS / Connected: | 2/2/1 |
| Network Speed (Mbit): | 1000 |
| Keyboard: | None |
| Mouse: | None |
| Monitor: | None |
| Optical Drives: | No |
| Other Hardware: | H/S: Standard |
| Software per Node | |
|---|---|
| Power Management: | Enabled (see SUT Notes) |
| Operating System (OS): | Windows Server 2012 R2 Datacenter |
| OS Version: | Version 6.3 (Build 9600) |
| Filesystem: | NTFS |
| JVM Vendor: | Oracle Corporation |
| JVM Version: | Oracle Java HotSpot(TM) 64-Bit Server VM (build 24.80-b11, mixed mode), version 1.7.0_80 |
| JVM Command-line Options: | -server -Xmn21000m -Xms24000m -Xmx24000m -XX:SurvivorRatio=1 -XX:TargetSurvivorRatio=99 -XX:AllocatePrefetchDistance=256 -XX:AllocatePrefetchLines=4 -XX:LoopUnrollLimit=45 -XX:InitialTenuringThreshold=12 -XX:MaxTenuringThreshold=15 -XX:ParallelGCThreads=28 -XX:InlineSmallCode=3900 -XX:MaxInlineSize=270 -XX:FreqInlineSize=2500 -XX:+AggressiveOpts -XX:+UseLargePages -XX:+UseParallelOldGC |
| JVM Affinity: | start /NODE [0,1,2,3] /AFFINITY [0xFFFFFFF] |
| JVM Instances: | 4 |
| JVM Initial Heap (MB): | 21000 |
| JVM Maximum Heap (MB): | 21000 |
| JVM Address Bits: | 64 |
| Boot Firmware Version: | I42 v2.00 (02/02/2019) |
| Management Firmware Version: | 1.40 Feb 05 2019 |
| Workload Version: | SSJ 1.2.10 |
| Director Location: | Controller |
| Other Software: | HPE Service Pack for ProLiant (SPP) Version: 2019.03.0, Microsoft Windows KB4056898, KB4338815 |
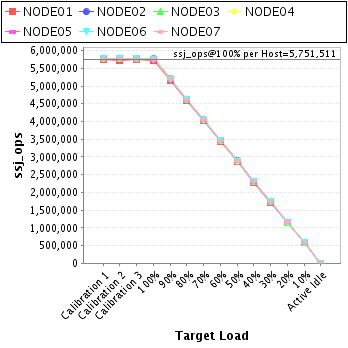
| Host | ssj_ops@100% |
|---|---|
| NODE01 | 5,718,775 |
| NODE02 | 5,765,811 |
| NODE03 | 5,764,439 |
| NODE04 | 5,758,612 |
| NODE05 | 5,742,436 |
| NODE06 | 5,758,661 |
| NODE07 | 5,751,844 |
| ssj_ops@100% | 40,260,576 |
| ssj_ops@100% per Host | 5,751,511 |
| ssj_ops@100% per JVM | 1,437,878 |
| Target Load | Actual Load | ssj_ops | |
|---|---|---|---|
| Target | Actual | ||
| Calibration 1 | 5,745,563 | ||
| Calibration 2 | 5,732,335 | ||
| Calibration 3 | 5,743,035 | ||
| ssj_ops@calibrated=5,737,685 | |||
| 100% | 99.7% | 5,737,685 | 5,718,775 |
| 90% | 90.0% | 5,163,916 | 5,164,966 |
| 80% | 80.0% | 4,590,148 | 4,591,336 |
| 70% | 70.0% | 4,016,379 | 4,014,875 |
| 60% | 60.0% | 3,442,611 | 3,440,838 |
| 50% | 49.9% | 2,868,842 | 2,864,477 |
| 40% | 39.9% | 2,295,074 | 2,290,689 |
| 30% | 30.0% | 1,721,305 | 1,721,201 |
| 20% | 20.0% | 1,147,537 | 1,145,764 |
| 10% | 10.0% | 573,768 | 574,361 |
| Active Idle | 0 | 0 | |

| Target Load | Actual Load | ssj_ops | |
|---|---|---|---|
| Target | Actual | ||
| Calibration 1 | 5,783,314 | ||
| Calibration 2 | 5,783,151 | ||
| Calibration 3 | 5,786,209 | ||
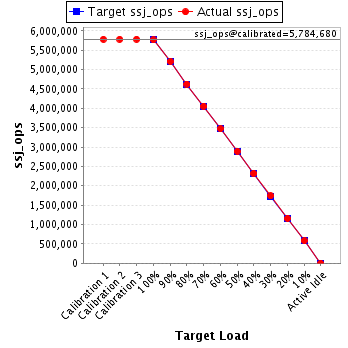
| ssj_ops@calibrated=5,784,680 | |||
| 100% | 99.7% | 5,784,680 | 5,765,811 |
| 90% | 90.1% | 5,206,212 | 5,211,463 |
| 80% | 80.0% | 4,627,744 | 4,627,903 |
| 70% | 70.2% | 4,049,276 | 4,059,770 |
| 60% | 60.0% | 3,470,808 | 3,469,480 |
| 50% | 50.0% | 2,892,340 | 2,892,819 |
| 40% | 40.1% | 2,313,872 | 2,317,314 |
| 30% | 30.0% | 1,735,404 | 1,737,472 |
| 20% | 20.0% | 1,156,936 | 1,157,789 |
| 10% | 10.0% | 578,468 | 579,733 |
| Active Idle | 0 | 0 | |
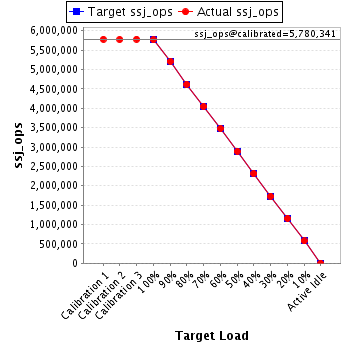
| Target Load | Actual Load | ssj_ops | |
|---|---|---|---|
| Target | Actual | ||
| Calibration 1 | 5,782,188 | ||
| Calibration 2 | 5,776,534 | ||
| Calibration 3 | 5,784,149 | ||
| ssj_ops@calibrated=5,780,341 | |||
| 100% | 99.7% | 5,780,341 | 5,764,439 |
| 90% | 90.1% | 5,202,307 | 5,209,513 |
| 80% | 79.9% | 4,624,273 | 4,616,102 |
| 70% | 70.1% | 4,046,239 | 4,050,948 |
| 60% | 60.1% | 3,468,205 | 3,474,064 |
| 50% | 50.0% | 2,890,171 | 2,889,977 |
| 40% | 40.0% | 2,312,136 | 2,311,034 |
| 30% | 30.0% | 1,734,102 | 1,732,351 |
| 20% | 20.0% | 1,156,068 | 1,157,864 |
| 10% | 10.0% | 578,034 | 575,952 |
| Active Idle | 0 | 0 | |
| Target Load | Actual Load | ssj_ops | |
|---|---|---|---|
| Target | Actual | ||
| Calibration 1 | 5,783,239 | ||
| Calibration 2 | 5,773,430 | ||
| Calibration 3 | 5,778,057 | ||
| ssj_ops@calibrated=5,775,744 | |||
| 100% | 99.7% | 5,775,744 | 5,758,612 |
| 90% | 90.1% | 5,198,169 | 5,202,997 |
| 80% | 80.1% | 4,620,595 | 4,624,310 |
| 70% | 70.0% | 4,043,020 | 4,044,286 |
| 60% | 60.0% | 3,465,446 | 3,466,279 |
| 50% | 50.0% | 2,887,872 | 2,885,104 |
| 40% | 40.1% | 2,310,297 | 2,314,142 |
| 30% | 30.1% | 1,732,723 | 1,736,925 |
| 20% | 20.0% | 1,155,149 | 1,155,715 |
| 10% | 10.0% | 577,574 | 577,073 |
| Active Idle | 0 | 0 | |

| Target Load | Actual Load | ssj_ops | |
|---|---|---|---|
| Target | Actual | ||
| Calibration 1 | 5,764,944 | ||
| Calibration 2 | 5,753,847 | ||
| Calibration 3 | 5,761,188 | ||
| ssj_ops@calibrated=5,757,517 | |||
| 100% | 99.7% | 5,757,517 | 5,742,436 |
| 90% | 90.0% | 5,181,766 | 5,180,193 |
| 80% | 79.9% | 4,606,014 | 4,602,675 |
| 70% | 70.0% | 4,030,262 | 4,027,924 |
| 60% | 60.0% | 3,454,510 | 3,456,111 |
| 50% | 50.1% | 2,878,759 | 2,884,013 |
| 40% | 40.0% | 2,303,007 | 2,300,602 |
| 30% | 29.9% | 1,727,255 | 1,723,164 |
| 20% | 20.0% | 1,151,503 | 1,153,884 |
| 10% | 10.0% | 575,752 | 576,981 |
| Active Idle | 0 | 0 | |

| Target Load | Actual Load | ssj_ops | |
|---|---|---|---|
| Target | Actual | ||
| Calibration 1 | 5,776,666 | ||
| Calibration 2 | 5,770,790 | ||
| Calibration 3 | 5,774,512 | ||
| ssj_ops@calibrated=5,772,651 | |||
| 100% | 99.8% | 5,772,651 | 5,758,661 |
| 90% | 90.0% | 5,195,386 | 5,195,478 |
| 80% | 79.9% | 4,618,121 | 4,612,670 |
| 70% | 70.0% | 4,040,856 | 4,039,897 |
| 60% | 60.0% | 3,463,591 | 3,463,286 |
| 50% | 49.9% | 2,886,325 | 2,879,418 |
| 40% | 40.0% | 2,309,060 | 2,309,239 |
| 30% | 30.0% | 1,731,795 | 1,733,935 |
| 20% | 19.9% | 1,154,530 | 1,148,912 |
| 10% | 10.0% | 577,265 | 576,636 |
| Active Idle | 0 | 0 | |

| Target Load | Actual Load | ssj_ops | |
|---|---|---|---|
| Target | Actual | ||
| Calibration 1 | 5,768,377 | ||
| Calibration 2 | 5,765,629 | ||
| Calibration 3 | 5,773,679 | ||
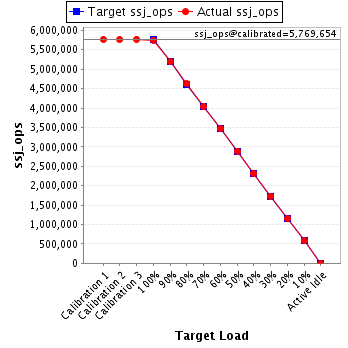
| ssj_ops@calibrated=5,769,654 | |||
| 100% | 99.7% | 5,769,654 | 5,751,844 |
| 90% | 90.1% | 5,192,689 | 5,195,656 |
| 80% | 80.1% | 4,615,723 | 4,619,650 |
| 70% | 70.1% | 4,038,758 | 4,042,611 |
| 60% | 60.0% | 3,461,793 | 3,462,278 |
| 50% | 50.1% | 2,884,827 | 2,892,286 |
| 40% | 40.0% | 2,307,862 | 2,307,301 |
| 30% | 30.0% | 1,730,896 | 1,731,896 |
| 20% | 20.0% | 1,153,931 | 1,154,154 |
| 10% | 10.0% | 576,965 | 574,246 |
| Active Idle | 0 | 0 | |