SPECpower_ssj2008
Aggregate Performance Report
Copyright © 2007-2017 Standard Performance Evaluation Corporation
| Lenovo Global Technology ThinkSystem SN550 | ssj_ops@100% = 69,444,875 ssj_ops@100% per Host = 4,960,348 ssj_ops@100% per JVM = 88,578 |
||||
| Test Sponsor: | Lenovo Global Technology | SPEC License #: | 9017 | Test Method: | Multi Node |
| Tested By: | Lenovo Global Technology | Test Location: | Beijing, Beijing, China | Test Date: | Oct 11, 2017 |
| Hardware Availability: | Aug-2017 | Software Availability: | Jan-2015 | Publication: | Oct 25, 2017 |
| System Source: | Single Supplier | System Designation: | Server | Power Provisioning: | Line-powered |
| Target Load | Actual Load | ssj_ops | |
|---|---|---|---|
| Target | Actual | ||
| Calibration 1 | 72,209,805 | ||
| Calibration 2 | 70,759,563 | ||
| Calibration 3 | 69,604,289 | ||
| ssj_ops@calibrated=70,181,926 | |||
| 100% | 98.9% | 70,181,926 | 69,444,875 |
| 90% | 90.4% | 63,163,733 | 63,423,606 |
| 80% | 80.0% | 56,145,541 | 56,133,230 |
| 70% | 70.0% | 49,127,348 | 49,103,697 |
| 60% | 60.0% | 42,109,156 | 42,106,531 |
| 50% | 50.0% | 35,090,963 | 35,092,867 |
| 40% | 40.0% | 28,072,770 | 28,058,777 |
| 30% | 30.0% | 21,054,578 | 21,048,948 |
| 20% | 20.0% | 14,036,385 | 14,027,225 |
| 10% | 10.0% | 7,018,193 | 7,011,604 |
| Active Idle | 0 | 0 | |

| # of Nodes | # of Chips | # of Cores | # of Threads | Total RAM (GB) | # of OS Images | # of JVM Instances |
|---|---|---|---|---|---|---|
| 14 | 28 | 784 | 1,568 | 2,688 | 14 | 784 |
| Set Identifier: | sut |
| Set Description: | System Under Test |
| # of Identical Nodes: | 14 |
| Comment: | 'SUT' |
| Hardware per Node | |
|---|---|
| Hardware Vendor: | Lenovo Global Technology |
| Model: | ThinkSystem SN550 |
| Form Factor: | 10U |
| CPU Name: | Intel Xeon Platinum 8176 |
| CPU Characteristics: | 28 Core, 2.10GHz, 38.5MB L3 Cache |
| CPU Frequency (MHz): | 2100 |
| CPU(s) Enabled: | 56 cores, 2 chips, 28 cores/chip |
| Hardware Threads: | 112 (2 / core) |
| CPU(s) Orderable: | 1,2 chips |
| Primary Cache: | 32 KB I + 32 KB D on chip per core |
| Secondary Cache: | 1 MB I+D on chip per core |
| Tertiary Cache: | 39424 KB I+D on chip per chip |
| Other Cache: | None |
| Memory Amount (GB): | 192 |
| # and size of DIMM: | 12 x 16 GB |
| Memory Details: | 16GB 2Rx8 PC4-2666V-RE1-12-MA0; slots 1,3,5,8,10,12,13,15,17,20,22 and 24 for each processor |
| Power Supply Quantity and Rating (W): | None |
| Power Supply Details: | Shared |
| Disk Drive: | 1 x 32GB M.2 SSD (Lenovo P/N SSD7A20774) |
| Disk Controller: | Integrated SATA controller |
| # and type of Network Interface Cards (NICs) Installed: | 1 x Intel Ethernet Connection X722 for 10GBASE-T |
| NICs Enabled in Firmware / OS / Connected: | 1/1/1 |
| Network Speed (Mbit): | 10000 |
| Keyboard: | None |
| Mouse: | None |
| Monitor: | None |
| Optical Drives: | No |
| Other Hardware: | None |
| Software per Node | |
|---|---|
| Power Management: | Enabled (see SUT Notes) |
| Operating System (OS): | Microsoft Windows Server 2012 R2 DataCenter |
| OS Version: | Version 6.3.9600 (Build 9600) |
| Filesystem: | NTFS |
| JVM Vendor: | Oracle Corporation |
| JVM Version: | Oracle Java HotSpot(TM) 64-Bit Server VM (build 24.80-b11, mixed mode), version 1.7.0_80 |
| JVM Command-line Options: | -server -Xss256k -Xmn1300m -Xms1550m -Xmx1550m -XX:SurvivorRatio=1 -XX:TargetSurvivorRatio=99 -XX:AllocatePrefetchDistance=256 -XX:AllocatePrefetchLines=4 -XX:LoopUnrollLimit=45 -XX:InitialTenuringThreshold=12 -XX:MaxTenuringThreshold=15 -XX:ParallelGCThreads=2 -XX:InlineSmallCode=3900 -XX:MaxInlineSize=270 -XX:FreqInlineSize=2500 -XX:+AggressiveOpts -XX:+UseLargePages -XX:+UseParallelOldGC |
| JVM Affinity: | start /NODE[0,2] /AFFINITY[3,C,30,C0,C000,30000,C0000,30000000,C0000000,300000000,C00000000,C0000000000,300000000000,C00000000000];start /NODE[1,3] /AFFINITY[3,C,30,3000,C000,30000,C0000,300000000,C0000000,300000000,30000000000,C0000000000,300000000000,C00000000000] |
| JVM Instances: | 56 |
| JVM Initial Heap (MB): | 1550 |
| JVM Maximum Heap (MB): | 1550 |
| JVM Address Bits: | 64 |
| Boot Firmware Version: | IVE111C |
| Management Firmware Version: | TEI307N |
| Workload Version: | SSJ 1.2.10 |
| Director Location: | Controller |
| Other Software: | None |
| Host | ssj_ops@100% |
|---|---|
| L1-179 | 4,953,628 |
| L2-181 | 4,919,972 |
| L3-183 | 5,022,685 |
| L5-187 | 4,979,076 |
| L6-189 | 4,981,072 |
| L7-185 | 4,949,554 |
| L7-191 | 4,926,381 |
| R2-180 | 4,956,838 |
| R2-182 | 4,987,903 |
| R3-184 | 4,923,150 |
| R4-186 | 4,932,566 |
| R5-188 | 5,031,220 |
| R6-190 | 4,938,091 |
| R7-192 | 4,942,739 |
| ssj_ops@100% | 69,444,875 |
| ssj_ops@100% per Host | 4,960,348 |
| ssj_ops@100% per JVM | 88,578 |

| Target Load | Actual Load | ssj_ops | |
|---|---|---|---|
| Target | Actual | ||
| Calibration 1 | 5,154,719 | ||
| Calibration 2 | 5,016,546 | ||
| Calibration 3 | 4,937,660 | ||
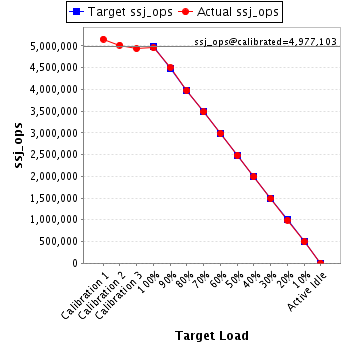
| ssj_ops@calibrated=4,977,103 | |||
| 100% | 99.5% | 4,977,103 | 4,953,628 |
| 90% | 90.4% | 4,479,393 | 4,500,056 |
| 80% | 79.9% | 3,981,682 | 3,974,635 |
| 70% | 69.9% | 3,483,972 | 3,479,969 |
| 60% | 59.9% | 2,986,262 | 2,983,584 |
| 50% | 49.9% | 2,488,551 | 2,482,099 |
| 40% | 40.0% | 1,990,841 | 1,990,980 |
| 30% | 30.0% | 1,493,131 | 1,491,635 |
| 20% | 20.0% | 995,421 | 993,347 |
| 10% | 10.0% | 497,710 | 498,781 |
| Active Idle | 0 | 0 | |
| Target Load | Actual Load | ssj_ops | |
|---|---|---|---|
| Target | Actual | ||
| Calibration 1 | 5,139,623 | ||
| Calibration 2 | 4,986,557 | ||
| Calibration 3 | 4,959,050 | ||
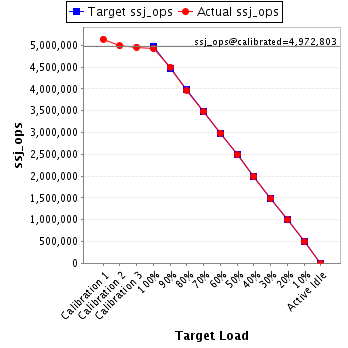
| ssj_ops@calibrated=4,972,803 | |||
| 100% | 98.9% | 4,972,803 | 4,919,972 |
| 90% | 90.5% | 4,475,523 | 4,499,368 |
| 80% | 79.9% | 3,978,243 | 3,972,202 |
| 70% | 69.9% | 3,480,962 | 3,476,162 |
| 60% | 60.0% | 2,983,682 | 2,983,488 |
| 50% | 50.0% | 2,486,402 | 2,486,952 |
| 40% | 40.0% | 1,989,121 | 1,989,008 |
| 30% | 30.0% | 1,491,841 | 1,491,000 |
| 20% | 20.0% | 994,561 | 994,811 |
| 10% | 9.9% | 497,280 | 494,424 |
| Active Idle | 0 | 0 | |
| Target Load | Actual Load | ssj_ops | |
|---|---|---|---|
| Target | Actual | ||
| Calibration 1 | 5,206,462 | ||
| Calibration 2 | 5,108,603 | ||
| Calibration 3 | 5,027,575 | ||
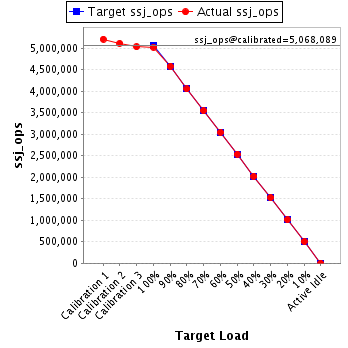
| ssj_ops@calibrated=5,068,089 | |||
| 100% | 99.1% | 5,068,089 | 5,022,685 |
| 90% | 90.3% | 4,561,280 | 4,577,772 |
| 80% | 79.9% | 4,054,471 | 4,049,158 |
| 70% | 69.9% | 3,547,662 | 3,544,138 |
| 60% | 60.1% | 3,040,853 | 3,046,077 |
| 50% | 50.0% | 2,534,045 | 2,535,079 |
| 40% | 39.9% | 2,027,236 | 2,022,432 |
| 30% | 30.1% | 1,520,427 | 1,523,625 |
| 20% | 20.0% | 1,013,618 | 1,011,325 |
| 10% | 10.0% | 506,809 | 506,622 |
| Active Idle | 0 | 0 | |
| Target Load | Actual Load | ssj_ops | |
|---|---|---|---|
| Target | Actual | ||
| Calibration 1 | 5,152,163 | ||
| Calibration 2 | 5,027,084 | ||
| Calibration 3 | 4,960,032 | ||
| ssj_ops@calibrated=4,993,558 | |||
| 100% | 99.7% | 4,993,558 | 4,979,076 |
| 90% | 90.4% | 4,494,202 | 4,513,128 |
| 80% | 80.0% | 3,994,846 | 3,992,852 |
| 70% | 70.0% | 3,495,490 | 3,494,908 |
| 60% | 59.9% | 2,996,135 | 2,989,068 |
| 50% | 50.1% | 2,496,779 | 2,503,881 |
| 40% | 39.9% | 1,997,423 | 1,993,227 |
| 30% | 30.0% | 1,498,067 | 1,498,288 |
| 20% | 19.9% | 998,712 | 994,580 |
| 10% | 10.0% | 499,356 | 498,718 |
| Active Idle | 0 | 0 | |
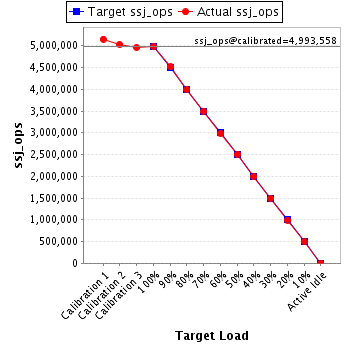
| Target Load | Actual Load | ssj_ops | |
|---|---|---|---|
| Target | Actual | ||
| Calibration 1 | 5,164,935 | ||
| Calibration 2 | 5,080,897 | ||
| Calibration 3 | 5,001,350 | ||
| ssj_ops@calibrated=5,041,123 | |||
| 100% | 98.8% | 5,041,123 | 4,981,072 |
| 90% | 90.5% | 4,537,011 | 4,560,330 |
| 80% | 80.1% | 4,032,899 | 4,038,353 |
| 70% | 70.1% | 3,528,786 | 3,531,345 |
| 60% | 60.1% | 3,024,674 | 3,031,246 |
| 50% | 50.0% | 2,520,562 | 2,519,316 |
| 40% | 40.0% | 2,016,449 | 2,017,357 |
| 30% | 30.0% | 1,512,337 | 1,512,210 |
| 20% | 20.0% | 1,008,225 | 1,008,857 |
| 10% | 10.0% | 504,112 | 503,576 |
| Active Idle | 0 | 0 | |
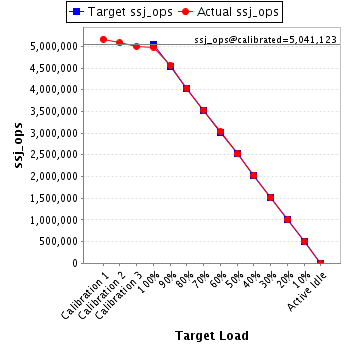
| Target Load | Actual Load | ssj_ops | |
|---|---|---|---|
| Target | Actual | ||
| Calibration 1 | 5,147,612 | ||
| Calibration 2 | 5,058,922 | ||
| Calibration 3 | 4,966,837 | ||
| ssj_ops@calibrated=5,012,879 | |||
| 100% | 98.7% | 5,012,879 | 4,949,554 |
| 90% | 90.4% | 4,511,591 | 4,531,569 |
| 80% | 80.0% | 4,010,303 | 4,010,627 |
| 70% | 70.0% | 3,509,016 | 3,511,078 |
| 60% | 60.1% | 3,007,728 | 3,013,191 |
| 50% | 50.1% | 2,506,440 | 2,509,825 |
| 40% | 40.0% | 2,005,152 | 2,006,669 |
| 30% | 30.0% | 1,503,864 | 1,503,143 |
| 20% | 20.0% | 1,002,576 | 1,001,931 |
| 10% | 10.0% | 501,288 | 499,715 |
| Active Idle | 0 | 0 | |

| Target Load | Actual Load | ssj_ops | |
|---|---|---|---|
| Target | Actual | ||
| Calibration 1 | 5,148,756 | ||
| Calibration 2 | 5,028,088 | ||
| Calibration 3 | 4,950,759 | ||
| ssj_ops@calibrated=4,989,424 | |||
| 100% | 98.7% | 4,989,424 | 4,926,381 |
| 90% | 90.5% | 4,490,481 | 4,514,296 |
| 80% | 80.0% | 3,991,539 | 3,993,555 |
| 70% | 70.0% | 3,492,597 | 3,493,453 |
| 60% | 60.0% | 2,993,654 | 2,995,816 |
| 50% | 50.0% | 2,494,712 | 2,494,574 |
| 40% | 40.0% | 1,995,770 | 1,993,406 |
| 30% | 30.0% | 1,496,827 | 1,497,748 |
| 20% | 20.0% | 997,885 | 996,974 |
| 10% | 10.0% | 498,942 | 498,166 |
| Active Idle | 0 | 0 | |

| Target Load | Actual Load | ssj_ops | |
|---|---|---|---|
| Target | Actual | ||
| Calibration 1 | 5,162,777 | ||
| Calibration 2 | 5,071,281 | ||
| Calibration 3 | 4,934,968 | ||
| ssj_ops@calibrated=5,003,125 | |||
| 100% | 99.1% | 5,003,125 | 4,956,838 |
| 90% | 90.4% | 4,502,812 | 4,521,006 |
| 80% | 79.9% | 4,002,500 | 3,998,707 |
| 70% | 70.0% | 3,502,187 | 3,500,896 |
| 60% | 60.0% | 3,001,875 | 3,000,362 |
| 50% | 50.0% | 2,501,562 | 2,499,771 |
| 40% | 40.0% | 2,001,250 | 1,999,273 |
| 30% | 29.9% | 1,500,937 | 1,494,492 |
| 20% | 19.9% | 1,000,625 | 998,095 |
| 10% | 10.0% | 500,312 | 502,239 |
| Active Idle | 0 | 0 | |
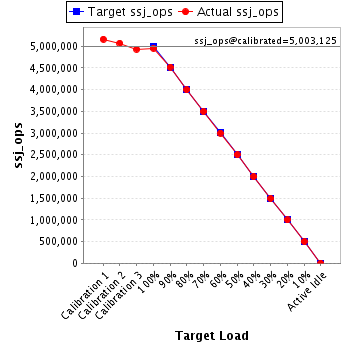
| Target Load | Actual Load | ssj_ops | |
|---|---|---|---|
| Target | Actual | ||
| Calibration 1 | 5,144,141 | ||
| Calibration 2 | 5,098,823 | ||
| Calibration 3 | 5,000,739 | ||
| ssj_ops@calibrated=5,049,781 | |||
| 100% | 98.8% | 5,049,781 | 4,987,903 |
| 90% | 90.4% | 4,544,803 | 4,565,778 |
| 80% | 80.2% | 4,039,825 | 4,050,160 |
| 70% | 70.0% | 3,534,847 | 3,534,362 |
| 60% | 59.9% | 3,029,869 | 3,024,155 |
| 50% | 50.0% | 2,524,890 | 2,523,447 |
| 40% | 39.9% | 2,019,912 | 2,017,287 |
| 30% | 30.0% | 1,514,934 | 1,515,449 |
| 20% | 20.0% | 1,009,956 | 1,009,054 |
| 10% | 10.0% | 504,978 | 503,447 |
| Active Idle | 0 | 0 | |
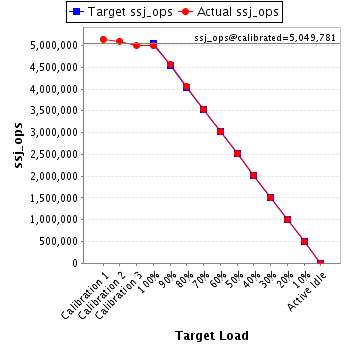
| Target Load | Actual Load | ssj_ops | |
|---|---|---|---|
| Target | Actual | ||
| Calibration 1 | 5,102,357 | ||
| Calibration 2 | 5,053,678 | ||
| Calibration 3 | 4,976,496 | ||
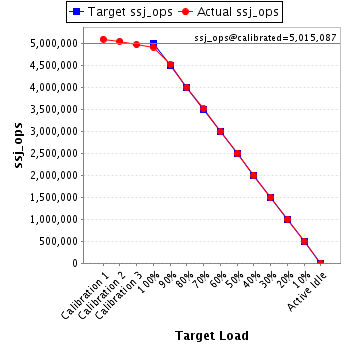
| ssj_ops@calibrated=5,015,087 | |||
| 100% | 98.2% | 5,015,087 | 4,923,150 |
| 90% | 90.2% | 4,513,578 | 4,525,768 |
| 80% | 79.9% | 4,012,069 | 4,007,687 |
| 70% | 70.1% | 3,510,561 | 3,515,351 |
| 60% | 59.9% | 3,009,052 | 3,004,541 |
| 50% | 50.0% | 2,507,543 | 2,509,424 |
| 40% | 40.0% | 2,006,035 | 2,004,551 |
| 30% | 30.0% | 1,504,526 | 1,502,241 |
| 20% | 20.1% | 1,003,017 | 1,006,162 |
| 10% | 10.0% | 501,509 | 501,561 |
| Active Idle | 0 | 0 | |
| Target Load | Actual Load | ssj_ops | |
|---|---|---|---|
| Target | Actual | ||
| Calibration 1 | 5,132,351 | ||
| Calibration 2 | 5,063,585 | ||
| Calibration 3 | 4,938,164 | ||
| ssj_ops@calibrated=5,000,874 | |||
| 100% | 98.6% | 5,000,874 | 4,932,566 |
| 90% | 90.4% | 4,500,787 | 4,521,614 |
| 80% | 80.0% | 4,000,700 | 3,998,607 |
| 70% | 69.8% | 3,500,612 | 3,491,380 |
| 60% | 59.9% | 3,000,525 | 2,997,945 |
| 50% | 49.9% | 2,500,437 | 2,496,226 |
| 40% | 40.0% | 2,000,350 | 1,998,939 |
| 30% | 30.0% | 1,500,262 | 1,500,292 |
| 20% | 20.1% | 1,000,175 | 1,003,828 |
| 10% | 10.0% | 500,087 | 501,328 |
| Active Idle | 0 | 0 | |

| Target Load | Actual Load | ssj_ops | |
|---|---|---|---|
| Target | Actual | ||
| Calibration 1 | 5,254,128 | ||
| Calibration 2 | 5,043,106 | ||
| Calibration 3 | 5,040,954 | ||
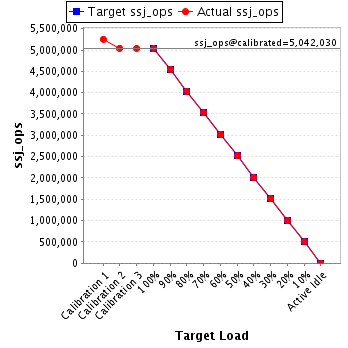
| ssj_ops@calibrated=5,042,030 | |||
| 100% | 99.8% | 5,042,030 | 5,031,220 |
| 90% | 90.3% | 4,537,827 | 4,551,714 |
| 80% | 80.1% | 4,033,624 | 4,038,812 |
| 70% | 70.0% | 3,529,421 | 3,527,937 |
| 60% | 60.0% | 3,025,218 | 3,024,941 |
| 50% | 50.0% | 2,521,015 | 2,520,201 |
| 40% | 39.9% | 2,016,812 | 2,012,313 |
| 30% | 30.0% | 1,512,609 | 1,512,791 |
| 20% | 20.0% | 1,008,406 | 1,007,033 |
| 10% | 10.0% | 504,203 | 503,309 |
| Active Idle | 0 | 0 | |
| Target Load | Actual Load | ssj_ops | |
|---|---|---|---|
| Target | Actual | ||
| Calibration 1 | 5,146,745 | ||
| Calibration 2 | 5,082,220 | ||
| Calibration 3 | 4,938,875 | ||
| ssj_ops@calibrated=5,010,547 | |||
| 100% | 98.6% | 5,010,547 | 4,938,091 |
| 90% | 90.3% | 4,509,493 | 4,526,498 |
| 80% | 79.9% | 4,008,438 | 4,002,029 |
| 70% | 70.0% | 3,507,383 | 3,507,152 |
| 60% | 60.0% | 3,006,328 | 3,006,201 |
| 50% | 50.0% | 2,505,274 | 2,505,705 |
| 40% | 40.1% | 2,004,219 | 2,010,029 |
| 30% | 30.1% | 1,503,164 | 1,506,857 |
| 20% | 20.0% | 1,002,109 | 1,000,301 |
| 10% | 10.0% | 501,055 | 500,614 |
| Active Idle | 0 | 0 | |

| Target Load | Actual Load | ssj_ops | |
|---|---|---|---|
| Target | Actual | ||
| Calibration 1 | 5,153,037 | ||
| Calibration 2 | 5,040,174 | ||
| Calibration 3 | 4,970,830 | ||
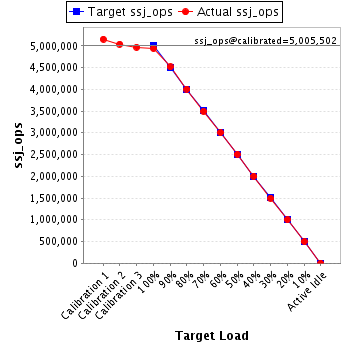
| ssj_ops@calibrated=5,005,502 | |||
| 100% | 98.7% | 5,005,502 | 4,942,739 |
| 90% | 90.2% | 4,504,952 | 4,514,710 |
| 80% | 80.0% | 4,004,402 | 4,005,846 |
| 70% | 69.8% | 3,503,851 | 3,495,566 |
| 60% | 60.1% | 3,003,301 | 3,005,915 |
| 50% | 50.1% | 2,502,751 | 2,506,368 |
| 40% | 40.0% | 2,002,201 | 2,003,305 |
| 30% | 30.0% | 1,501,651 | 1,499,177 |
| 20% | 20.0% | 1,001,100 | 1,000,928 |
| 10% | 10.0% | 500,550 | 499,106 |
| Active Idle | 0 | 0 | |
