SPECpower_ssj2008
Aggregate Performance Report
Copyright © 2007-2019 Standard Performance Evaluation Corporation
| New H3C Technologies Co., Ltd. H3C UniServer B5700 G3 | ssj_ops@100% = 56,910,872 ssj_ops@100% per Host = 5,691,087 ssj_ops@100% per JVM = 1,422,772 |
||||
| Test Sponsor: | New H3C Technologies Co., Ltd. | SPEC License #: | 9066 | Test Method: | Multi Node |
| Tested By: | New H3C Technologies Co., Ltd. | Test Location: | Hangzhou, Zhejiang, China | Test Date: | May 15, 2019 |
| Hardware Availability: | Jan-2019 | Software Availability: | Jan-2019 | Publication: | Jun 12, 2019 |
| System Source: | Single Supplier | System Designation: | Server | Power Provisioning: | Line-powered |
| Target Load | Actual Load | ssj_ops | |
|---|---|---|---|
| Target | Actual | ||
| Calibration 1 | 56,996,323 | ||
| Calibration 2 | 56,937,605 | ||
| Calibration 3 | 57,057,380 | ||
| ssj_ops@calibrated=56,997,492 | |||
| 100% | 99.8% | 56,997,492 | 56,910,872 |
| 90% | 90.0% | 51,297,743 | 51,293,448 |
| 80% | 80.0% | 45,597,994 | 45,589,854 |
| 70% | 70.0% | 39,898,245 | 39,906,678 |
| 60% | 60.0% | 34,198,495 | 34,193,267 |
| 50% | 50.0% | 28,498,746 | 28,498,665 |
| 40% | 40.0% | 22,798,997 | 22,777,032 |
| 30% | 30.0% | 17,099,248 | 17,095,740 |
| 20% | 20.0% | 11,399,498 | 11,399,284 |
| 10% | 10.0% | 5,699,749 | 5,701,434 |
| Active Idle | 0 | 0 | |

| # of Nodes | # of Chips | # of Cores | # of Threads | Total RAM (GB) | # of OS Images | # of JVM Instances |
|---|---|---|---|---|---|---|
| 10 | 20 | 560 | 1,120 | 1,920 | 10 | 40 |
| Set Identifier: | sut |
| Set Description: | System Under Test |
| # of Identical Nodes: | 10 |
| Comment: | SUT |
| Hardware per Node | |
|---|---|
| Hardware Vendor: | New H3C Technologies Co., Ltd. |
| Model: | H3C UniServer B5700 G3 |
| Form Factor: | Other |
| CPU Name: | Intel Xeon Platinum 8180 2.50GHz |
| CPU Characteristics: | 28-Core, 2.50 GHz, 38.5 MB L3 Cache |
| CPU Frequency (MHz): | 2500 |
| CPU(s) Enabled: | 56 cores, 2 chips, 28 cores/chip |
| Hardware Threads: | 112 (2 / core) |
| CPU(s) Orderable: | 1,2 chips |
| Primary Cache: | 32 KB I + 32 KB D on chip per core |
| Secondary Cache: | 1 MB I+D on chip per core |
| Tertiary Cache: | 39424 KB I+D on chip per chip |
| Other Cache: | None |
| Memory Amount (GB): | 192.0 |
| # and size of DIMM: | 12 x 16384 MB |
| Memory Details: | 12 x 16GB 2Rx8 PC4-2666-V ECC;slots A1, A2, A3, A4, A5, A6, B1, B2, B3, B4, B5, B6 populated |
| Power Supply Quantity and Rating (W): | None |
| Power Supply Details: | Shared |
| Disk Drive: | SATA DOM 128GB P/N DESSH-A28D09BCADCA |
| Disk Controller: | Integrated SATA controller |
| # and type of Network Interface Cards (NICs) Installed: | 1 x Intel I350 Gigabit Ethernet Controller |
| NICs Enabled in Firmware / OS / Connected: | 2/2/1 |
| Network Speed (Mbit): | 1000 |
| Keyboard: | None |
| Mouse: | None |
| Monitor: | None |
| Optical Drives: | No |
| Other Hardware: | None |
| Software per Node | |
|---|---|
| Power Management: | Balanced Mode enabled in OS (see SUT Notes) |
| Operating System (OS): | Microsoft Windows Server 2012 R2 Datacenter |
| OS Version: | Version 6.3 (Build 9600) |
| Filesystem: | NTFS |
| JVM Vendor: | Oracle Corporation |
| JVM Version: | Java HotSpot(TM) 64-Bit Server VM (build 24.80-b11, mixed mode), version 1.7.0_80 |
| JVM Command-line Options: | -server -Xmn19g -Xms21g -Xmx21g -XX:SurvivorRatio=1 -XX:TargetSurvivorRatio=99 -XX:ParallelGCThreads=28 -XX:AllocatePrefetchDistance=256 -XX:AllocatePrefetchLines=4 -XX:LoopUnrollLimit=45 -XX:InitialTenuringThreshold=12 -XX:MaxTenuringThreshold=15 -XX:InlineSmallCode=9000 -XX:MaxInlineSize=270 -XX:FreqInlineSize=6000 -XX:+UseLargePages -XX:+UseParallelOldGC -XX:+AggressiveOpts |
| JVM Affinity: | start /NODE [0,2] /AFFINITY [0xFC0FF00FC0FF];start /NODE [1,3] /AFFINITY [0xFF03F00FF03F] |
| JVM Instances: | 4 |
| JVM Initial Heap (MB): | 21000 |
| JVM Maximum Heap (MB): | 21000 |
| JVM Address Bits: | 64 |
| Boot Firmware Version: | 2.00.25 |
| Management Firmware Version: | UIS-OM 1.00.10 |
| Workload Version: | SSJ 1.2.10 |
| Director Location: | Controller |
| Other Software: | Microsoft Windows KB3021910, clearcompressionflag.exe, KB2919355, KB2932046, KB2959977, KB2937592, KB2938439, KB2934018, KB4056898, patched to this test system in May 6, 2019 |
| Host | ssj_ops@100% |
|---|---|
| WIN-SUT101 | 5,688,835 |
| WIN-SUT102 | 5,711,436 |
| WIN-SUT103 | 5,688,854 |
| WIN-SUT104 | 5,666,277 |
| WIN-SUT105 | 5,704,210 |
| WIN-SUT106 | 5,677,961 |
| WIN-SUT107 | 5,699,021 |
| WIN-SUT108 | 5,703,371 |
| WIN-SUT109 | 5,667,214 |
| WIN-SUT110 | 5,703,694 |
| ssj_ops@100% | 56,910,872 |
| ssj_ops@100% per Host | 5,691,087 |
| ssj_ops@100% per JVM | 1,422,772 |
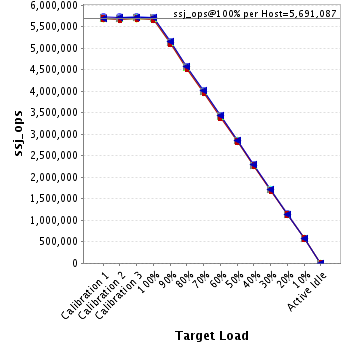
| Target Load | Actual Load | ssj_ops | |
|---|---|---|---|
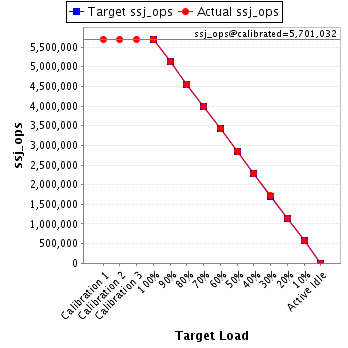
| Target | Actual | ||
| Calibration 1 | 5,703,101 | ||
| Calibration 2 | 5,698,381 | ||
| Calibration 3 | 5,703,683 | ||
| ssj_ops@calibrated=5,701,032 | |||
| 100% | 99.8% | 5,701,032 | 5,688,835 |
| 90% | 90.0% | 5,130,929 | 5,128,371 |
| 80% | 80.0% | 4,560,826 | 4,561,528 |
| 70% | 69.9% | 3,990,722 | 3,984,368 |
| 60% | 59.9% | 3,420,619 | 3,417,500 |
| 50% | 50.0% | 2,850,516 | 2,850,294 |
| 40% | 40.0% | 2,280,413 | 2,280,699 |
| 30% | 30.1% | 1,710,310 | 1,715,677 |
| 20% | 20.0% | 1,140,206 | 1,137,994 |
| 10% | 10.0% | 570,103 | 570,705 |
| Active Idle | 0 | 0 | |
| Target Load | Actual Load | ssj_ops | |
|---|---|---|---|
| Target | Actual | ||
| Calibration 1 | 5,737,847 | ||
| Calibration 2 | 5,725,523 | ||
| Calibration 3 | 5,740,716 | ||
| ssj_ops@calibrated=5,733,119 | |||
| 100% | 99.6% | 5,733,119 | 5,711,436 |
| 90% | 90.0% | 5,159,808 | 5,157,932 |
| 80% | 80.0% | 4,586,496 | 4,584,537 |
| 70% | 69.9% | 4,013,184 | 4,009,359 |
| 60% | 60.1% | 3,439,872 | 3,445,456 |
| 50% | 50.0% | 2,866,560 | 2,864,806 |
| 40% | 40.0% | 2,293,248 | 2,290,405 |
| 30% | 30.0% | 1,719,936 | 1,719,063 |
| 20% | 20.0% | 1,146,624 | 1,149,078 |
| 10% | 10.1% | 573,312 | 576,602 |
| Active Idle | 0 | 0 | |

| Target Load | Actual Load | ssj_ops | |
|---|---|---|---|
| Target | Actual | ||
| Calibration 1 | 5,698,483 | ||
| Calibration 2 | 5,689,222 | ||
| Calibration 3 | 5,703,141 | ||
| ssj_ops@calibrated=5,696,181 | |||
| 100% | 99.9% | 5,696,181 | 5,688,854 |
| 90% | 89.9% | 5,126,563 | 5,121,985 |
| 80% | 79.9% | 4,556,945 | 4,553,909 |
| 70% | 70.0% | 3,987,327 | 3,986,568 |
| 60% | 60.0% | 3,417,709 | 3,415,288 |
| 50% | 50.0% | 2,848,091 | 2,848,234 |
| 40% | 39.8% | 2,278,473 | 2,267,292 |
| 30% | 30.0% | 1,708,854 | 1,706,406 |
| 20% | 20.0% | 1,139,236 | 1,140,432 |
| 10% | 10.0% | 569,618 | 570,381 |
| Active Idle | 0 | 0 | |

| Target Load | Actual Load | ssj_ops | |
|---|---|---|---|
| Target | Actual | ||
| Calibration 1 | 5,676,382 | ||
| Calibration 2 | 5,668,741 | ||
| Calibration 3 | 5,678,200 | ||
| ssj_ops@calibrated=5,673,470 | |||
| 100% | 99.9% | 5,673,470 | 5,666,277 |
| 90% | 90.0% | 5,106,123 | 5,106,134 |
| 80% | 80.0% | 4,538,776 | 4,538,030 |
| 70% | 70.0% | 3,971,429 | 3,974,121 |
| 60% | 59.9% | 3,404,082 | 3,400,580 |
| 50% | 49.9% | 2,836,735 | 2,833,736 |
| 40% | 40.0% | 2,269,388 | 2,271,066 |
| 30% | 30.0% | 1,702,041 | 1,704,188 |
| 20% | 20.0% | 1,134,694 | 1,135,243 |
| 10% | 10.0% | 567,347 | 566,659 |
| Active Idle | 0 | 0 | |

| Target Load | Actual Load | ssj_ops | |
|---|---|---|---|
| Target | Actual | ||
| Calibration 1 | 5,705,594 | ||
| Calibration 2 | 5,704,616 | ||
| Calibration 3 | 5,717,977 | ||
| ssj_ops@calibrated=5,711,296 | |||
| 100% | 99.9% | 5,711,296 | 5,704,210 |
| 90% | 90.0% | 5,140,166 | 5,139,019 |
| 80% | 80.0% | 4,569,037 | 4,570,281 |
| 70% | 70.1% | 3,997,907 | 4,000,789 |
| 60% | 60.0% | 3,426,778 | 3,429,270 |
| 50% | 50.0% | 2,855,648 | 2,856,625 |
| 40% | 40.0% | 2,284,518 | 2,285,040 |
| 30% | 30.0% | 1,713,389 | 1,714,396 |
| 20% | 20.0% | 1,142,259 | 1,142,588 |
| 10% | 10.0% | 571,130 | 570,738 |
| Active Idle | 0 | 0 | |

| Target Load | Actual Load | ssj_ops | |
|---|---|---|---|
| Target | Actual | ||
| Calibration 1 | 5,680,945 | ||
| Calibration 2 | 5,677,288 | ||
| Calibration 3 | 5,685,051 | ||
| ssj_ops@calibrated=5,681,169 | |||
| 100% | 99.9% | 5,681,169 | 5,677,961 |
| 90% | 90.0% | 5,113,052 | 5,110,588 |
| 80% | 80.0% | 4,544,935 | 4,545,816 |
| 70% | 70.0% | 3,976,819 | 3,975,532 |
| 60% | 60.0% | 3,408,702 | 3,410,264 |
| 50% | 50.0% | 2,840,585 | 2,841,547 |
| 40% | 40.0% | 2,272,468 | 2,272,275 |
| 30% | 30.0% | 1,704,351 | 1,706,517 |
| 20% | 20.0% | 1,136,234 | 1,134,139 |
| 10% | 10.0% | 568,117 | 567,171 |
| Active Idle | 0 | 0 | |

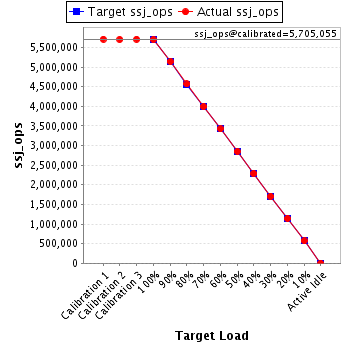
| Target Load | Actual Load | ssj_ops | |
|---|---|---|---|
| Target | Actual | ||
| Calibration 1 | 5,709,784 | ||
| Calibration 2 | 5,700,543 | ||
| Calibration 3 | 5,709,567 | ||
| ssj_ops@calibrated=5,705,055 | |||
| 100% | 99.9% | 5,705,055 | 5,699,021 |
| 90% | 90.1% | 5,134,550 | 5,139,643 |
| 80% | 80.1% | 4,564,044 | 4,568,050 |
| 70% | 70.0% | 3,993,539 | 3,993,788 |
| 60% | 60.0% | 3,423,033 | 3,422,274 |
| 50% | 50.0% | 2,852,528 | 2,849,912 |
| 40% | 40.0% | 2,282,022 | 2,282,965 |
| 30% | 29.9% | 1,711,517 | 1,708,051 |
| 20% | 20.0% | 1,141,011 | 1,140,931 |
| 10% | 10.0% | 570,506 | 570,223 |
| Active Idle | 0 | 0 | |
| Target Load | Actual Load | ssj_ops | |
|---|---|---|---|
| Target | Actual | ||
| Calibration 1 | 5,710,979 | ||
| Calibration 2 | 5,695,045 | ||
| Calibration 3 | 5,713,886 | ||
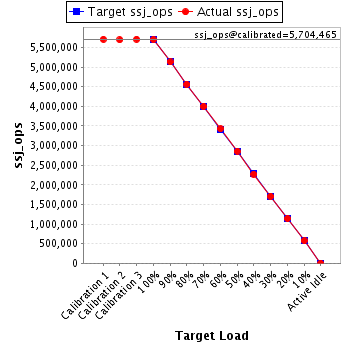
| ssj_ops@calibrated=5,704,465 | |||
| 100% | 100.0% | 5,704,465 | 5,703,371 |
| 90% | 90.0% | 5,134,019 | 5,132,826 |
| 80% | 80.0% | 4,563,572 | 4,564,063 |
| 70% | 70.2% | 3,993,126 | 4,002,388 |
| 60% | 60.1% | 3,422,679 | 3,426,786 |
| 50% | 50.1% | 2,852,233 | 2,858,215 |
| 40% | 39.9% | 2,281,786 | 2,273,681 |
| 30% | 30.0% | 1,711,340 | 1,708,501 |
| 20% | 20.0% | 1,140,893 | 1,139,153 |
| 10% | 10.0% | 570,447 | 572,440 |
| Active Idle | 0 | 0 | |
| Target Load | Actual Load | ssj_ops | |
|---|---|---|---|
| Target | Actual | ||
| Calibration 1 | 5,681,272 | ||
| Calibration 2 | 5,671,828 | ||
| Calibration 3 | 5,683,202 | ||
| ssj_ops@calibrated=5,677,515 | |||
| 100% | 99.8% | 5,677,515 | 5,667,214 |
| 90% | 90.0% | 5,109,764 | 5,109,869 |
| 80% | 79.9% | 4,542,012 | 4,536,837 |
| 70% | 70.0% | 3,974,261 | 3,973,144 |
| 60% | 59.8% | 3,406,509 | 3,397,438 |
| 50% | 50.1% | 2,838,758 | 2,842,067 |
| 40% | 40.0% | 2,271,006 | 2,268,624 |
| 30% | 29.9% | 1,703,255 | 1,700,398 |
| 20% | 20.0% | 1,135,503 | 1,136,331 |
| 10% | 9.9% | 567,752 | 564,663 |
| Active Idle | 0 | 0 | |

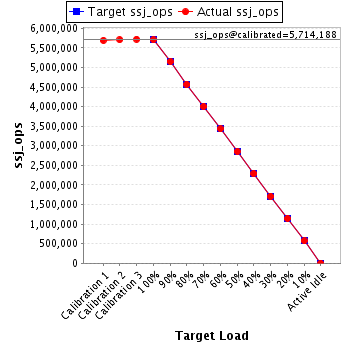
| Target Load | Actual Load | ssj_ops | |
|---|---|---|---|
| Target | Actual | ||
| Calibration 1 | 5,691,936 | ||
| Calibration 2 | 5,706,419 | ||
| Calibration 3 | 5,721,958 | ||
| ssj_ops@calibrated=5,714,188 | |||
| 100% | 99.8% | 5,714,188 | 5,703,694 |
| 90% | 90.1% | 5,142,770 | 5,147,081 |
| 80% | 79.9% | 4,571,351 | 4,566,804 |
| 70% | 70.1% | 3,999,932 | 4,006,622 |
| 60% | 60.0% | 3,428,513 | 3,428,412 |
| 50% | 49.9% | 2,857,094 | 2,853,229 |
| 40% | 40.0% | 2,285,675 | 2,284,985 |
| 30% | 30.0% | 1,714,257 | 1,712,543 |
| 20% | 20.0% | 1,142,838 | 1,143,395 |
| 10% | 10.0% | 571,419 | 571,851 |
| Active Idle | 0 | 0 | |